Debugging playbook
Practical techniques for diagnosing and fixing UDFs — from slow code to failed parallel jobs.
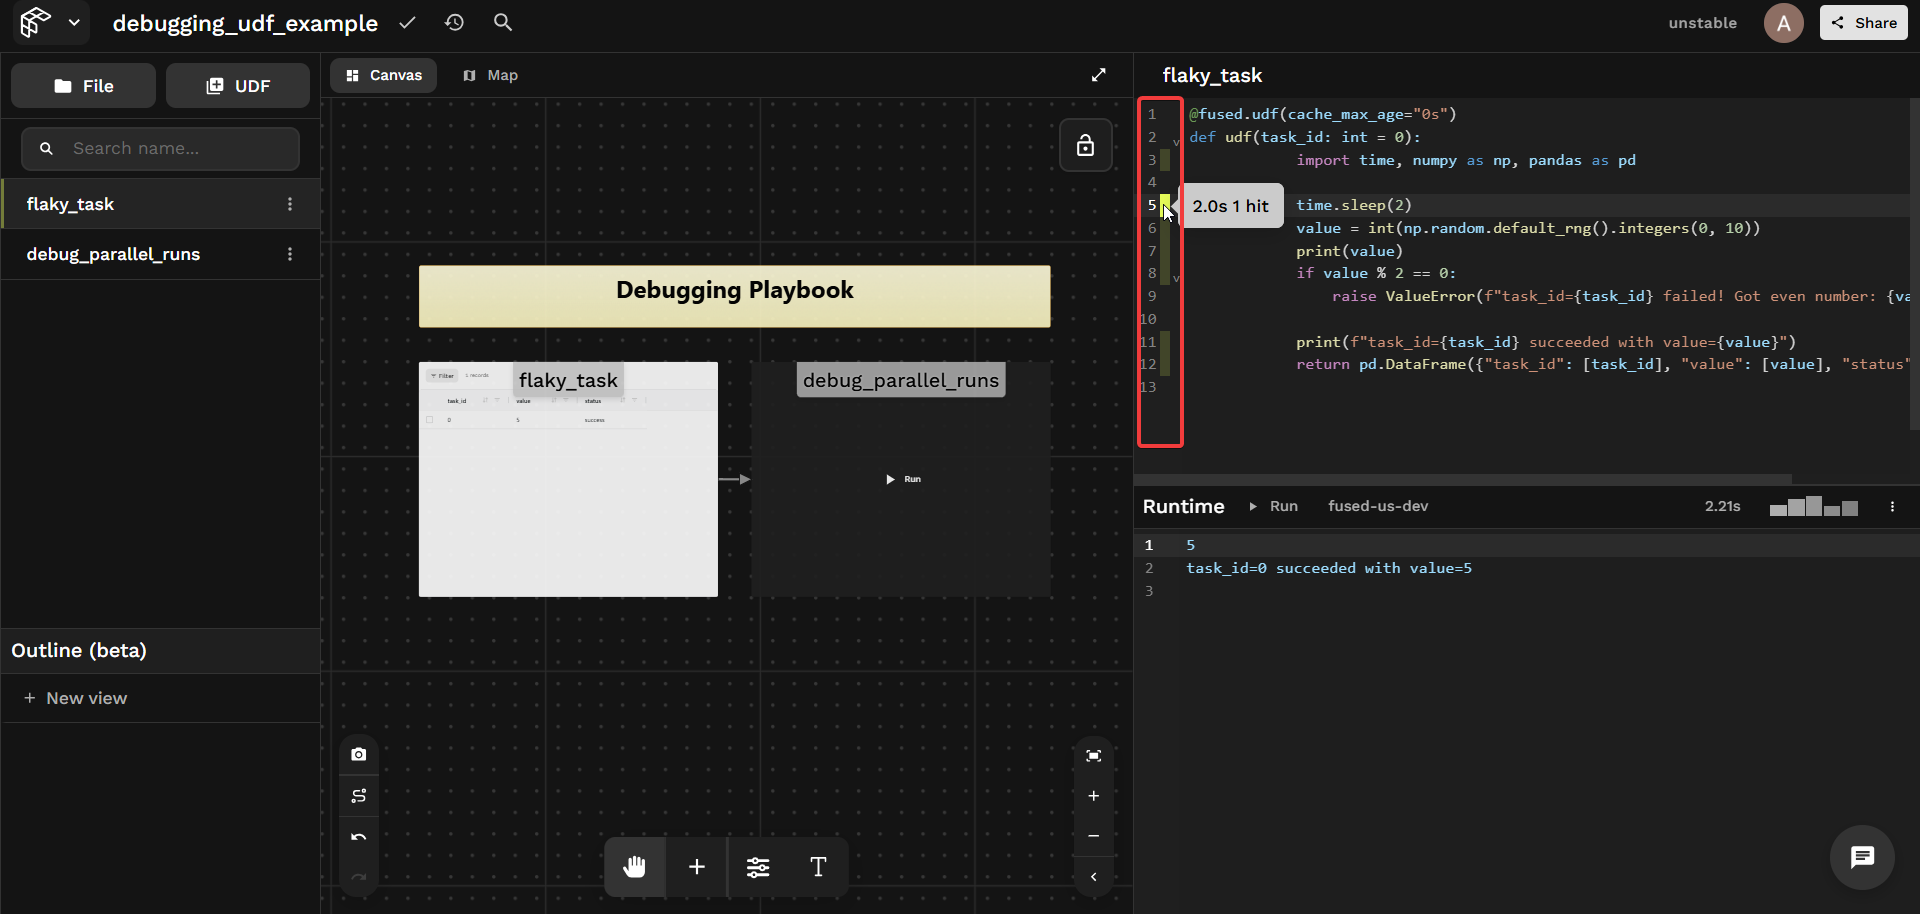
Use the inline profiler
Workbench includes a built-in line-by-line profiler. After a run, each line shows its execution time and hit count — no instrumentation needed.
Things to look for:
- A slow I/O call dominating total runtime
- A loop body running far more times than expected
- A
@fused.cachefunction showing a cache miss on every run
print intermediate results
print() output appears directly in the Workbench results panel. Drop prints wherever you need to track what's happening:
# doctest: skip
print(f"task_id={task_id} got value={value}")
Anything you print() is visible to anyone calling your UDF — don't print secrets, credentials, or environment variables. See Write UDFs securely for guidance.
Bust the cache
Cached results can mask bugs — a fix won't appear until the cache is invalidated. There are two independent caches:
| Cache | Cleared by |
|---|---|
| UDF cache | cache=False at call time, or cache_max_age="0s" on the UDF |
| Workbench cache | Clear cache button in the Workbench toolbar |
Clear cache only clears the Workbench-level cache. Calls via the HTTP endpoint use a separate cache. See Each execution context has its own cache.
Disable the UDF cache at call time:
# doctest: skip
pool = flaky_task.map(task_ids, cache=False)
Or permanently during development:
@fused.udf(cache_max_age="0s")
def udf(): ...
Force-reset a @fused.cache function:
@fused.cache(cache_reset=True)
def load_data(path): ...
Debug parallel runs
udf.map() returns a JobPool. If any jobs fail, calling .df() will raise — use the pool's inspection API instead to understand what happened across all jobs.
The examples below use flaky_task — a UDF that sleeps 2s and raises a ValueError on ~50% of runs. Try it out →
@fused.udf(cache_max_age="0s")
def udf(task_id: int = 0):
    import time, numpy as np, pandas as pd

    time.sleep(2)
    value = int(np.random.default_rng().integers(0, 10))

    if value % 2 == 0:
        raise ValueError(f"task_id={task_id} failed! Got even number: {value}")

    return pd.DataFrame({"task_id": [task_id], "value": [value], "status": ["success"]})
Start small
Before scaling to hundreds of inputs, test with 2–3 first. Change n_tasks directly in Workbench — once it works at small scale, increase it:
flaky_task = fused.load("flaky_task")
pool = flaky_task.map(list(range(n_tasks)), cache=False)  # try n_tasks=2 first
pool.wait()
Now use the pool to inspect what happened.
Check overall status
pool.status() returns a count of outcomes. all_succeeded() and any_failed() give quick boolean checks:
# doctest: skip
pool.status()
# status
# success    5
# error      1
# Name: count, dtype: int64

pool.all_succeeded()  # False
pool.any_failed()     # True
Inspecting errors
first_error() gives you the first failure with full detail — the fastest way to triage. errors() returns the list of all failures:
# doctest: skip
pool.first_error()
# Run #3
# {
#   "task_id": 3
# }
# The UDF returned the following error in line 22:
# ValueError: task_id=3 failed! Got even number: 8

pool.errors()
# [UdfRuntimeError: Run #3 ...]
Check per-job timing
times() returns per-job durations — useful for spotting outliers or hung jobs:
# doctest: skip
pool.times()
# [timedelta(seconds=2, microseconds=565825),
#  timedelta(seconds=2, microseconds=580730),
#  timedelta(seconds=4, microseconds=352142),
#  timedelta(seconds=2, microseconds=507098),
#  timedelta(seconds=2, microseconds=561703),
#  timedelta(seconds=9, microseconds=824293)]
Inspect every result
results(return_exceptions=True) returns one entry per job — a DataFrame on success, an exception on failure:
# doctest: skip
mixed = pool.results(return_exceptions=True)

# task 0: DataFrame shape=(1, 3)
# task 1: DataFrame shape=(1, 3)
# task 2: DataFrame shape=(1, 3)
# task 3: UdfRuntimeError: task_id=3 failed! Got even number: 8
# task 4: DataFrame shape=(1, 3)
# task 5: DataFrame shape=(1, 3)

Retry failed jobs
pool.retry() re-runs only the failed jobs without restarting the whole batch:
# doctest: skip
if pool.any_failed():
    pool.retry()
    pool.wait()

pool.status()
# status
# success    6
# Name: count, dtype: int64