Building a Climate dashboard
We're going to build an interactive dashboard of global temperature data, after processing 1TB of data in a few minutes!
Install fused
pip install "fused[all]"
Read more about installing Fused here.
Authenticate in Fused
In a notebook:
# doctest: skip
from fused.api import NotebookCredentials

credentials = NotebookCredentials()
print(credentials.url)
Follow the link to authenticate.
Read more about authenticating in Fused.
Processing 1 month
ERA5 global weather data was ingested using Fused ingestion pipeline.
import fused
- DuckDB
- Pandas
  @fused.udf
  def udf(
      month: str = "2024-01",
  ):
      import re
      import duckdb

      if not re.fullmatch(r"\d{4}-\d{2}", month):
          raise ValueError("month must be YYYY-MM")

      path_glob = f"s3://fused-asset/data/era5/t2m/datestr={month}-*/*.parquet"
      con = duckdb.connect()
      result = con.execute(
          """
          SELECT
              datestr::VARCHAR AS datestr,
              ROUND(AVG(daily_mean), 2) AS daily_mean_temp
          FROM read_parquet(?)
          GROUP BY datestr
          ORDER BY datestr
          """,
          [path_glob],
      ).df()

      # Mount is accessible by Fused UDFs / Workbench
      output_fp = fused.file_path(f"monthly_climate/{month}.pq")
      result.to_parquet(output_fp)

      return output_fp
NOTE: pandas approach is a bit slower than DuckDB.
@fused.udf
def udf(month: str = "2024-01",):
    import pandas as pd

    files = fused.api.list(f"s3://fused-asset/data/era5/t2m/datestr={month}-")

    dfs = [pd.read_parquet(file, columns=['daily_mean']).assign(datestr=file.split('datestr=')[1].split('/')[0]) for file in files]
    result = pd.concat(dfs).groupby('datestr')['daily_mean'].mean().round(2).reset_index()

    # Mount is accessible by Fused UDFs / Workbench
    output_fp = fused.file_path(f"monthly_climate/{month}.pq")
    result.to_parquet(output_fp)

    return result
Read more about fused.file_path() and mount
Executing this from a notebook:
# doctest: skip
fused.run(udf)
We only return the file path to limit moving data from Fused server < - > our notebook. Hence why we print the dataframe:
>>>   result.T=                         0           1   ...          29          30
datestr          2024-01-01  2024-01-02  ...  2024-01-30  2024-01-31
daily_mean_temp      277.85      277.63  ...      277.93      278.11
20 years of data (1TB in < 1min!)
Explore the available data for yourself in File Explorer
We'll process 20 years of data:
data_until = 2005

available_days = fused.api.list('s3://fused-asset/data/era5/t2m/')
recent_months = list(set([
   path.split('datestr=')[1][:7] for path in available_days
   if int(path.split('datestr=')[1][:4]) >= data_until
]))
This corresponds to ~1TB of data!
Size of data quick calculation
Each file being about 140MB a quick back of the envelope calculation gives us:
# doctest: skip
recent_days = [day for day in available_days if day.split('datestr=')[1][:7] in recent_months]
len(recent_days) * 140 / 1000 # size in GB of files we'll process
1005.62
Fused allows us to run a UDF in parallel. So we'll process 1 month of data across hundreds of jobs:
results = fused.submit(
  udf,
  recent_months,
  max_workers=250,
  collect=False
)
See a progress bar of jobs running:
# doctest: skip
results.wait()
See how long all the jobs took:
# doctest: skip
results.total_time()
>>> datetime.timedelta(seconds=40, ...)
We just processed 20 years of worldwide global data, over 1TB in 40s!!
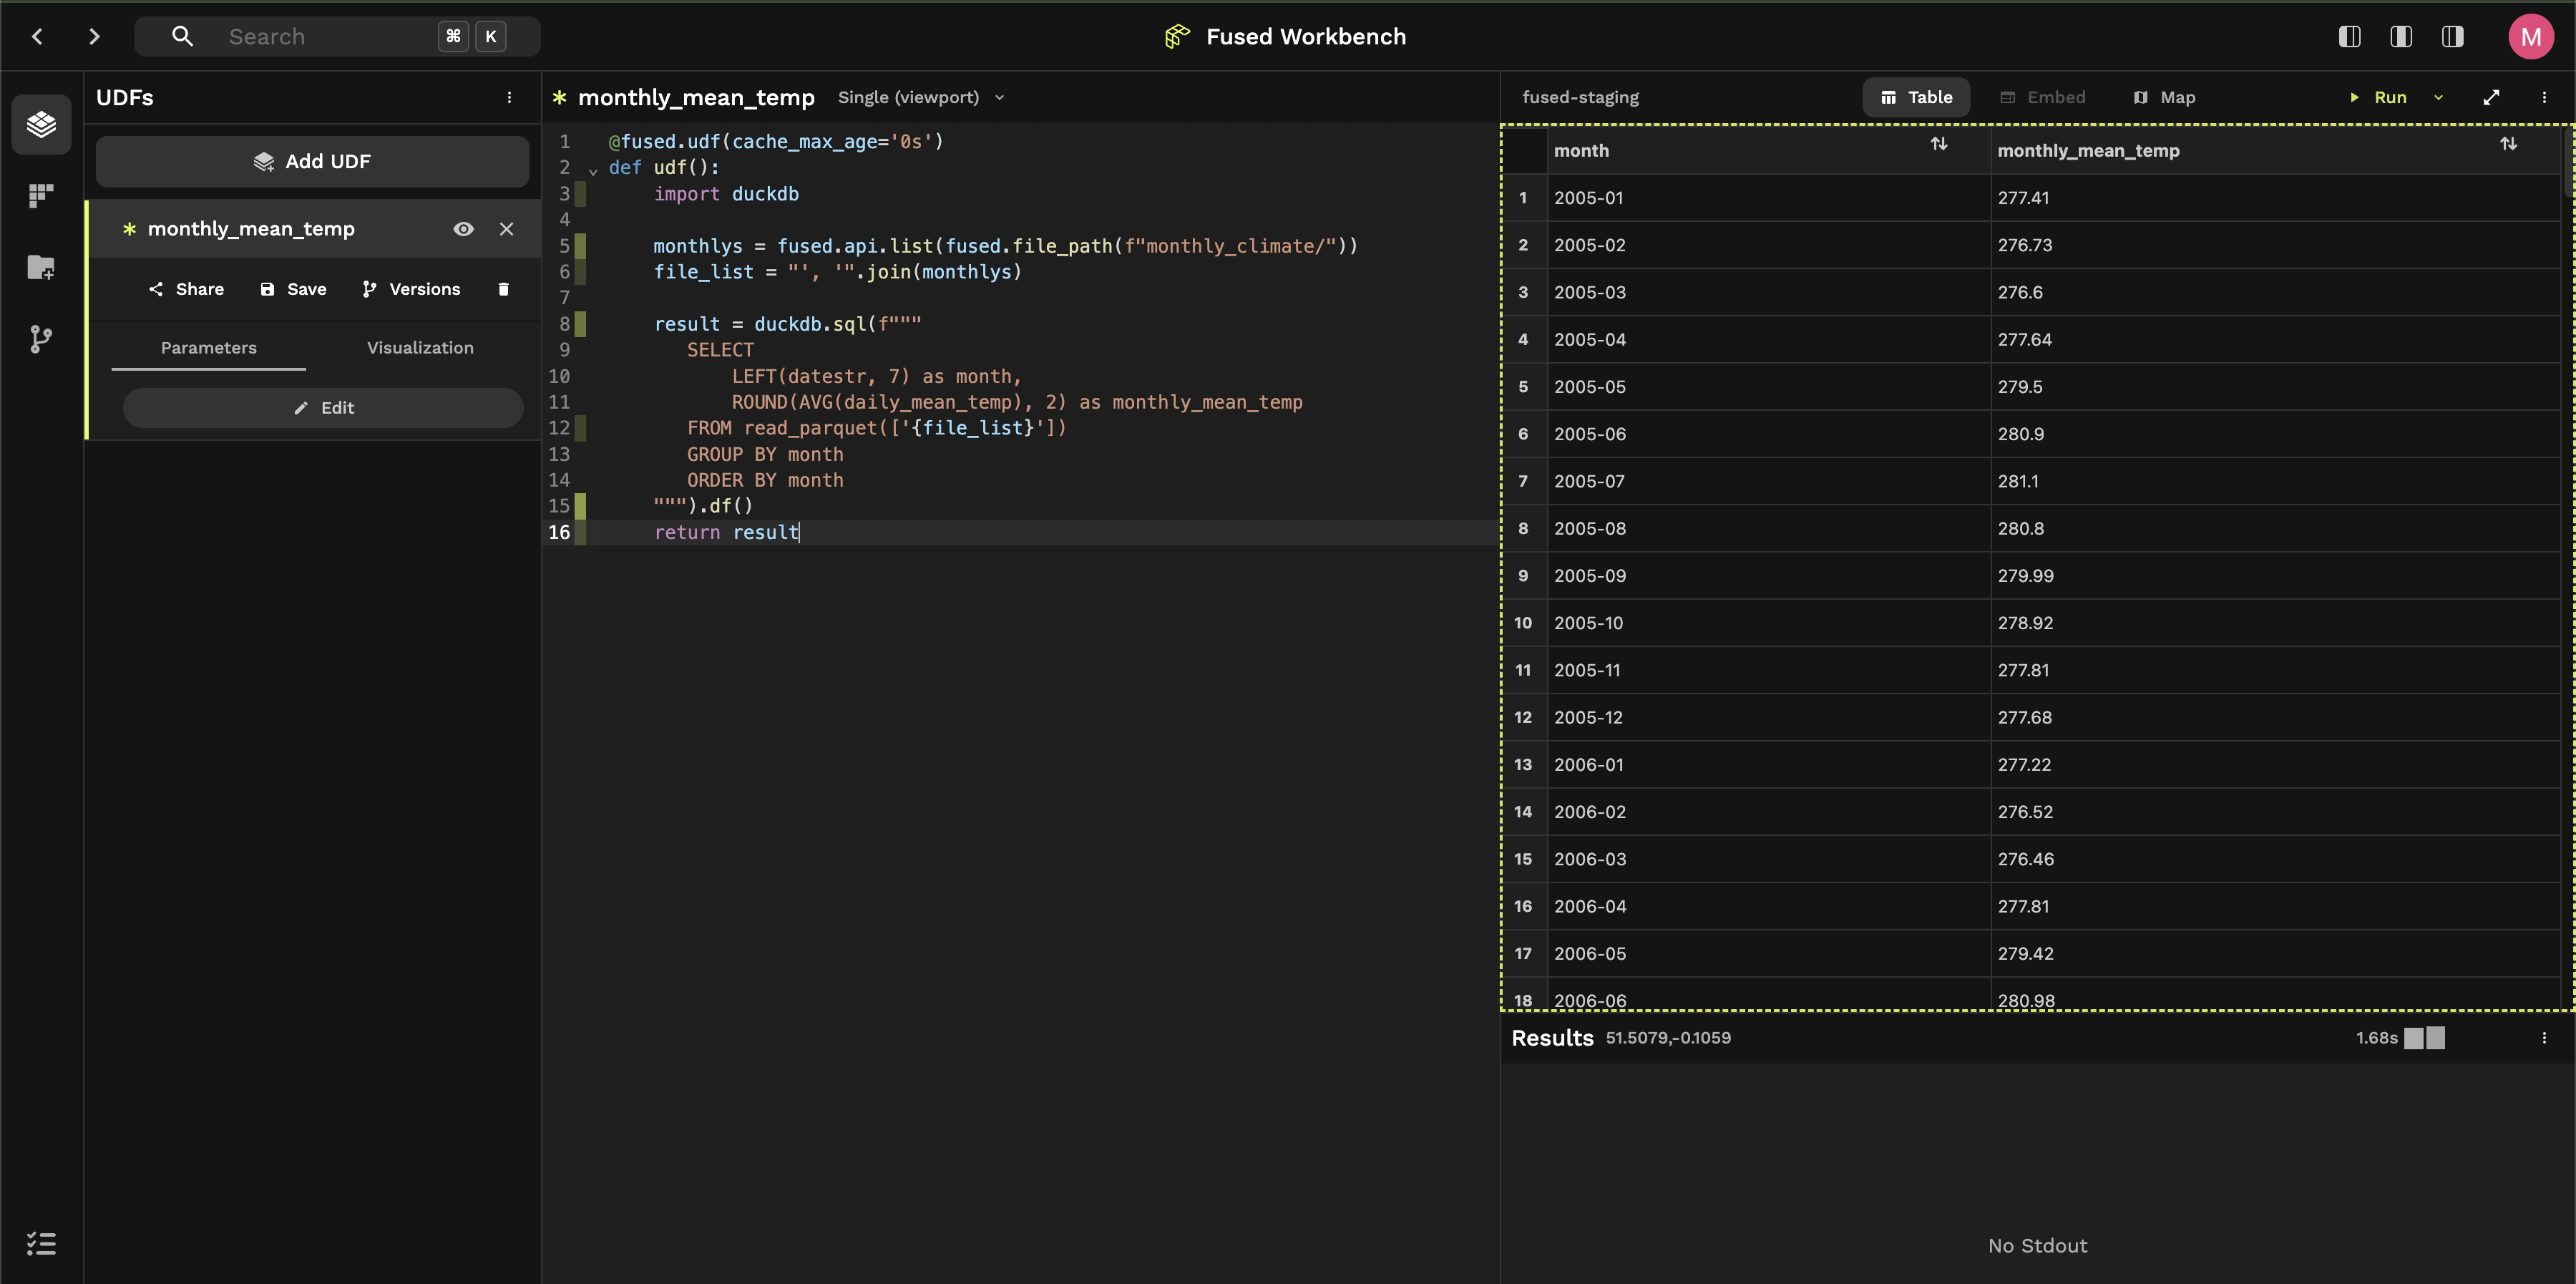
We can now write a UDF that gets all the monthly data and aggregates it by month:
@fused.udf(cache_max_age='0s')
def udf():
    import duckdb

    monthlys = fused.api.list(fused.file_path(f"monthly_climate/"))
    con = duckdb.connect()
    result = con.execute(
        """
        SELECT
            LEFT(datestr, 7) AS month,
            ROUND(AVG(daily_mean_temp), 2) AS monthly_mean_temp
        FROM read_parquet(?)
        GROUP BY month
        ORDER BY month
        """,
        [monthlys],
    ).df()

    return result
Instead of running this locally, we'll open it in Workbench, Fused's web-based IDE:
# Save to Fused
udf.to_fused("monthly_mean_temp")

# Load again to get the Workbench URL
loaded_udf = fused.load("monthly_mean_temp")
Return loaded_udf in a notebook and you'll get a URL that takes you to Workbench:
# doctest: skip
loaded_udf
Click on the link to open the UDF in Workbench. Click "+ Add to UDF Builder"
Interactive graph (with AI)
You can use the AI Chat to help you vibe code an interactive timeseries of your data
Simply ask the AI:
Make an interactive graph of the monthly temperature data
You can then share your graph:
- Save (
Cmd + Son MacOS or click the "Save" button) - Click "URL" button to see deployed graph!
Any time you make an update, your graph will automatically update!