Making Overture Buildings Data Accessible to Agents
This example shows how to turn Fused UDF pipelines into agentic workflows: ask questions over massive datasets while compute stays behind the scenes and agents see only the scoped outputs needed to query, compare, and visualize results.
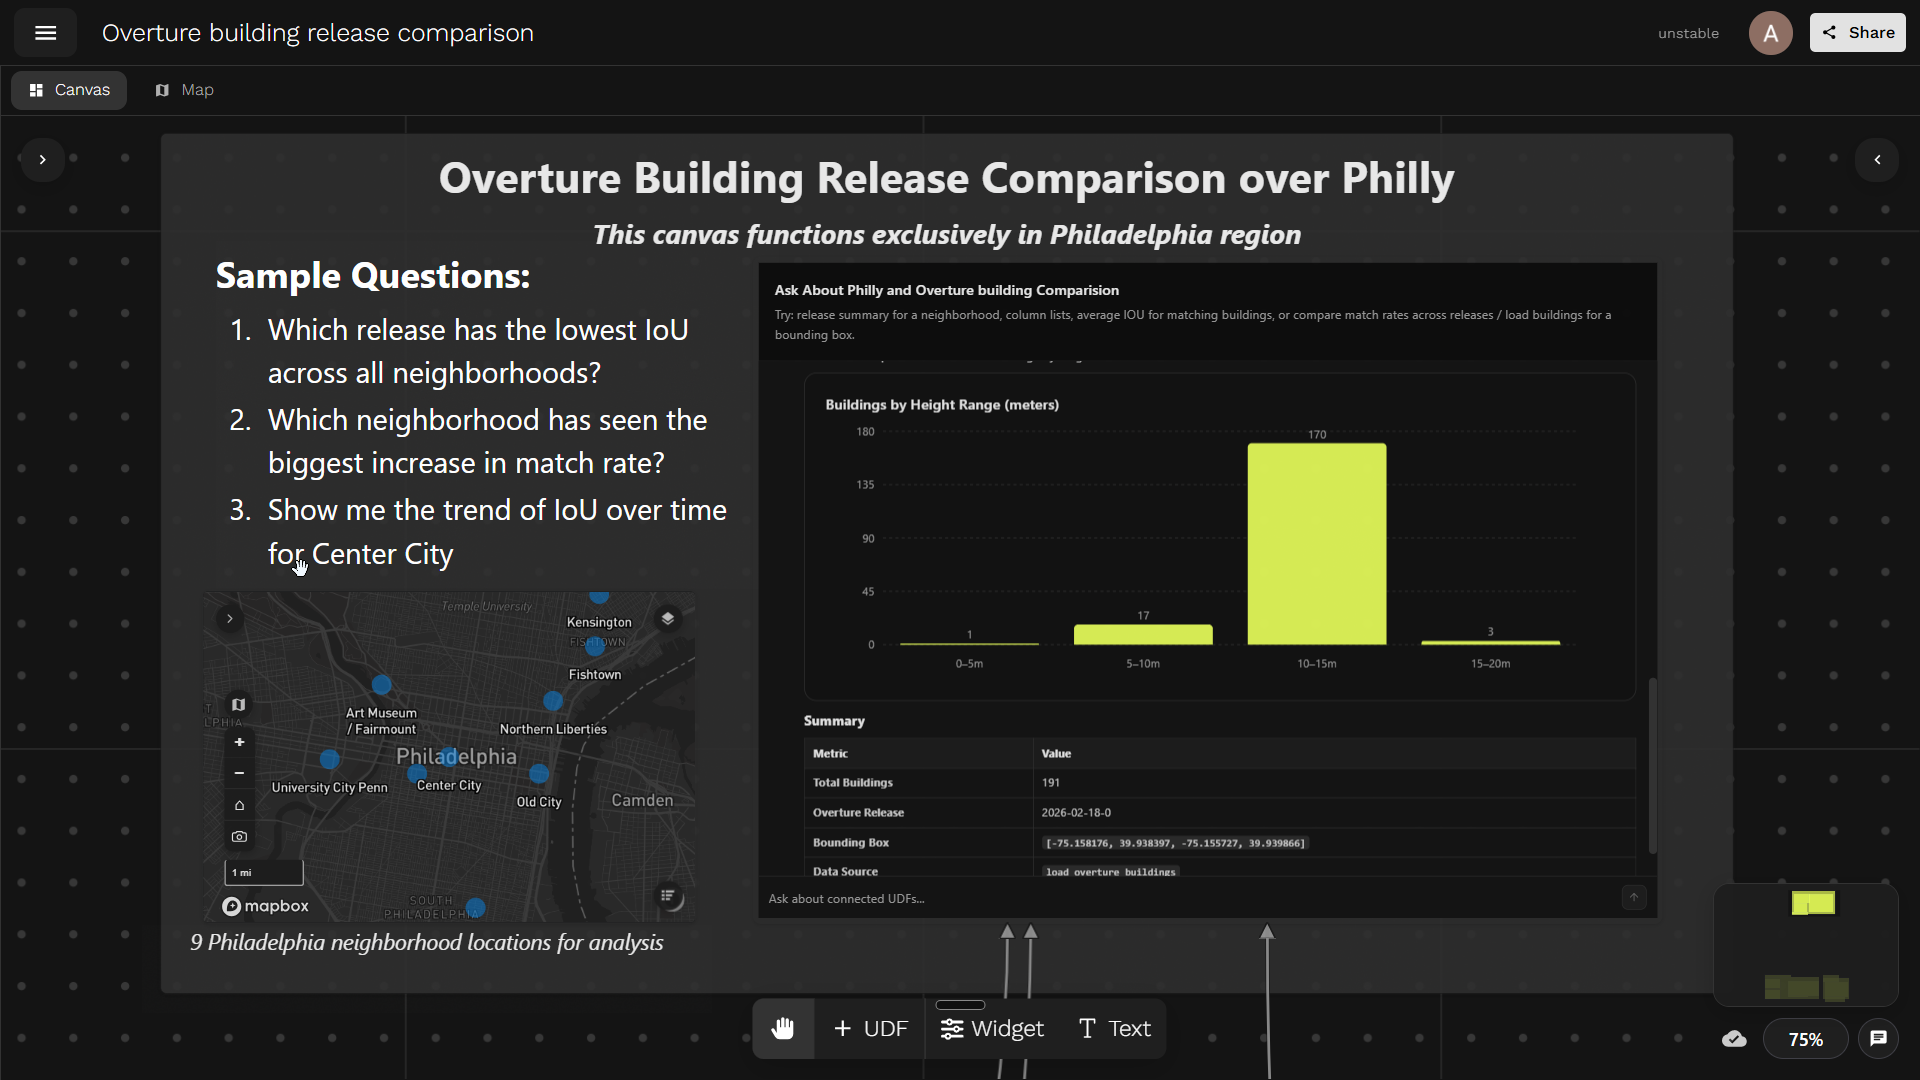
Overture Building Release Comparison canvas. Try it out →
Overture Maps ships frequent global building-footprint releases, but the data is huge: hundreds of gigabytes of geometry per release, far too much for anyone to manually diff across versions. With agentic workflows, we can flip the approach: instead of building one-off analyses for every question about data quality, expose the dataset to an agent that can query, compare, and visualize changes across releases on demand.
The key is to give the agent scoped analytics: structured summaries and interactive widgets that are easy to parse and render, while the heavy geometry and compute stay behind the scenes. By packaging these analytics as bounded MCP tools, the agent does the analytical lifting and humans stay in the loop through shareable visualizations.
We want to analyse how Overture's building dataset evolves across releases — by asking simple questions in plain language, without touching the raw data directly.
This example will help you:
- Scope UDFs as agent-friendly MCP tools with clear parameters and bounded outputs
- Join together multiple UDFs, turning a Fused Canvas into an MCP server
- Build a shareable chatbot that answers analytical questions with interactive widgets
Getting Data
We compare two data sources across Philadelphia:
- Philadelphia's official building footprints — the city's authoritative layer, served from Philadelphia's ArcGIS Feature Server: polygons with height, address, and name.
Show load_philly_buildings UDF code
import fused

PHILLY_BOUNDS = (-75.27943327075063, 39.87237043855194, -74.95729745028228, 40.13778135004081)
CHUNK_SIZE = 0.02
CACHE_VERSION = "1"

PHILLY_URL = (
    "https://services.arcgis.com/fLeGjb7u4uXqeF9q/arcgis/rest/services/"
    "LI_BUILDING_FOOTPRINTS/FeatureServer/0/query"
)

OUT_COLS = [
    "objectid",
    "approx_hgt",
    "building_name",
    "address",
    "value",
    "geometry",
]


@fused.udf
def udf(bounds: str = "[-75.158176,39.938397,-75.155727,39.939866]"):
    import json
    import geopandas as gpd
    import pandas as pd
    from shapely.geometry import box

    def empty():
        return gpd.GeoDataFrame(
            columns=["objectid", "geometry"],
            geometry="geometry",
            crs="EPSG:4326",
        )

    bounds = tuple(map(float, json.loads(bounds) if isinstance(bounds, str) else bounds))

    layer_minx, layer_miny, layer_maxx, layer_maxy = PHILLY_BOUNDS

    minx = max(bounds[0], layer_minx)
    miny = max(bounds[1], layer_miny)
    maxx = min(bounds[2], layer_maxx)
    maxy = min(bounds[3], layer_maxy)

    if minx >= maxx or miny >= maxy:
        return empty()

    eps = 1e-12

    col_start = int((minx - layer_minx) // CHUNK_SIZE)
    col_end = int(((maxx - layer_minx) - eps) // CHUNK_SIZE)
    row_start = int((miny - layer_miny) // CHUNK_SIZE)
    row_end = int(((maxy - layer_miny) - eps) // CHUNK_SIZE)

    frames = []

    for row in range(row_start, row_end + 1):
        for col in range(col_start, col_end + 1):
            gdf = _load_philly_chunk(f"{col}:{row}", CACHE_VERSION)
            if gdf is not None and not gdf.empty:
                frames.append(gdf)

    if not frames:
        return empty()

    gdf = gpd.GeoDataFrame(
        pd.concat(frames, ignore_index=True),
        geometry="geometry",
        crs="EPSG:4326",
    )

    if "objectid" in gdf.columns:
        gdf = gdf.drop_duplicates("objectid")

    gdf = gdf[gdf.intersects(box(*bounds))].copy()

    if gdf.empty:
        return empty()

    gdf["value"] = gdf["approx_hgt"].fillna(0).astype(float)

    keep = [c for c in OUT_COLS if c in gdf.columns]
    return gdf[keep].reset_index(drop=True)


@fused.cache(
    cache_max_age="7d",
    cache_folder_path="philly_building_chunks",
    cache_storage="auto",
)
def _load_philly_chunk(chunk_id, cache_version=CACHE_VERSION):
    import json
    import geopandas as gpd
    import requests

    bounds = _chunk_bounds(chunk_id)

    envelope = {
        "xmin": bounds[0],
        "ymin": bounds[1],
        "xmax": bounds[2],
        "ymax": bounds[3],
        "spatialReference": {"wkid": 4326},
    }

    features = []
    page_size = 2000
    max_features = 50000

    for offset in range(0, max_features, page_size):
        response = requests.get(
            PHILLY_URL,
            params={
                "where": "1=1",
                "geometry": json.dumps(envelope),
                "geometryType": "esriGeometryEnvelope",
                "spatialRel": "esriSpatialRelIntersects",
                "inSR": 4326,
                "outSR": 4326,
                "outFields": "objectid,approx_hgt,building_name,address",
                "returnGeometry": "true",
                "f": "geojson",
                "resultOffset": offset,
                "resultRecordCount": page_size,
            },
            timeout=30,
        )
        response.raise_for_status()

        batch = response.json().get("features", [])
        if not batch:
            break

        features.extend(batch)

        if len(batch) < page_size:
            break

    if not features:
        return gpd.GeoDataFrame(
            columns=["objectid", "geometry"],
            geometry="geometry",
            crs="EPSG:4326",
        )

    return gpd.GeoDataFrame.from_features(
        {"type": "FeatureCollection", "features": features},
        crs="EPSG:4326",
    )


def _chunk_bounds(chunk_id):
    col, row = map(int, str(chunk_id).split(":"))

    minx = PHILLY_BOUNDS[0] + col * CHUNK_SIZE
    miny = PHILLY_BOUNDS[1] + row * CHUNK_SIZE

    return (
        minx,
        miny,
        min(minx + CHUNK_SIZE, PHILLY_BOUNDS[2]),
        min(miny + CHUNK_SIZE, PHILLY_BOUNDS[3]),
    )
- Overture Maps Foundation building footprints — the open dataset maintained by the Overture Maps Foundation. We pull data from 7 releases (December 2024 through February 2026) to track how the dataset evolves. This builds on our earlier work Partnering with Overture. Each release contains millions of building polygons globally, so we filter down to the same Philadelphia bounding boxes.
Show load_overture_buildings UDF code
import fused

PHILLY_BOUNDS = (-75.27943327075063, 39.87237043855194, -74.95729745028228, 40.13778135004081)
CHUNK_SIZE = 0.02
CACHE_VERSION = "1"
OUT_COLS = ["id", "overture_name", "height", "geometry"]


@fused.udf
def udf(
    bounds: str = "[-75.158176,39.938397,-75.155727,39.939866]",
    overture_release: str = "2026-02-18-0",
):
    import json
    import geopandas as gpd
    import pandas as pd
    from shapely.geometry import box

    empty = lambda: gpd.GeoDataFrame(
        columns=["id", "geometry"],
        geometry="geometry",
        crs="EPSG:4326",
    )

    bounds = tuple(map(float, json.loads(bounds) if isinstance(bounds, str) else bounds))

    layer_minx, layer_miny, layer_maxx, layer_maxy = PHILLY_BOUNDS
    minx = max(bounds[0], layer_minx)
    miny = max(bounds[1], layer_miny)
    maxx = min(bounds[2], layer_maxx)
    maxy = min(bounds[3], layer_maxy)

    if minx >= maxx or miny >= maxy:
        return empty()

    eps = 1e-12

    col_start = int((minx - layer_minx) // CHUNK_SIZE)
    col_end = int(((maxx - layer_minx) - eps) // CHUNK_SIZE)
    row_start = int((miny - layer_miny) // CHUNK_SIZE)
    row_end = int(((maxy - layer_miny) - eps) // CHUNK_SIZE)

    frames = []
    for row in range(row_start, row_end + 1):
        for col in range(col_start, col_end + 1):
            gdf = _load_chunk(f"{col}:{row}", overture_release, CACHE_VERSION)
            if gdf is not None and not gdf.empty:
                frames.append(gdf)

    if not frames:
        return empty()

    gdf = gpd.GeoDataFrame(
        pd.concat(frames, ignore_index=True),
        geometry="geometry",
        crs="EPSG:4326",
    )

    if "id" in gdf.columns:
        gdf = gdf.drop_duplicates("id")

    gdf = gdf[gdf.intersects(box(*bounds))].reset_index(drop=True)

    if gdf.empty:
        return empty()

    keep = [c for c in OUT_COLS if c in gdf.columns]
    return gdf[keep]


@fused.cache(
    cache_max_age="30d",
)
def _load_chunk(chunk_id, overture_release, cache_version=CACHE_VERSION):
    minx, miny, maxx, maxy = _chunk_bounds(chunk_id)

    overture = fused.load("UDF_Overture_Maps_Example")
    gdf = overture(
        bounds=[minx, miny, maxx, maxy],
        release=overture_release,
        overture_type="building",
        theme="buildings",
    )

    if gdf is None or gdf.empty:
        return gdf

    if "names" in gdf.columns:
        gdf["overture_name"] = gdf["names"].apply(
            lambda v: v.get("primary", "") if isinstance(v, dict) else ("" if v is None else str(v))
        )
    else:
        gdf["overture_name"] = ""

    if "id" not in gdf.columns:
        gdf["id"] = ""

    keep = [c for c in OUT_COLS if c in gdf.columns]
    return gdf[keep].reset_index(drop=True)


def _chunk_bounds(chunk_id):
    col, row = map(int, str(chunk_id).split(":"))

    minx = PHILLY_BOUNDS[0] + col * CHUNK_SIZE
    miny = PHILLY_BOUNDS[1] + row * CHUNK_SIZE

    return (
        minx,
        miny,
        min(minx + CHUNK_SIZE, PHILLY_BOUNDS[2]),
        min(miny + CHUNK_SIZE, PHILLY_BOUNDS[3]),
    )
To measure how well Overture buildings match the city's ground truth, we compute Intersection over Union (IoU):
IoU = area(intersection) / area(union)
The logic is simple: for each Philadelphia building, we find its best-matching Overture building via polygon overlay, compute the intersection area, and derive IoU. A perfect overlap gives IoU = 1.0; no overlap gives 0.0.
Show compute_iou UDF code
import fused


@fused.udf
def udf(
    map_bounds: str = "[-75.158176,39.938397,-75.155727,39.939866]",
    overture_release: str = "2026-02-18-0",
):
    import geopandas as gpd

    load_overture = fused.load("load_overture_buildings")
    load_philly = fused.load("load_philly_buildings")

    gdf_overture = load_overture(
        bounds=map_bounds,
        overture_release=overture_release,
    ).reset_index(drop=True)

    gdf_philly = load_philly(bounds=map_bounds).reset_index(drop=True)

    if len(gdf_philly) == 0:
        return _empty_result()

    if len(gdf_overture) == 0:
        gdf_philly["iou"] = 0.0
        gdf_philly["gers_id"] = ""
        return _finalize(gdf_philly, overture_release)

    gdf_overture["area_overture"] = gdf_overture.geometry.area
    gdf_philly["area_philly"] = gdf_philly.geometry.area
    gdf_philly["philly_idx"] = gdf_philly.index

    intersections = gpd.overlay(
        gdf_philly[["philly_idx", "area_philly", "geometry"]],
        gdf_overture[["id", "area_overture", "geometry"]],
        how="intersection",
        keep_geom_type=True,
        make_valid=True,
    )

    if len(intersections) == 0:
        gdf_philly["iou"] = 0.0
        gdf_philly["gers_id"] = ""
        return _finalize(gdf_philly, overture_release)

    intersections["inter_area"] = intersections.geometry.area
    intersections["iou"] = intersections["inter_area"] / (
        intersections["area_philly"]
        + intersections["area_overture"]
        - intersections["inter_area"]
    )

    best = (
        intersections.sort_values(["philly_idx", "iou"], ascending=[True, False])
        .drop_duplicates("philly_idx")
        .loc[:, ["philly_idx", "iou", "id"]]
    )

    gdf_philly = gdf_philly.merge(best, on="philly_idx", how="left")
    gdf_philly["iou"] = gdf_philly["iou"].fillna(0.0)
    gdf_philly["gers_id"] = gdf_philly["id"].fillna("")

    return _finalize(gdf_philly, overture_release)


def _finalize(gdf_philly, overture_release):
    gdf = gdf_philly.copy()
    drop_cols = [c for c in ["philly_idx", "id", "area_philly"] if c in gdf.columns]
    if drop_cols:
        gdf = gdf.drop(columns=drop_cols)

    gdf["release"] = overture_release
    ordered = ["release"] + [c for c in gdf.columns if c != "release"]
    return gdf[ordered].reset_index(drop=True)


def _empty_result():
    import geopandas as gpd

    return gpd.GeoDataFrame(
        columns=["release", "gers_id", "iou", "geometry"],
        geometry="geometry",
        crs="EPSG:4326",
    )
For this demo, to show how to build an agentic workflow in Fused, we focus on nine representative Philadelphia neighborhoods and compare each Overture release against the city's official building-footprint layer. This provides a consistent way to evaluate quality across both neighborhoods and releases.
Nine Philadelphia neighborhood locations for analysis
We build the pipeline as a chain of UDFs, where each step does one job and passes its result downstream.
We'll leverage a few benefits of Fused for this:
- Parallel processing: Fused scales UDF execution horizontally, it runs the same function across many inputs at once (for example, one worker per release and one per neighborhood).
- Efficient caching: If the agent calls the same location again, the results will be cached and thus served faster.
We compute IoU for each Philadelphia building against its best Overture match, run that across 7 releases and 9 neighborhoods in parallel, and collapse the result into a compact summary table that can later be exposed to agents as tools.
Show all_bounds_summary UDF code
ALL_BOUNDS = {
    "Art Museum / Fairmount": "[-75.177,39.9478,-75.165,39.9572]",
    "Center City": "[-75.161676,39.935697,-75.152227,39.942566]",
    "Northern Liberties": "[-75.151,39.9478,-75.139,39.9572]",
    "Rittenhouse Square": "[-75.167,39.9308,-75.155,39.9402]",
    "Old City": "[-75.148,39.9408,-75.136,39.9502]",
    "University City (Penn)": "[-75.196,39.9528,-75.184,39.9622]",
    "Fishtown": "[-75.137,39.9678,-75.125,39.9772]",
    "Kensington": "[-75.136,39.9772,-75.124,39.9866]",
    "South Philly (East Passyunk)": "[-75.165,39.9208,-75.153,39.9302]",
}

RELEASES = [
    "2026-02-18-0",
    "2026-01-21-0",
    "2025-05-21-0",
    "2025-04-23-0",
    "2025-03-19-1",
    "2025-01-22-0",
    "2024-12-18-0",
]


@fused.udf
def udf():
    import pandas as pd

    single_udf = fused.load("compute_iou")

    @fused.cache
    def run_all_bounds_summary(labels_key: str, releases_key: str):
        labels = list(ALL_BOUNDS.keys())
        bounds_list = list(ALL_BOUNDS.values())

        arg_list = []
        combo_index = []
        for nb_idx, (label, bounds) in enumerate(zip(labels, bounds_list)):
            for release in RELEASES:
                arg_list.append({"map_bounds": bounds, "overture_releases": release})
                combo_index.append((nb_idx, release))

        pool = single_udf.map(arg_list, max_workers=20)
        pool.wait()
        results = pool.results()

        summary_rows = []
        for (nb_idx, release), result in zip(combo_index, results):
            label = labels[nb_idx]
            if result is None or not isinstance(result, pd.DataFrame) or len(result) == 0:
                continue

            matched = result["iou"] > 0
            matched_df = result.loc[matched]

            release_query = (
                result["release_query"].iloc[0]
                if "release_query" in result.columns and len(result) > 0
                else release
            )

            summary_rows.append({
                "neighborhood": label,
                "release": release,
                "release_query": release_query,
                "philly_buildings": int(len(result)),
                "matched_buildings": int(matched.sum()),
                "match_rate": float(matched.mean()),
                "mean_iou_matched": float(matched_df["iou"].mean()) if len(matched_df) else 0.0,
                "median_iou_matched": float(matched_df["iou"].median()) if len(matched_df) else 0.0,
            })

        columns = [
            "neighborhood", "release", "release_query",
            "philly_buildings", "matched_buildings", "match_rate",
            "mean_iou_matched", "median_iou_matched",
        ]

        if not summary_rows:
            return pd.DataFrame(columns=columns)

        return pd.DataFrame(summary_rows, columns=columns)

    labels_key = ",".join(ALL_BOUNDS.keys())
    releases_key = ",".join(RELEASES)

    return run_all_bounds_summary(labels_key=labels_key, releases_key=releases_key)
UDFs as Composable Building Blocks for Agents
Since each UDF is a standalone Python function with a stable HTTPS endpoint, it can be exposed as an LLM tool. But, the goal is to make UDFs agent-callable without overwhelming the context window. Fused can process large datasets (multi-GB geometry, millions of rows) inside UDFs, but it rarely makes sense to pass those raw intermediates back to an agent.
Instead, we scope tools: create downstream "tool UDFs" that call upstream pipeline UDFs, but return only the small, bounded result needed for a specific question or visualization. Internal pipeline UDFs handle the heavy lifting so the raw geometry never has to be passed to an agent directly.
Why "small outputs" matter:
- LLMs work best when tool responses are compact and structured.
- Large payloads quickly consume LLM context and slow down tool calling.
- Practical rule of thumb: keep tool outputs to a few MB at most (and ideally far smaller), returning summaries, aggregates, IDs, and links instead of raw features.
Size and shape guidelines for agent-facing UDFs:
- Return tables with tens to hundreds of rows, not millions.
- Prefer aggregations (by neighborhood, release, metric) over raw geometries.
- If geometry is required, return small samples or pre-rendered artifacts (tiles, images, widgets) rather than full feature collections.
- Make responses deterministic and bounded: clear limits, pagination, and explicit max rows / max bytes.
Pipeline UDFs remain internal; agent-facing tool UDFs act as the safe, small, stable interface.
Exposing Results to Agents
The Fused Canvas itself becomes a shared MCP server — click Share → Open API in Workbench to generate an MCP-compatible endpoint. AI tools like Claude, Cursor, or any MCP-capable client can connect to this endpoint and discover your UDFs as callable tools.
See Expose your canvas to agents for more on organizing and securing agent-facing canvases.
This is the agentic development workflow: data engineers write UDFs that shrink the world, and every team — from analysts to product managers — asks questions through whatever interface they prefer. The answers are always interactive, always current, and always shareable.
Connecting MCP Server to AI
Once the Canvas is shared, connect any AI agent to it. Here's how to set up Claude Code:
- Teach Claude Code about Fused. Paste the Fused skills into Claude Code so it understands how to interact with Fused endpoints. Tell it: "always use these skills when working with Fused."
- Give it the OpenAPI spec. In the Canvas, click Share → OpenAPI and copy the
.api.jsonURL (it looks likehttps://udf.ai/fc_<your_token>.api.json). Paste it into Claude Code so the agent knows which tools are available and what parameters they accept. - Ask questions. The agent can now query the Overture release data directly:
- "Which release has the lowest IoU across all neighborhoods?"
- "Which neighborhood has seen the biggest increase in match rate?"
- "Show me the trend of IoU over time for Center City."

For more details on connecting agents, see Connect an AI agent.