Fused Map
Fused Map is a map widget in Fused. It draws geospatial data from a UDF, a SQL query, or a tile URL: points, polygons, H3 hexagons, and raster tiles, with many layers on one map.
Its type is fused-map. It works like any other widget: configure it in JSON, connect UDFs with edges, and share it as a URL. To see working examples, open the Fused Map example canvas. For the props, see the Fused Map API reference.
Add a Fused Map widget
- In the Workbench canvas, select the Widget icon in the toolbar.
- In the Widget configuration panel, select Preset, then Maps and geo, then Fused map.
- Connect the UDF node to the widget node with an edge.
- In the JSON, set
udfto the name of the UDF in double braces, for example{{my_udf}}.
For a faster way, drag an edge from the output handle of a UDF node to an empty spot on the canvas, then select Fused map in the menu. Workbench creates a Fused Map widget that is already connected to the UDF and draws its result.
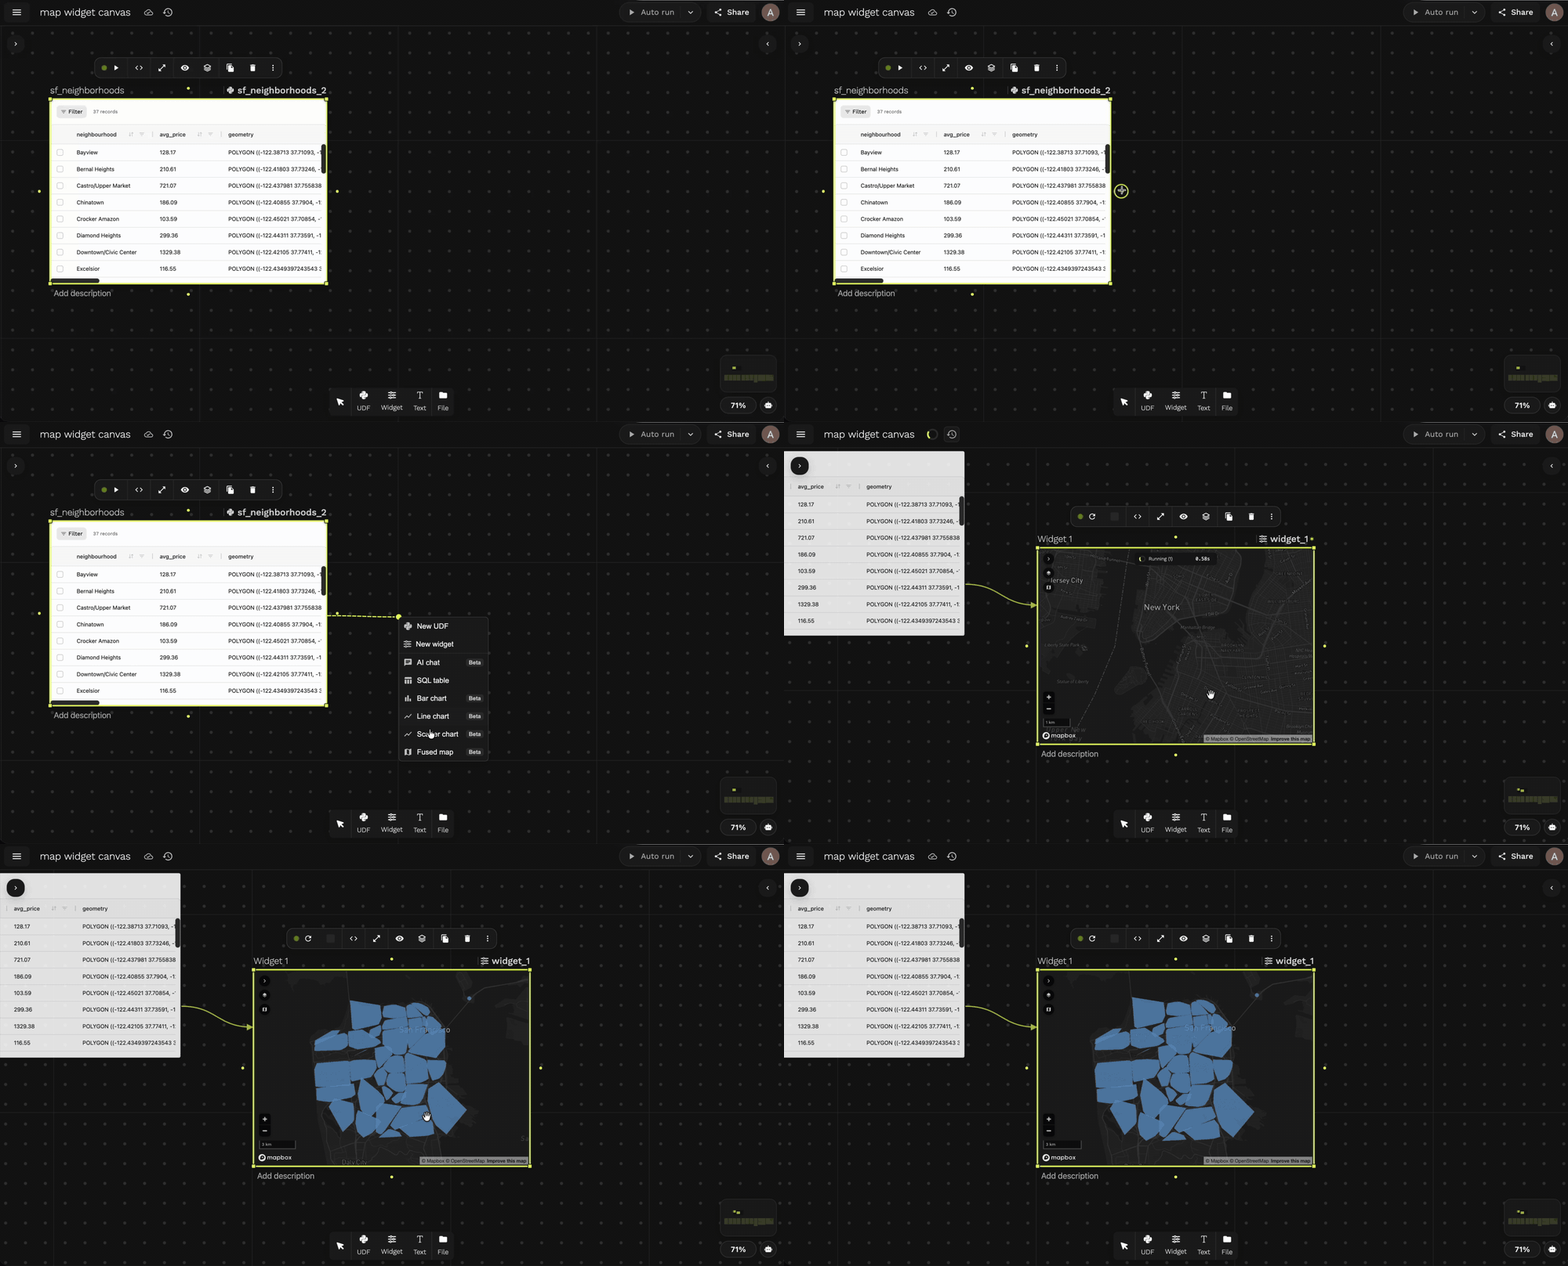
The UDF must be on the same canvas. The name in {{ }} must match the UDF name exactly, with the same case.
Layer types and data sources
Set the type of each layer to geojson, h3, raster, mvt, heatmap, scatterplot, arc, or deck-geojson. Each layer reads its data in one of four ways:
| Property | What the map does |
|---|---|
udf | Runs the UDF one time and draws the whole result. |
udf and tile: true | Runs the UDF for each map tile. The UDF gets the tile bounds. |
sql | Runs a DuckDB query on a UDF result, then draws the rows. |
tileUrl | Reads tiles from a URL with {z}, {x}, and {y} placeholders. |
The UDF returns a GeoDataFrame for geojson layers, a DataFrame with an H3 column for h3 layers, and an image array for raster layers. A DataFrame with latitude and longitude columns also works for geojson layers: set latColumn and lngColumn. Every other column is a property of the feature. The tooltip, the filters, and the data-driven colors use these properties.
bounds to load data per tileWith tile: true, the map passes each tile's area as [west, south, east, north] in EPSG:4326. Return only the rows inside bounds. The type doesn't matter, only the name.
@fused.udf
def udf(bounds):
    ...
tile | First argument is bounds | Result |
|---|---|---|
true | Yes | Each tile gets its own data. |
true | No | Every tile gets the same result. |
false | Either | The UDF runs once and bounds is ignored. |
To make a layer dynamic, pass a widget input's value to the UDF from the layer's udf in the Fused Map widget JSON. Write {{my_udf?<udf_argument>=$<param>}}, where <param> is the input's param name. For example, with an input whose param is band, "udf": "{{my_udf?band_index=$band}}" passes its value to the UDF's band_index argument and re-runs the UDF when it changes.
Example
This map shows San Francisco Airbnb listings as points on top of a Bay Area seismic hazard raster.
Show the widget JSON
{
  "type": "fused-map",
  "props": {
    "basemap": "mapbox://styles/mapbox/dark-v11",
    "centerLng": -122.3,
    "centerLat": 37.7,
    "zoom": 9.5,
    "autoFit": false,
    "layers": [
      {
        "id": "seismic",
        "name": "Bay Area seismic hazard (raster)",
        "type": "raster",
        "udf": "{{bay_area_seismic_raster}}",
        "tile": true,
        "minZoom": 0,
        "maxZoom": 19,
        "style": { "opacity": 0.6 }
      },
      {
        "id": "sf_listings",
        "name": "SF Airbnb listings",
        "type": "geojson",
        "udf": "{{sf_listings}}",
        "latColumn": "latitude",
        "lngColumn": "longitude",
        "tooltip": ["name", "price_in_dollar", "room_type"],
        "legend": true,
        "style": {
          "fillColor": { "type": "categorical", "attr": "room_type", "palette": "Bold" },
          "pointRadius": 4,
          "opacity": 0.85
        }
      }
    ]
  }
}
Show the bay_area_seismic_raster UDF
The raster layer uses tile: true, so the first argument is bounds.
@fused.udf
def udf(
    bounds: fused.types.Bounds = [-122.6, 37.2, -121.7, 38.0],
    path: str = "s3://fused-asset/demos/seismic_data/v2023_1_pga_475_rock_3min.tif",
):
    common = fused.load("https://github.com/fusedio/udfs/tree/fbf5682/public/common/")
    tile = common.get_tiles(bounds, zoom=common.estimate_zoom(bounds))
    arr = common.read_tiff(tile, input_tiff_path=path)
    return common.arr_to_plasma(arr.filled(0), min_max=(0, 1.5))
Show the sf_listings UDF
The points layer runs once and has no bounds argument.
@fused.udf
def udf(path: str = "s3://fused-sample/demo_data/airbnb_listings_sf.parquet"):
    import geopandas as gpd
    import pandas as pd

    df = pd.read_parquet(path)
    df = df.dropna(subset=["latitude", "longitude", "price_in_dollar"])
    gdf = gpd.GeoDataFrame(
        df[["name", "neighbourhood_cleansed", "room_type", "price_in_dollar"]],
        geometry=gpd.points_from_xy(df["longitude"], df["latitude"]),
        crs="EPSG:4326",
    )
    return gdf
The Fused Map example canvas has working UDF and widget examples. For the style, tooltip, legend, and filter props, see the Fused Map API reference.
The sidebar
The sidebar lets the viewer change the style, the filters, and the SQL of each layer in the browser. Each layer has a Style tab and a Filters tab. In Style, set the layer type, the fill mode (for example By value with a property, a palette, steps, and a domain), the stroke, and the opacity.
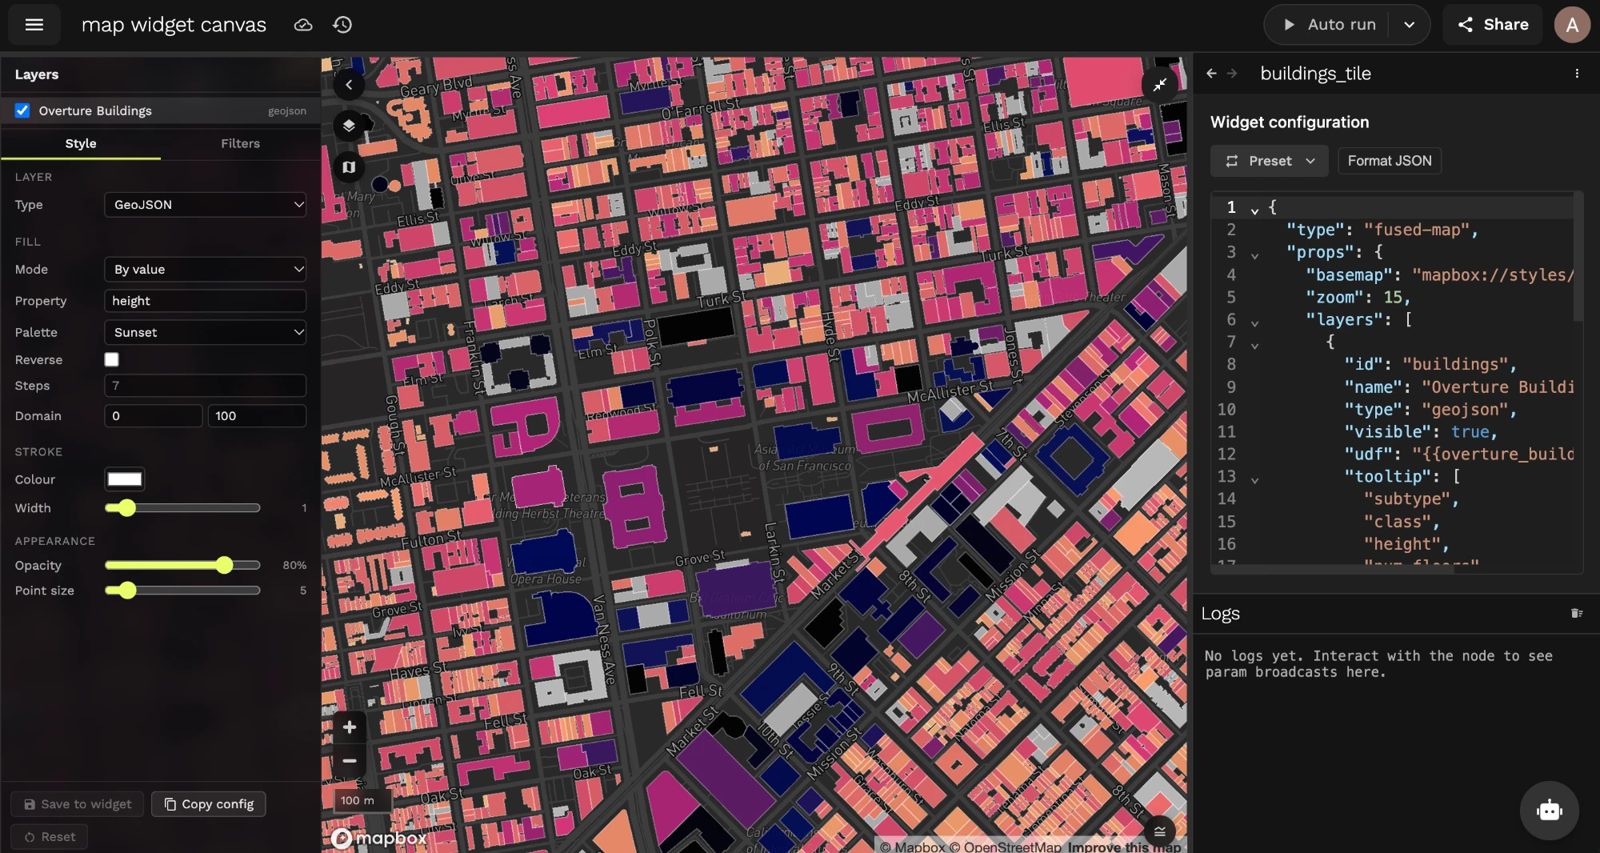
These changes are temporary. To keep them, select Save to widget to write them into the widget configuration, or select Copy config and paste the result into the JSON. Select Reset to undo the changes.