Layer Styling: Visualization
Map Builder is deprecated and hidden by default. You can re-enable it under Workbench Preferences → Deprecated features → Enable map view. For new work, use the Fused Map widget instead — see the Widget API for all available widgets.
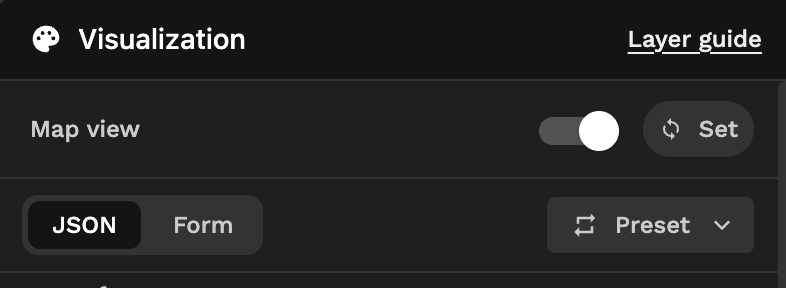
The Map builder displays data from your UDF on the map. You can customize the visual representation using the visualization icon located on the map.
If you're using map_utils to build standalone maps in Canvas, see Standalone Maps instead. This page covers styling for Map Builder layers.
Overview
Fused's visualization system is built on DeckGL, a powerful JavaScript framework for large-scale geospatial data visualizations. The system uses a three-layer architecture that automatically selects the appropriate rendering method based on your UDF output.
Layer Architecture
Every Visualization uses this JSON structure:
{
  "tileLayer": {
    "@@type": "TileLayer",        // For viewport-optimized rendering
    "minZoom": 0,
    "maxZoom": 19,
    "tileSize": 256,
    "pickable": true
  },
  "rasterLayer": {
    "@@type": "BitmapLayer",      // For raster data (images, arrays)
    "pickable": true
  },
  "vectorLayer": {
    "@@type": "GeoJsonLayer",     // For vector data (GeoDataFrames)
    "stroked": true,
    "filled": true,
    "pickable": true
  }
}
How Fused Selects Visualization Layers
Fused automatically determines which layer to use based on your UDF output:
| UDF Output | Layer Used | Layer Type | Use Case |
|---|---|---|---|
GeoDataFrame | vectorLayer | GeoJsonLayer | Polygons, lines, points with geometry |
DataFrame with H3 column | vectorLayer | H3HexagonLayer | Hexagonal grid data |
| PNG/array/image | rasterLayer | BitmapLayer | Satellite imagery, heat maps |
Key Points:
- You define all three layers in your JSON, but Fused uses only the appropriate one based on your data type
- Unused layers are ignored automatically
- Visualizations use JSON configuration, not Python code
{
  "tileLayer": { "@@type": "TileLayer", ... },      // Always defined
  "rasterLayer": { "@@type": "BitmapLayer", ... },  // Used for images/arrays
  "vectorLayer": { "@@type": "GeoJsonLayer", ... }  // Used for GeoDataFrames
}
Default Map View
You can set a default map view that automatically centers on your data:
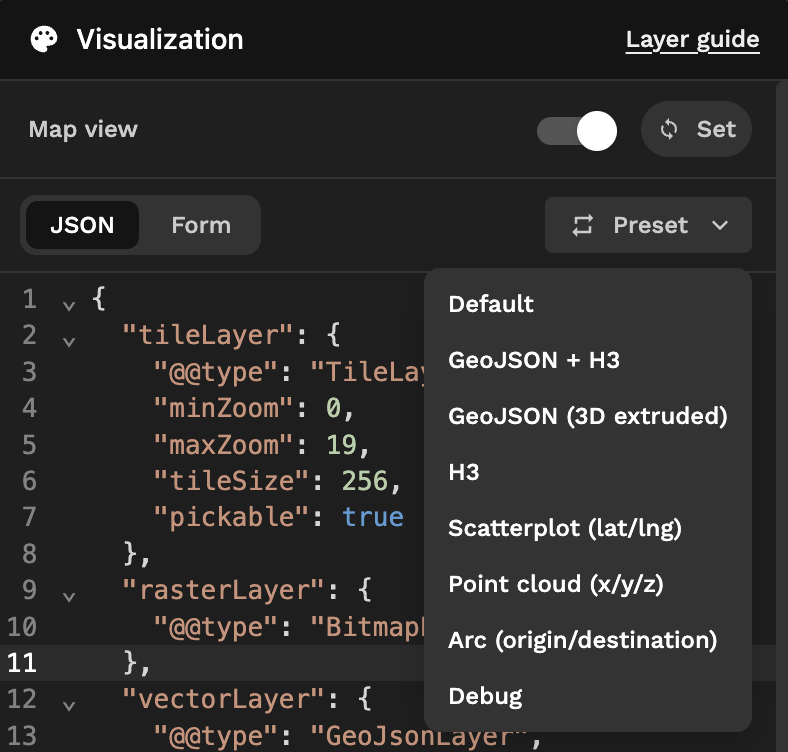
Presets
Use the "Preset" button to quickly generate styling configurations. You can always undo changes with Ctrl + Z.
Layer Types
Vector: Custom Map (Mapbox GL)
Use when your UDF produces vector tiles (MVT) and you want full control using Mapbox GL styling and interactions.
Expand to see Visualise JSON
{
  "tileLayer": {
    "@@type": "TileLayer",
    "minZoom": 0,
    "maxZoom": 19,
    "tileSize": 256,
    "pickable": true
  },
  "rasterLayer": {
    "@@type": "BitmapLayer",
    "pickable": true
  },
  "vectorLayer": {
    "@@type": "GeoJsonLayer",
    "stroked": true,
    "filled": true,
    "pickable": true,
    "lineWidthMinPixels": 1,
    "getFillColor": [20, 200, 200, 100],
    "getLineColor": [50, 50, 50, 255]
  }
}
Expand to see standalone UDF code
@fused.udf(cache_max_age=0)
def udf(
    token: str = "UDF_Overture_Maps_Example",
    host: str = "https://www.fused.io",
    mapbox_token: str = "pk.eyJ1IjoiaXNhYWNmdXNlZGxhYnMiLCJhIjoiY2xicGdwdHljMHQ1bzN4cWhtNThvbzdqcSJ9.73fb6zHMeO_c8eAXpZVNrA",
    style_url: str = "mapbox://styles/mapbox/dark-v10",
    center_lng: float = -122.4194,
    center_lat: float = 37.7749,
    zoom: float = 16,
    pitch: float = 30,
    bearing: float = 20,
    minzoom: int = 6,
    maxzoom: int = 14,
    layer_id: str = "fused-vector-layer",
    source_layer: str = "udf"
):
    """
    Minimal Mapbox map (no input UI) that loads Fused XYZ vector tiles (MVT) from `token`.
    Tiles URL: {host}/server/v1/realtime-shared/{token}/run/tiles/{z}/{x}/{y}?dtype_out_vector=mvt
    """
    from jinja2 import Template
    html = Template(r"""
<!DOCTYPE html>
<html>
<head>
  <meta charset="utf-8"/>
  <title>Simple XYZ (MVT) Loader</title>
  <meta name="viewport" content="initial-scale=1,maximum-scale=1,user-scalable=no"/>
  <link href="https://api.mapbox.com/mapbox-gl-js/v3.2.0/mapbox-gl.css" rel="stylesheet"/>
  <script src="https://api.mapbox.com/mapbox-gl-js/v3.2.0/mapbox-gl.js"></script>
  <style>
    html, body { margin:0; height:100%; }
    #map { position:absolute; inset:0; }
  </style>
</head>
<body>
  <div id="map"></div>

  <script>
    const MAPBOX_TOKEN = {{ mapbox_token | tojson }};
    const STYLE_URL    = {{ style_url | tojson }};
    const HOST         = {{ host | tojson }};
    const TOKEN        = {{ token | tojson }};
    const CENTER       = [{{ center_lng }}, {{ center_lat }}];
    const ZOOM         = {{ zoom }};
    const PITCH        = {{ pitch }};
    const BEARING      = {{ bearing }};
    const MINZOOM      = {{ minzoom }};
    const MAXZOOM      = {{ maxzoom }};
    const LAYER_ID     = {{ layer_id | tojson }};
    const SOURCE_LAYER = {{ source_layer | tojson }};

    function tilesFromToken(tok) {
      return `${HOST}/server/v1/realtime-shared/${tok}/run/tiles/{z}/{x}/{y}?dtype_out_vector=mvt`;
    }

    mapboxgl.accessToken = MAPBOX_TOKEN;
    const map = new mapboxgl.Map({
      container: 'map',
      style: STYLE_URL,
      center: CENTER,
      zoom: ZOOM,
      pitch: PITCH,
      bearing: BEARING
    });

    function addVectorTiles(tok) {
      const tilesUrl = tilesFromToken(tok);
      if (map.getLayer(LAYER_ID)) map.removeLayer(LAYER_ID);
      if (map.getSource('xyz'))   map.removeSource('xyz');

      map.addSource('xyz', {
        type: 'vector',
        tiles: [tilesUrl],
        minzoom: MINZOOM,
        maxzoom: MAXZOOM
      });

      map.addLayer({
        id: LAYER_ID,
        type: 'line',
        source: 'xyz',
        'source-layer': SOURCE_LAYER,
        layout: { 'line-join': 'round', 'line-cap': 'round' },
        paint: { 'line-color': '#00FF0A', 'line-width': 2, 'line-opacity': 0.8 }
      });
    }

    map.on('load', () => {
      addVectorTiles(TOKEN);
    });
  </script>
</body>
</html>
""").render(
        token=token,
        host=host,
        mapbox_token=mapbox_token,
        style_url=style_url,
        center_lng=center_lng,
        center_lat=center_lat,
        zoom=zoom,
        pitch=pitch,
        bearing=bearing,
        minzoom=minzoom,
        maxzoom=maxzoom,
        layer_id=layer_id,
        source_layer=source_layer,
    )

    common = fused.load("https://github.com/fusedio/udfs/tree/351515e/public/common/")
    return common.html_to_obj(html)
Key Mapbox GL properties:
source:{ type: 'vector', tiles: [url], minzoom, maxzoom }source-layer: Name of the tile layer (alwaysudffor Fused vector tiles)layer.type:'line'(or'fill'for polygons,'circle'for points)paint: For lines useline-color,line-width,line-opacity(for polygons usefill-colorand an outlinelinelayer)
Example UDF
Vector: H3HexagonLayer
Use a custom map UDF that renders deck.gl H3HexagonLayer over Mapbox GL. The UDF consumes JSON with H3 indices and values and returns an HTML map.
Live example rendered from a UDF (HTML output):
Expected data schema:
- hex: H3 index string (e.g.,
8a2a1072b59ffff) - count: numeric value used for color/elevation
Expand to see Visualise JSON
{
  "tileLayer": {
    "@@type": "TileLayer",
    "minZoom": 0,
    "maxZoom": 19,
    "tileSize": 256,
    "pickable": true
  },
  "rasterLayer": {
    "@@type": "BitmapLayer",
    "pickable": true
  },
  "vectorLayer": {
    "@@type": "H3HexagonLayer",
    "stroked": true,
    "filled": true,
    "pickable": true,
    "extruded": false,
    "opacity": 1,
    "coverage": 0.9,
    "lineWidthMinPixels": 5,
    "getHexagon": "@@=properties.hex",
    "getFillColor": [255, 165, 0, 180],
    "getLineColor": [200, 200, 200, 255]
  }
}
Expand to see standalone UDF code
@fused.udf(cache_max_age=0)
def udf(
    # H3 data (each row: {hex: '8f...', count: number})
    data_url: str = "https://www.fused.io/server/v1/realtime-shared/UDF_DuckDB_H3_SF/run/file?format=json",

    # Mapbox + camera
    mapbox_token: str = "pk.eyJ1IjoiaXNhYWNmdXNlZGxhYnMiLCJhIjoiY2xicGdwdHljMHQ1bzN4cWhtNThvbzdqcSJ9.73fb6zHMeO_c8eAXpZVNrA",
    style_url: str = "mapbox://styles/mapbox/dark-v10",
    center_lng: float = -122.417759,
    center_lat: float = 37.776452,
    zoom: float = 11.0,
    pitch: float = 50.0,
    bearing: float = -10.0,

    # Layer tuning
    elevation_scale: float = 20.0,     # count * elevation_scale
    max_count_for_color: float = 500.0, # for [255, (1 - count/max)*255, 0]
    wireframe: bool = False,
):

    from jinja2 import Template

    """
    Deck.gl 3D H3HexagonLayer over Mapbox, using your JSON (hex,count) data.
    - Elevation: count * elevation_scale
    - Color: [255, (1 - count/max_count_for_color)*255, 0]
    - Popup shows hex & count
    """
    html = Template(r"""
<!DOCTYPE html>
<html>
<head>
  <meta charset="utf-8"/>
  <title>Deck.gl 3D H3 (Fixed)</title>
  <meta name="viewport" content="initial-scale=1,maximum-scale=1,user-scalable=no"/>
  <link href="https://api.mapbox.com/mapbox-gl-js/v3.2.0/mapbox-gl.css" rel="stylesheet"/>
  <script src="https://api.mapbox.com/mapbox-gl-js/v3.2.0/mapbox-gl.js"></script>

  <!-- Load h3-js BEFORE deck.gl -->
  <script src="https://unpkg.com/h3-js@latest/dist/h3-js.umd.js"></script>
  <!-- Then load deck.gl -->
  <script src="https://unpkg.com/deck.gl@9.0.0/dist.min.js"></script>

  <style>
    html, body { margin:0; height:100%; }
    #map { position:absolute; inset:0; }
    .deck-tooltip {
      font-family: -apple-system, BlinkMacSystemFont, "Segoe UI", Roboto, Arial, sans-serif;
      font-size: 12px;
      padding: 6px 8px;
      background: rgba(0,0,0,0.7);
      color: #fff;
      border-radius: 6px;
      max-width: 260px;
      pointer-events: none;
    }
  </style>
</head>
<body>
  <div id="map"></div>
  <script>
    // Verify h3-js is loaded properly
    if (typeof h3 === 'undefined') {
      console.error('h3-js library not loaded!');
      throw new Error('h3-js library must be loaded before deck.gl');
    }

    const MAPBOX_TOKEN = {{ mapbox_token | tojson }};
    const STYLE_URL    = {{ style_url    | tojson }};
    const DATA_URL     = {{ data_url     | tojson }};

    const INITIAL_VIEW_STATE = {
      longitude: {{ center_lng }},
      latitude:  {{ center_lat }},
      zoom:      {{ zoom }},
      pitch:     {{ pitch }},
      bearing:   {{ bearing }}
    };

    const ELEVATION_SCALE     = {{ elevation_scale }};
    const MAX_COUNT_FOR_COLOR = {{ max_count_for_color }};
    const WIREFRAME           = {{ wireframe | tojson }};

    mapboxgl.accessToken = MAPBOX_TOKEN;
    if (mapboxgl.setTelemetryEnabled) { try { mapboxgl.setTelemetryEnabled(false); } catch(e){} }

    const map = new mapboxgl.Map({
      container: 'map',
      style: STYLE_URL,
      center: [INITIAL_VIEW_STATE.longitude, INITIAL_VIEW_STATE.latitude],
      zoom: INITIAL_VIEW_STATE.zoom,
      pitch: INITIAL_VIEW_STATE.pitch,
      bearing: INITIAL_VIEW_STATE.bearing
    });

    const overlay = new deck.MapboxOverlay({
      interleaved: true,
      layers: []
    });

    map.on('load', () => {
      map.addControl(overlay);

      const ambient = new deck.AmbientLight({intensity: 1.0});
      const dir     = new deck.DirectionalLight({intensity: 0.9, direction: [-1, -2, -1]});
      const effects = [ new deck.LightingEffect({ambientLight: ambient, dirLight: dir}) ];

      const h3Layer = new deck.H3HexagonLayer({
        id: 'h3-3d',
        data: DATA_URL,
        pickable: true,
        extruded: true,
        wireframe: WIREFRAME,
        material: { ambient: 0.35, diffuse: 0.6, shininess: 32, specularColor: [255,255,255] },

        getHexagon: d => d.hex,
        getElevation: d => (d && Number.isFinite(d.count) ? d.count : 0) * ELEVATION_SCALE,
        getFillColor: d => {
          const count = (d && Number.isFinite(d.count)) ? d.count : 0;
          const g = Math.max(0, Math.min(255, (1 - (count / MAX_COUNT_FOR_COLOR)) * 255));
          return [255, g, 0];
        },
        filled: true,
        stroked: true,
        getLineColor: [255, 255, 255],
        getLineWidth: 2,
        lineWidthUnits: 'pixels',

        onClick: info => {
          if (!info || !info.coordinate || !info.object) return;
          const props = { hex: info.object.hex, count: info.object.count };
          new mapboxgl.Popup({closeButton:true})
            .setLngLat(info.coordinate)
            .setHTML('<pre style="margin:0;white-space:pre-wrap;">' +
                      JSON.stringify(props, null, 2) + '</pre>')
            .addTo(map);
        }
      });

      overlay.setProps({ layers: [h3Layer], effects });
    });
  </script>
</body>
</html>
""").render(
    data_url=data_url,
    mapbox_token=mapbox_token,
    style_url=style_url,
    center_lng=center_lng,
    center_lat=center_lat,
    zoom=zoom,
    pitch=pitch,
    bearing=bearing,
    elevation_scale=elevation_scale,
    max_count_for_color=max_count_for_color,
    wireframe=wireframe,
)

    common = fused.load("https://github.com/fusedio/udfs/tree/351515e/public/common/")
    return common.html_to_obj(html)
Required accessor:
getHexagon:d => d.hex(returns H3 index string)
Key layer properties:
getElevation:d => (d.count || 0) * elevation_scalegetFillColor: color ramp derived fromcountextruded:truefor 3D columns;wireframetoggles outlinespickable: enable interactivity; showPopupon clickmaterial: basic lighting parameters
Note: Load h3-js before deck.gl. Ensure H3 IDs are strings in JS (convert numeric/BigInt to hex if needed).
Required Property:
getHexagon: Specify the DataFrame column containing H3 indices (e.g.,"@@=properties.hex")
Example UDF
Vector: H3HexagonLayer with Tiles
Use a custom map UDF that renders deck.gl H3HexagonLayer with tile-based data loading. The UDF consumes JSON tiles with H3 indices and values and returns an HTML map with configurable styling.
Live example rendered from a UDF (HTML output):
Expected data schema:
- hex: H3 index string (e.g.,
8a2a1072b59ffff) - metric: numeric value used for color/elevation
Key features:
- Tile-based loading: Efficiently loads H3 data as map tiles
- Configurable styling: JSON-based configuration for colors, elevation, and styling
- Interactive: Hover to see hex details and metric values
- Performance optimized: Only loads visible tiles
Expand to see Visualize JSON
{
  "tileLayer": {
    "@@type": "TileLayer",
    "minZoom": 0,
    "maxZoom": 19,
    "tileSize": 256,
    "pickable": true
  },
  "hexLayer": {
    "@@type": "H3HexagonLayer",
    "stroked": false,
    "filled": true,
    "pickable": true,
    "extruded": false,
    "opacity": 1,
    "coverage": 0.9,
    "lineWidthMinPixels": 10,
    "getHexagon": "@@=properties.hex",
    "getFillColor": {
      "@@function": "colorContinuous",
      "attr": "metric",
      "domain": [100000, 0],
      "colors": "TealGrn",
      "nullColor": [184, 184, 184]
    },
    "getLineColor": [200, 200, 200],
    "getElevation": {
      "@@function": "hasProp",
      "property": "metric",
      "present": "@@=properties.metric",
      "absent": 1
    },
    "elevationScale": 2
  }
}
Expand to see standalone UDF code
DEFAULT_CONFIG = r"""{
  "tileLayer": {
    "@@type": "TileLayer",
    "minZoom": 0,
    "maxZoom": 19,
    "tileSize": 256,
    "pickable": true
  },
  "hexLayer": {
    "@@type": "H3HexagonLayer",
    "stroked": false,
    "filled": true,
    "pickable": true,
    "extruded": false,
    "opacity": 1,
    "coverage": 0.9,
    "lineWidthMinPixels": 10,
    "getHexagon": "@@=properties.hex",
    "getFillColor": {
      "@@function": "colorContinuous",
      "attr": "metric",
      "domain": [100000, 0],
      "colors": "TealGrn",
      "nullColor": [184, 184, 184]
    },
    "getLineColor": [200, 200, 200],
    "getElevation": {
      "@@function": "hasProp",
      "property": "metric",
      "present": "@@=properties.metric",
      "absent": 1
    },
    "elevationScale": 2
  }
}"""

@fused.udf(cache_max_age=0)
def udf(
    tile_url_template: str = "https://www.fused.io/server/v1/realtime-shared/UDF_Ookla_Download_Speeds/run/tiles/{z}/{x}/{y}?dtype_out_vector=json",
    config_json: str = DEFAULT_CONFIG,
    mapbox_token: str = "pk.eyJ1IjoiaXNhYWNmdXNlZGxhYnMiLCJhIjoiY2xicGdwdHljMHQ1bzN4cWhtNThvbzdqcSJ9.73fb6zHMeO_c8eAXpZVNrA",
    center_lng: float = -98.5,
    center_lat: float = 39.5,
    zoom: float = 3
):
    from jinja2 import Template

    html = Template(r"""
<!DOCTYPE html>
<html>
<head>
  <meta charset="utf-8" />
  <title>H3 XYZ Workbench-style Viewer</title>
  <meta name="viewport" content="width=device-width, initial-scale=1" />

  <!-- Mapbox GL -->
  <link href="https://api.mapbox.com/mapbox-gl-js/v2.15.0/mapbox-gl.css" rel="stylesheet" />
  <script src="https://api.mapbox.com/mapbox-gl-js/v2.15.0/mapbox-gl.js"></script>

  <!-- Load h3-js FIRST, then deck.gl + geo-layers (+ carto for color ramps) -->
  <script src="https://unpkg.com/h3-js@4.1.0/dist/h3-js.umd.js"></script>
  <script src="https://unpkg.com/deck.gl@9.1.3/dist.min.js"></script>
  <script src="https://unpkg.com/@deck.gl/geo-layers@9.1.3/dist.min.js"></script>
  <script src="https://unpkg.com/@deck.gl/carto@9.1.3/dist.min.js"></script>

  <style>
    html, body, #map { margin: 0; height: 100%; width: 100%; }
    #hud { position: absolute; top: 8px; left: 8px; z-index: 5; color: #fff; background: rgba(0,0,0,.65);
           padding: 8px 12px; border-radius: 6px; font: 12px/1.5 system-ui, -apple-system, Segoe UI, Roboto, Helvetica, Arial; }
    #hud b { color: #4fc3f7; }
  </style>
</head>
<body>
  <div id="map"></div>
  <div id="hud"><b>Tiles:</b> <span id="note">ready</span></div>

  <script>
    const MAPBOX_TOKEN = {{ mapbox_token | tojson }};
    const STYLE_URL    = "mapbox://styles/mapbox/dark-v10";
    const TPL          = {{ tile_url_template | tojson }};
    const CONFIG       = JSON.parse({{ config_json | tojson }});

    const { TileLayer, PolygonLayer, MapboxOverlay } = deck;
    const H3HexagonLayer = deck.H3HexagonLayer || (deck.GeoLayers && deck.GeoLayers.H3HexagonLayer);
    const { colorContinuous } = deck.carto;

    const $note = () => document.getElementById('note');
    function setNote(t){ const n=$note(); if(n) n.textContent=t; }

    // ----- helpers for @@function / @@= support -----
    function evalExpression(expr, object) {
      if (typeof expr === 'string' && expr.startsWith('@@=')) {
        const code = expr.slice(3);
        try {
          const fn = new Function('object', `
            const properties = object?.properties || object || {};
            return (${code});
          `);
          return fn(object);
        } catch (e) { console.error('@@= eval error:', expr, e); return null; }
      }
      return expr;
    }

    function hasProp({ property, present, absent }) {
      return (object) => {
        const props = object?.properties || object || {};
        if (property in props && props[property] !== null && props[property] !== undefined) {
          return typeof present === 'function' ? present(object)
               : (typeof present === 'string' && present.startsWith('@@=')) ? evalExpression(present, object)
               : present;
        }
        return typeof absent === 'function' ? absent(object) : absent;
      };
    }

    function processColorContinuous(cfg) {
      // accept 2-element domain or full array
      return {
        attr: cfg.attr,
        domain: cfg.domain,
        colors: cfg.colors || 'TealGrn',
        nullColor: cfg.nullColor || [184,184,184]
      };
    }

    function parseHexLayerConfig(config) {
      const out = {};
      for (const [k, v] of Object.entries(config || {})) {
        if (k === '@@type') continue;
        if (v && typeof v === 'object' && !Array.isArray(v)) {
          if (v['@@function'] === 'colorContinuous') {
            out[k] = colorContinuous(processColorContinuous(v));
          } else if (v['@@function'] === 'hasProp') {
            out[k] = hasProp(v);
          } else {
            out[k] = v;
          }
        } else if (typeof v === 'string' && v.startsWith('@@=')) {
          out[k] = (obj) => evalExpression(v, obj);
        } else {
          out[k] = v;
        }
      }
      return out;
    }

    // ----- H3 ID safety (handles string/number/bigint/[hi,lo]) -----
    function toH3String(hex) {
      try {
        if (hex == null) return null;
        if (typeof hex === 'string') {
          const s = hex.startsWith('0x') ? hex.slice(2) : hex;
          // if decimal digits, convert to hex via BigInt
          return (/^\d+$/.test(s) ? BigInt(s).toString(16) : s.toLowerCase());
        }
        if (typeof hex === 'number') return BigInt(Math.trunc(hex)).toString(16);
        if (typeof hex === 'bigint') return hex.toString(16);
        if (Array.isArray(hex) && hex.length === 2) {
          const a = (BigInt(hex[0]) << 32n) | BigInt(hex[1]);
          const b = (BigInt(hex[1]) << 32n) | BigInt(hex[0]);
          const sa = a.toString(16), sb = b.toString(16);
          if (h3.isValidCell?.(sa)) return sa;
          if (h3.isValidCell?.(sb)) return sb;
          return sa;
        }
      } catch(_) {}
      return null;
    }

    // Normalize any tile JSON into data rows, and add both top-level + properties for compatibility
    function normalize(raw){
      const arr = Array.isArray(raw)
        ? raw
        : (Array.isArray(raw?.data) ? raw.data
        : (Array.isArray(raw?.features) ? raw.features : []));
      const rows = arr.map(d => d?.properties ? {...d.properties} : {...d});
      return rows.map(p => {
        const hexRaw = p.hex ?? p.h3 ?? p.index ?? p.id;
        const metric = p.metric ?? p.value ?? p.count ?? p.pct ?? p.area ?? p.total ?? p.val;
        const hex = toH3String(hexRaw);
        if (!hex) return null;
        const props = { ...p, hex, metric };
        return { ...props, properties: { ...props } }; // both locations
      }).filter(Boolean);
    }

    // Mapbox init
    mapboxgl.accessToken = MAPBOX_TOKEN;
    const map = new mapboxgl.Map({ container:'map', style:STYLE_URL, center:[{{ center_lng }}, {{ center_lat }}], zoom: {{ zoom }} });

    // Fetch & parse tile with big-int protection for "hex|h3|index"
    async function getTileData({ index, signal }) {
      const {x,y,z} = index;
      const url = TPL.replace('{z}', z).replace('{x}', x).replace('{y}', y);
      try {
        const res = await fetch(url, { cache:'no-cache', signal });
        if (!res.ok) throw new Error(String(res.status));
        let text = await res.text();
        text = text.replace(/"(hex|h3|index)"\s*:\s*(\d+)/gi, (_m, k, d) => `"${k}":"${d}"`);
        const data = JSON.parse(text);
        const out = normalize(data);
        setNote(`z${z} (${x},${y}) → ${out.length}`);
        return out;
      } catch (e) {
        // silence aborts (happen on pan/zoom); show others
        const s = String(e?.name||e);
        if (!/Abort/i.test(s)) {
          console.error('tile error', e);
          setNote(`error z${z} (${x},${y})`);
        }
        return [];
      }
    }

    // Build layers from CONFIG
    const tileCfg = CONFIG.tileLayer || {};
    const hexCfg  = parseHexLayerConfig(CONFIG.hexLayer || {});

    const overlay = new MapboxOverlay({
      interleaved: false,
      layers: [
        new TileLayer({
          id: 'hex-tiles',
          data: TPL,
          tileSize: tileCfg.tileSize ?? 256,
          minZoom:   tileCfg.minZoom   ?? 0,
          maxZoom:   tileCfg.maxZoom   ?? 19,
          pickable:  tileCfg.pickable  ?? true,
          getTileData,
          renderSubLayers: (props) => {
            const data = props.data || [];
            if (!data.length) return null;

            if (H3HexagonLayer) {
              return new H3HexagonLayer({
                id: `${props.id}-h3`,
                data,
                // defaults
                pickable: true, stroked: false, filled: true, extruded: false,
                coverage: 0.9, lineWidthMinPixels: 1,
                getHexagon: d => d.hex,
                // apply config overrides
                ...hexCfg
              });
            }

            // Fallback: draw boundaries with PolygonLayer if geo-layers not present
            const polys = data.map(d => {
              const ring = h3.cellToBoundary(d.hex, true).map(([lat,lng]) => [lng, lat]);
              return { ...d, polygon: ring };
            });
            return new PolygonLayer({
              id: `${props.id}-poly-fallback`,
              data: polys,
              pickable: true, stroked: true, filled: true, extruded: false,
              getPolygon: d => d.polygon,
              getFillColor: [184,184,184,220],
              getLineColor: [200,200,200,255],
              lineWidthMinPixels: 1
            });
          }
        })
      ]
    });
    map.addControl(overlay);

    // HUD hover
    map.on('mousemove', (e)=>{
      const info = overlay.pickObject({x:e.point.x, y:e.point.y, radius:4});
      if(info?.object){
        map.getCanvas().style.cursor='pointer';
        const p = info.object;
        const val = p.metric;
        setNote(`hex ${p.hex}${val!=null?` • ${Number(val).toFixed(2)}`:''}`);
      } else {
        map.getCanvas().style.cursor='';
      }
    });
  </script>
</body>
</html>
""").render(
        tile_url_template=tile_url_template,
        config_json=config_json,
        mapbox_token=mapbox_token,
        center_lng=center_lng,
        center_lat=center_lat,
        zoom=zoom,
    )

    common = fused.load("https://github.com/fusedio/udfs/tree/abf9c87/public/common/")
    return common.html_to_obj(html)
Example UDF
Raster: BitmapLayer
Use for raster outputs like satellite imagery, elevation models, or PNG files.
Live example rendered from a UDF (HTML output):
Expected UDF output:
| Output Type | Description | Example |
|---|---|---|
| numpy array | 3D array (height, width, channels) | (256, 256, 3) RGB image |
| PIL Image | PNG/JPEG image object | Image.open('satellite.png') |
| bytes | Encoded image data | PNG/JPEG bytes |
Expand to see Visualise JSON
{
  "tileLayer": {
    "@@type": "TileLayer",
    "minZoom": 0,
    "maxZoom": 19,
    "tileSize": 256,
    "pickable": true
  },
  "rasterLayer": {
    "@@type": "BitmapLayer",
    "pickable": true
  }
}
Expand to see standalone UDF code
@fused.udf(cache_max_age=0)
def udf(
  token: str = "UDF_CDLs_Tile_Example",
  host: str = "https://www.fused.io",
  mapbox_token: str = "pk.eyJ1IjoiaXNhYWNmdXNlZGxhYnMiLCJhIjoiY2xicGdwdHljMHQ1bzN4cWhtNThvbzdqcSJ9.73fb6zHMeO_c8eAXpZVNrA",
  style_url: str = "mapbox://styles/mapbox/dark-v10",
  center_lng: float = -121.16450354933122,
  center_lat: float = 38.44272969483187,
  zoom: float = 8.59,
  minzoom: int = 6,
  maxzoom: int = 14,
  layer_id_raster: str = "fused-raster-layer",
  raster_tile_size: int = 256,
  raster_opacity: float = 0.95
):
  from jinja2 import Template

  """
  Mapbox map that loads **raster** XYZ tiles from a Fused UDF token.

  Tiles URL:
    {host}/server/v1/realtime-shared/{token}/run/tiles/{z}/{x}/{y}?dtype_out_raster=png
  """
  html = Template(r"""
<!DOCTYPE html>
<html>
<head>
<meta charset="utf-8"/>
<title>Raster XYZ Loader</title>
<meta name="viewport" content="initial-scale=1,maximum-scale=1,user-scalable=no"/>
<link href="https://api.mapbox.com/mapbox-gl-js/v3.2.0/mapbox-gl.css" rel="stylesheet"/>
<script src="https://api.mapbox.com/mapbox-gl-js/v3.2.0/mapbox-gl.js"></script>
<style>
  html, body { margin:0; height:100%; }
  #map { position:absolute; inset:0; }
</style>
</head>
<body>
<div id="map"></div>

<script>
  const MAPBOX_TOKEN = {{ mapbox_token | tojson }};
  const STYLE_URL    = {{ style_url | tojson }};
  const HOST         = {{ host | tojson }};
  const TOKEN        = {{ token | tojson }};
  const CENTER       = [{{ center_lng }}, {{ center_lat }}];
  const ZOOM         = {{ zoom }};
  const MINZOOM      = {{ minzoom }};
  const MAXZOOM      = {{ maxzoom }};
  const LID_RAS      = {{ layer_id_raster | tojson }};
  const R_TILE_SIZE  = {{ raster_tile_size }};
  const R_OPACITY    = {{ raster_opacity }};

  function buildRaster(host, tok){
    return host.replace(/\/+$/,'') + `/server/v1/realtime-shared/${tok}/run/tiles/{z}/{x}/{y}?dtype_out_raster=png`;
  }

  mapboxgl.accessToken = MAPBOX_TOKEN;
  const map = new mapboxgl.Map({
    container: 'map',
    style: STYLE_URL,
    center: CENTER,
    zoom: ZOOM
  });

  function addRaster(url){
    if (map.getLayer(LID_RAS)) map.removeLayer(LID_RAS);
    if (map.getSource('xyz'))  map.removeSource('xyz');

    map.addSource('xyz', {
      type: 'raster',
      tiles: [url],
      tileSize: R_TILE_SIZE,
      minzoom: MINZOOM,
      maxzoom: MAXZOOM
    });

    map.addLayer({
      id: LID_RAS,
      type: 'raster',
      source: 'xyz',
      paint: {
        'raster-opacity': R_OPACITY,
        'raster-fade-duration': 0
      }
    });
  }

  map.on('load', () => {
    const url = buildRaster(HOST, TOKEN);
    addRaster(url);
  });
</script>
</body>
</html>
""").render(
      token=token,
      host=host,
      mapbox_token=mapbox_token,
      style_url=style_url,
      center_lng=center_lng,
      center_lat=center_lat,
      zoom=zoom,
      minzoom=minzoom,
      maxzoom=maxzoom,
      layer_id_raster=layer_id_raster,
      raster_tile_size=raster_tile_size,
      raster_opacity=raster_opacity,
  )

  common = fused.load("https://github.com/fusedio/udfs/tree/351515e/public/common/")
  return common.html_to_obj(html)
Example UDF
Color Styling Methods (getFillColor)
There are four ways to style colors in Fused. Each method serves different use cases:
1. Hardcoded Colors
Use fixed RGB/RGBA values for uniform styling.
Live example rendered from a UDF (HTML output):
Expected DataFrame structure:
| geometry | any_column |
|---|---|
| POLYGON(...) | any_value |
| POLYGON(...) | any_value |
Note: Column values don't affect styling - all features get the same color.
Expand to see Visualize JSON
{
"tileLayer": {
  "@@type": "TileLayer",
  "minZoom": 0,
  "maxZoom": 19,
  "tileSize": 256,
  "pickable": true
},
"rasterLayer": {
  "@@type": "BitmapLayer",
  "pickable": true
},
"vectorLayer": {
  "@@type": "GeoJsonLayer",
  "stroked": true,
  "filled": true,
  "pickable": true,
  "lineWidthMinPixels": 1,
  "getFillColor": [20, 200, 200, 100],
  "getLineColor": [50, 50, 50, 255]
}
}
Expand to see Standalone UDF code
@fused.udf(cache_max_age=0)
def udf(
  token: str = "UDF_Overture_Maps_Example",
  host: str = "https://www.fused.io",
  mapbox_token: str = "pk.eyJ1IjoiaXNhYWNmdXNlZGxhYnMiLCJhIjoiY2xicGdwdHljMHQ1bzN4cWhtNThvbzdqcSJ9.73fb6zHMeO_c8eAXpZVNrA",
  style_url: str = "mapbox://styles/mapbox/dark-v10",
  center_lng: float = -122.4194,
  center_lat: float = 37.7749,
  zoom: float = 12,
  minzoom: int = 0,
  maxzoom: int = 15,
  layer_id: str = "vector-fill",
  source_layer: str = "udf",
  fill_color: str = "#35AF6D",
  fill_opacity: float = 0.55,
  outline_color: str = "#0b0b0b",
):
  from jinja2 import Template
  html = Template(r"""
<!DOCTYPE html>
<html>
<head>
<meta charset="utf-8"/>
<title>Vector Fill - Hardcoded Color</title>
<meta name="viewport" content="initial-scale=1,maximum-scale=1,user-scalable=false"/>
<link href="https://api.mapbox.com/mapbox-gl-js/v3.2.0/mapbox-gl.css" rel="stylesheet"/>
<script src="https://api.mapbox.com/mapbox-gl-js/v3.2.0/mapbox-gl.js"></script>
<style>html,body{margin:0;height:100%}#map{position:absolute;inset:0}</style>
</head>
<body>
<div id="map"></div>
<script>
  const MAPBOX_TOKEN = {{ mapbox_token | tojson }};
  const STYLE_URL    = {{ style_url | tojson }};
  const HOST         = {{ host | tojson }};
  const TOKEN        = {{ token | tojson }};
  const CENTER       = [{{ center_lng }}, {{ center_lat }}];
  const ZOOM         = {{ zoom }};
  const MINZOOM      = {{ minzoom }};
  const MAXZOOM      = {{ maxzoom }};
  const LAYER_ID     = {{ layer_id | tojson }};
  const SOURCE_LAYER = {{ source_layer | tojson }};
  const FILL_COLOR   = {{ fill_color | tojson }};
  const FILL_OPAC    = {{ fill_opacity }};
  const OUTLINE_COL  = {{ outline_color | tojson }};

  function tilesFromToken(tok) {
    return `${HOST.replace(/\/+$/,'')}/server/v1/realtime-shared/${tok}/run/tiles/{z}/{x}/{y}?dtype_out_vector=mvt`;
  }

  mapboxgl.accessToken = MAPBOX_TOKEN;
  const map = new mapboxgl.Map({ container:'map', style:STYLE_URL, center:CENTER, zoom:ZOOM });

  map.on('load', () => {
    map.addSource('xyz', { type:'vector', tiles:[tilesFromToken(TOKEN)], minzoom:MINZOOM, maxzoom:MAXZOOM });

    map.addLayer({
      id: LAYER_ID,
      type: 'fill',
      source: 'xyz',
      'source-layer': SOURCE_LAYER,
      filter: ['==', ['geometry-type'], 'Polygon'],
      paint: { 'fill-color': FILL_COLOR, 'fill-opacity': FILL_OPAC }
    });

    map.addLayer({
      id: LAYER_ID + '-outline',
      type: 'line',
      source: 'xyz',
      'source-layer': SOURCE_LAYER,
      filter: ['==', ['geometry-type'], 'Polygon'],
      paint: { 'line-color': OUTLINE_COL, 'line-width': 0.5, 'line-opacity': 0.9 }
    });
  });
</script>
</body>
</html>
""").render(
      token=token, host=host, mapbox_token=mapbox_token, style_url=style_url,
      center_lng=center_lng, center_lat=center_lat, zoom=zoom,
      minzoom=minzoom, maxzoom=maxzoom, layer_id=layer_id,
      source_layer=source_layer, fill_color=fill_color, fill_opacity=fill_opacity,
      outline_color=outline_color,
  )
  common = fused.load("https://github.com/fusedio/udfs/tree/351515e/public/common/")
  return common.html_to_obj(html)
Expected DataFrame structure:
| geometry | any_column |
|---|---|
| POLYGON(...) | any_value |
| POLYGON(...) | any_value |
Note: Column values don't affect styling - all features get the same color.
2. Property-Based Colors
Use data column values to calculate colors dynamically.
Live example rendered from a UDF (HTML output):
Expected DataFrame structure:
| geometry | value | height |
|---|---|---|
| POLYGON(...) | 5 | 25 |
| POLYGON(...) | 8 | 40 |
| POLYGON(...) | 3 | 15 |
Note: Numerical columns are used directly in color calculations.
Expand to see Visualise JSON
{
  "tileLayer": {
    "@@type": "TileLayer",
    "minZoom": 0,
    "maxZoom": 19,
    "tileSize": 256,
    "pickable": true
  },
  "rasterLayer": {
    "@@type": "BitmapLayer",
    "pickable": true
  },
  "vectorLayer": {
    "@@type": "GeoJsonLayer",
    "stroked": true,
    "filled": true,
    "pickable": true,
    "extruded": true,
    "getElevation": "@@=properties.value * 10",
    "lineWidthMinPixels": 1,
    "getFillColor": "@@=[properties.value * 50, properties.value * 30, properties.value * 2]",
    "getLineColor": [50, 50, 50, 255]
  }
}
Expand to see standalone UDF code
@fused.udf(cache_max_age=0)
def udf(
    token: str = "UDF_DSM_Zonal_Stats",
    host: str = "https://www.fused.io",
    mapbox_token: str = "pk.eyJ1IjoiaXNhYWNmdXNlZGxhYnMiLCJhIjoiY2xicGdwdHljMHQ1bzN4cWhtNThvbzdqcSJ9.73fb6zHMeO_c8eAXpZVNrA",
    style_url: str = "mapbox://styles/mapbox/dark-v10",
    center_lng: float = -122.4194,
    center_lat: float = 37.7749,
    zoom: float = 12,
    minzoom: int = 0,
    maxzoom: int = 15,
    layer_id: str = "vector-choro",
    source_layer: str = "udf",
    value_attr: str = "stats",
    domain_min: float = 0.0,
    domain_mid: float = 50.0,
    domain_max: float = 100.0,
    color_min: str = "#2b65a0",
    color_mid: str = "#35af6d",
    color_max: str = "#e8ff59",
    fill_opacity: float = 0.65,
    outline_color: str = "#111111",
):
    from jinja2 import Template
    html = Template(r"""
<!DOCTYPE html>
<html>
<head>
  <meta charset="utf-8"/>
  <title>Vector Fill - Property Based</title>
  <meta name="viewport" content="initial-scale=1,maximum-scale=1,user-scalable=false"/>
  <link href="https://api.mapbox.com/mapbox-gl-js/v3.2.0/mapbox-gl.css" rel="stylesheet"/>
  <script src="https://api.mapbox.com/mapbox-gl-js/v3.2.0/mapbox-gl.js"></script>
  <style>html,body{margin:0;height:100%}#map{position:absolute;inset:0}</style>
</head>
<body>
  <div id="map"></div>
  <script>
    const MAPBOX_TOKEN = {{ mapbox_token | tojson }};
    const STYLE_URL    = {{ style_url | tojson }};
    const HOST         = {{ host | tojson }};
    const TOKEN        = {{ token | tojson }};
    const CENTER       = [{{ center_lng }}, {{ center_lat }}];
    const ZOOM         = {{ zoom }};
    const MINZOOM      = {{ minzoom }};
    const MAXZOOM      = {{ maxzoom }};
    const LAYER_ID     = {{ layer_id | tojson }};
    const SOURCE_LAYER = {{ source_layer | tojson }};
    const ATTR         = {{ value_attr | tojson }};
    const DMIN         = {{ domain_min }};
    const DMID         = {{ domain_mid }};
    const DMAX         = {{ domain_max }};
    const CMIN         = {{ color_min | tojson }};
    const CMID         = {{ color_mid | tojson }};
    const CMAX         = {{ color_max | tojson }};
    const FILL_OPAC    = {{ fill_opacity }};
    const OUTLINE_COL  = {{ outline_color | tojson }};

    function tilesFromToken(tok) {
      return `${HOST.replace(/\/+$/,'')}/server/v1/realtime-shared/${tok}/run/tiles/{z}/{x}/{y}?dtype_out_vector=mvt`;
    }

    mapboxgl.accessToken = MAPBOX_TOKEN;
    const map = new mapboxgl.Map({ container:'map', style:STYLE_URL, center:CENTER, zoom:ZOOM });

    function valueExpr() {
      return ['to-number', ['get', ATTR]];
    }

    map.on('load', () => {
      map.addSource('xyz', { type:'vector', tiles:[tilesFromToken(TOKEN)], minzoom:MINZOOM, maxzoom:MAXZOOM });

      map.addLayer({
        id: LAYER_ID,
        type: 'fill',
        source: 'xyz',
        'source-layer': SOURCE_LAYER,
        filter: ['==', ['geometry-type'], 'Polygon'],
        paint: {
          'fill-color': [
            'interpolate', ['linear'], ['coalesce', valueExpr(), DMIN],
            DMIN, CMIN,
            DMID, CMID,
            DMAX, CMAX
          ],
          'fill-opacity': FILL_OPAC
        }
      });

      map.addLayer({
        id: LAYER_ID + '-outline',
        type: 'line',
        source: 'xyz',
        'source-layer': SOURCE_LAYER,
        filter: ['==', ['geometry-type'], 'Polygon'],
        paint: { 'line-color': OUTLINE_COL, 'line-width': 0.5, 'line-opacity': 0.9 }
      });
    });
  </script>
</body>
</html>
""").render(
        token=token, host=host, mapbox_token=mapbox_token, style_url=style_url,
        center_lng=center_lng, center_lat=center_lat, zoom=zoom,
        minzoom=minzoom, maxzoom=maxzoom, layer_id=layer_id, source_layer=source_layer,
        value_attr=value_attr, domain_min=domain_min, domain_mid=domain_mid, domain_max=domain_max,
        color_min=color_min, color_mid=color_mid, color_max=color_max,
        fill_opacity=fill_opacity, outline_color=outline_color,
    )
    common = fused.load("https://github.com/fusedio/udfs/tree/351515e/public/common/")
    return common.html_to_obj(html)
When to use: When you want colors to directly reflect data values with custom calculations.
Example UDF
3. Conditional Colors with hasProp
Handle missing data gracefully with fallback colors.
Expected DataFrame structure:
| geometry | value | status |
|---|---|---|
| POLYGON(...) | 25 | active |
| POLYGON(...) | NaN | inactive |
| POLYGON(...) | 15 | active |
Note: Can handle missing/null values with fallback styling.
Expand to see Visualise code
{
  "tileLayer": {
    "@@type": "TileLayer",
    "minZoom": 0,
    "maxZoom": 19,
    "tileSize": 256,
    "pickable": true
  },
  "rasterLayer": {
    "@@type": "BitmapLayer",
    "pickable": true
  },
  "vectorLayer": {
    "@@type": "GeoJsonLayer",
    "stroked": true,
    "filled": true,
    "pickable": true,
    "extruded": true,
    "getElevation": {
      "@@function": "hasProp",
      "property": "value",
      "present": "@@=properties.value",
      "absent": 1
    },
    "lineWidthMinPixels": 1,
    "getFillColor": {
      "@@function": "hasProp",
      "property": "value",
      "present": "@@=[properties.value * 50, properties.value * 3, properties.value * 2]",
      "absent": [255, 0, 255]
    }
  }
}
When to use: When your data might have missing values and you need reliable fallbacks.
Example UDF
Understanding hasProp Function
The hasProp function is a core Fused utility for conditional styling based on data property presence. It's the foundation for handling missing or null values gracefully in visualizations.
How it works:
"getFillColor": {
  "@@function": "hasProp",
  "property": "metric",
  "present": "@@=[255, (1 - properties.metric/500) * 255, 0]",
  "absent": [220, 255, 100]
}
Key Properties:
"@@function": "hasProp": Declares the conditional function"property": "column_name": Specifies which DataFrame column to check"present": expression: Styling when the property exists and is not null"absent": value: Fallback styling when the property is missing or null
Common Use Cases:
- Missing data: Handle null/NaN values in datasets
- Optional columns: Style features that may not have certain attributes
- Data validation: Provide visual feedback for incomplete records
- Progressive enhancement: Add styling layers based on data availability
Example with elevation:
"getElevation": {
  "@@function": "hasProp",
  "property": "height",
  "present": "@@=properties.height * 10",
  "absent": 1
}
This ensures buildings without height data still appear with a default elevation of 1 unit.
4. Category Colors
Use predefined color palettes for categorical data.
Live example rendered from a UDF (HTML output):
Expected DataFrame structure:
| geometry | building_type | zone |
|---|---|---|
| POLYGON(...) | residential | A |
| POLYGON(...) | commercial | B |
| POLYGON(...) | industrial | A |
Note: Categorical columns with distinct values for color mapping.
Expand to see Visualise JSON
{
  "tileLayer": {
    "@@type": "TileLayer",
    "minZoom": 0,
    "maxZoom": 19,
    "tileSize": 256,
    "pickable": true
  },
  "rasterLayer": {
    "@@type": "BitmapLayer",
    "pickable": true
  },
  "vectorLayer": {
    "@@type": "GeoJsonLayer",
    "stroked": true,
    "filled": true,
    "pickable": true,
    "lineWidthMinPixels": 1,
    "getFillColor": {
      "@@function": "colorCategories",
      "attr": "building_type",
      "domain": [
        "residential",
        "commercial",
        "industrial",
        "public"
      ],
      "colors": "Bold"
    }
  }
}
Expand to see the Standalone UDF
@fused.udf(cache_max_age=0)
def udf(
  token: str = "UDF_FEMA_Buildings_US",
  host: str = "https://www.fused.io",
  mapbox_token: str = "pk.eyJ1IjoiaXNhYWNmdXNlZGxhYnMiLCJhIjoiY2xicGdwdHljMHQ1bzN4cWhtNThvbzdqcSJ9.73fb6zHMeO_c8eAXpZVNrA",
  style_url: str = "mapbox://styles/mapbox/dark-v10",
  center_lng: float = -74.0110,   # longitude
  center_lat: float = 40.7133,
  zoom: float = 14,
  minzoom: int = 0,
  maxzoom: int = 15,
  source_layer: str = "udf",
  layer_id: str = "fema-categories",
  attr_name: str = "OCC_CLS",
  domain: list = None,
  # CARTOColors Bold palette (7 colors)
  colors: list = None,
  fill_opacity: float = 0.65,
  outline_color: str = "#0b0b0b"
):
  from jinja2 import Template

  if domain is None:
      domain = [
          "Assembly",
          "Commercial",
          "Utility and Misc",
          "Residential",
          "Industrial",
          "Education",
          "Government",
      ]
  if colors is None:
      colors = ["#7F3C8D", "#11A579", "#3969AC", "#F2B701", "#E73F74", "#80BA5A", "#E68310"]

  html = Template(r"""
<!DOCTYPE html>
<html>
<head>
<meta charset="utf-8"/>
<title>Category Colors (Mapbox GL)</title>
<meta name="viewport" content="initial-scale=1,maximum-scale=1,user-scalable=no"/>
<link href="https://api.mapbox.com/mapbox-gl-js/v3.2.0/mapbox-gl.css" rel="stylesheet"/>
<script src="https://api.mapbox.com/mapbox-gl-js/v3.2.0/mapbox-gl.js"></script>
<style>html,body{margin:0;height:100%}#map{position:absolute;inset:0}</style>
</head>
<body>
<div id="map"></div>
<script>
  const MAPBOX_TOKEN = {{ mapbox_token | tojson }};
  const STYLE_URL    = {{ style_url    | tojson }};
  const HOST         = {{ host         | tojson }};
  const TOKEN        = {{ token        | tojson }};
  const CENTER       = [{{ center_lng }}, {{ center_lat }}];
  const ZOOM         = {{ zoom }};
  const MINZOOM      = {{ minzoom }};
  const MAXZOOM      = {{ maxzoom }};
  const SOURCE_LAYER = {{ source_layer | tojson }};
  const LAYER_ID     = {{ layer_id     | tojson }};
  const ATTR_NAME    = {{ attr_name    | tojson }};
  const DOMAIN       = {{ domain       | tojson }};
  const COLORS       = {{ colors       | tojson }};
  const FILL_OPAC    = {{ fill_opacity }};
  const OUTLINE_COL  = {{ outline_color | tojson }};

  function tilesFromToken(h, tok) {
    return h.replace(/\/+$/,'') + `/server/v1/realtime-shared/${tok}/run/tiles/{z}/{x}/{y}?dtype_out_vector=mvt`;
  }

  function matchByCategory(attr, domain, colors, fallbackColor) {
    // ['match', ['get', attr], domain[0], colors[0], domain[1], colors[1], ..., fallback]
    const expr = ['match', ['get', attr]];
    for (let i = 0; i < Math.min(domain.length, colors.length); i++) {
      expr.push(domain[i], colors[i]);
    }
    expr.push(fallbackColor);
    return expr;
  }

  mapboxgl.accessToken = MAPBOX_TOKEN;
  const map = new mapboxgl.Map({
    container: 'map',
    style: STYLE_URL,
    center: CENTER,
    zoom: ZOOM
  });

  map.on('load', () => {
    // Vector MVT from the FEMA UDF token
    map.addSource('fema', {
      type: 'vector',
      tiles: [tilesFromToken(HOST, TOKEN)],
      minzoom: MINZOOM,
      maxzoom: MAXZOOM
    });

    // Polygons fill by category
    map.addLayer({
      id: LAYER_ID,
      type: 'fill',
      source: 'fema',
      'source-layer': SOURCE_LAYER,
      filter: ['==', ['geometry-type'], 'Polygon'],
      paint: {
        'fill-color': matchByCategory(ATTR_NAME, DOMAIN, COLORS, '#BBBBBB'),
        'fill-opacity': FILL_OPAC
      }
    });

    // Thin polygon outline
    map.addLayer({
      id: LAYER_ID + '-outline',
      type: 'line',
      source: 'fema',
      'source-layer': SOURCE_LAYER,
      filter: ['==', ['geometry-type'], 'Polygon'],
      paint: { 'line-color': OUTLINE_COL, 'line-width': 0.5, 'line-opacity': 0.9 }
    });

    // Optional: hover cursor over polygons
    map.on('mouseenter', LAYER_ID, () => map.getCanvas().style.cursor = 'pointer');
    map.on('mouseleave', LAYER_ID, () => map.getCanvas().style.cursor = '');
  });
</script>
</body>
</html>
""").render(
      token=token,
      host=host,
      mapbox_token=mapbox_token,
      style_url=style_url,
      center_lng=center_lng,
      center_lat=center_lat,
      zoom=zoom,
      minzoom=minzoom,
      maxzoom=maxzoom,
      source_layer=source_layer,
      layer_id=layer_id,
      attr_name=attr_name,
      domain=domain,
      colors=colors,
      fill_opacity=fill_opacity,
      outline_color=outline_color,
  )

  common = fused.load("https://github.com/fusedio/udfs/tree/351515e/public/common/")
  return common.html_to_obj(html)
When to use: Categorical data like building types, land use classifications, or administrative regions.
Note that unexpected behaviors may arise if too many domains are used.
Example UDF
5. Continuous Color Scales
Use gradient color scales for continuous numerical data.
Live example rendered from a UDF (HTML output):
Expected DataFrame structure:
| hex | population | density |
|---|---|---|
| 8a2a1072b59ffff | 1250 | 45.2 |
| 8a2a1072b5bffff | 890 | 32.1 |
| 8a2a1072b5dffff | 2100 | 67.8 |
Note: Numerical columns with values within the specified domain range.
Expand to see Visualise JSON
{
  "tileLayer": {
    "@@type": "TileLayer",
    "minZoom": 0,
    "maxZoom": 19,
    "tileSize": 256,
    "pickable": true
  },
  "rasterLayer": {
    "@@type": "BitmapLayer",
    "pickable": true
  },
  "vectorLayer": {
    "@@type": "H3HexagonLayer",
    "stroked": true,
    "filled": true,
    "pickable": true,
    "extruded": true,
    "opacity": 1,
    "coverage": 0.9,
    "lineWidthMinPixels": 5,
    "getHexagon": "@@=properties.hex",
    "getFillColor": {
      "@@function": "colorContinuous",
      "attr": "population",
      "domain": [0, 10000],
      "steps": 15,
      "colors": "SunsetDark",
      "nullColor": [184, 184, 184]
    },
    "getElevation": {
      "@@function": "hasProp",
      "property": "population",
      "present": "@@=properties.population / 100",
      "absent": 1
    },
    "elevationScale": 10
  }
}
Expand to see the Standalone UDF
@fused.udf(cache_max_age=0)
def udf(
    data_url: str = "https://www.fused.io/server/v1/realtime-shared/UDF_DuckDB_H3_SF/run/file?format=json",
    mapbox_token: str = "pk.eyJ1IjoiaXNhYWNmdXNlZGxhYnMiLCJhIjoiY2xicGdwdHljMHQ1bzN4cWhtNThvbzdqcSJ9.73fb6zHMeO_c8eAXpZVNrA",
    style_url: str = "mapbox://styles/mapbox/dark-v10",
    center_lng: float = -122.417759,
    center_lat: float = 37.776452,
    zoom: float = 11.0,
    pitch: float = 45.0,
    bearing: float = 0.0,
    elevation_scale: float = 10.0,
    wireframe: bool = False,
    domain_min: float = 0.0,
    domain_max: float = 1000.0,
    null_color: tuple = (184, 184, 184),
):
    from jinja2 import Template
    html = Template(r"""
<!DOCTYPE html>
<html>
<head>
  <meta charset="utf-8"/>
  <title>H3 Continuous Color Scale</title>
  <meta name="viewport" content="initial-scale=1,maximum-scale=1,user-scalable=no"/>
  <link href="https://api.mapbox.com/mapbox-gl-js/v3.2.0/mapbox-gl.css" rel="stylesheet"/>
  <script src="https://api.mapbox.com/mapbox-gl-js/v3.2.0/mapbox-gl.js"></script>
  <script src="https://unpkg.com/h3-js@latest/dist/h3-js.umd.js"></script>
  <script src="https://unpkg.com/deck.gl@9.0.0/dist.min.js"></script>
  <style>html, body { margin:0; height:100%; } #map { position:absolute; inset:0; }</style>
</head>
<body>
  <div id="map"></div>
  <script>
    if (typeof h3 === 'undefined') throw new Error('h3-js must load before deck.gl');

    const MAPBOX_TOKEN = {{ mapbox_token | tojson }};
    const STYLE_URL    = {{ style_url    | tojson }};
    const DATA_URL     = {{ data_url     | tojson }};

    const INITIAL_VIEW_STATE = {
      longitude: {{ center_lng }}, latitude: {{ center_lat }}, zoom: {{ zoom }}, pitch: {{ pitch }}, bearing: {{ bearing }}
    };

    const ELEVATION_SCALE = {{ elevation_scale }};
    const WIREFRAME       = {{ wireframe | tojson }};
    const DOMAIN_MIN      = {{ domain_min }};
    const DOMAIN_MAX      = {{ domain_max }};
    const NULL_COLOR      = {{ null_color | tojson }};

    function ramp(t){ t=Math.max(0,Math.min(1,t)); const s=[[52,18,88],[226,83,18],[248,213,72]]; const n=s.length-1; const p=t*n; const i=Math.floor(p); const f=p-i; const a=s[i],b=s[Math.min(i+1,n)]; return [Math.round(a[0]+(b[0]-a[0])*f),Math.round(a[1]+(b[1]-a[1])*f),Math.round(a[2]+(b[2]-a[2])*f)]; }
    function colorForCount(c){ if(!Number.isFinite(c)) return [NULL_COLOR[0],NULL_COLOR[1],NULL_COLOR[2]]; if(DOMAIN_MAX===DOMAIN_MIN) return ramp(1); const t=(c-DOMAIN_MIN)/(DOMAIN_MAX-DOMAIN_MIN); return ramp(t); }

    mapboxgl.accessToken = MAPBOX_TOKEN;
    if (mapboxgl.setTelemetryEnabled) { try { mapboxgl.setTelemetryEnabled(false); } catch(e){} }
    const map = new mapboxgl.Map({ container:'map', style:STYLE_URL, center:[INITIAL_VIEW_STATE.longitude, INITIAL_VIEW_STATE.latitude], zoom:INITIAL_VIEW_STATE.zoom, pitch:INITIAL_VIEW_STATE.pitch, bearing:INITIAL_VIEW_STATE.bearing });
    const overlay = new deck.MapboxOverlay({ interleaved:true, layers:[] });

    map.on('load', () => {
      map.addControl(overlay);
      const layer = new deck.H3HexagonLayer({
        id:'h3-continuous', data:DATA_URL, pickable:true, extruded:true, wireframe:WIREFRAME,
        material:{ ambient:0.35, diffuse:0.6, shininess:32, specularColor:[255,255,255] },
        getHexagon:d=>d.hex,
        getElevation:d=>{ const c=(d&&Number.isFinite(d.count))?d.count:0; return c*ELEVATION_SCALE; },
        getFillColor:d=>{ const c=(d&&Number.isFinite(d.count))?d.count:NaN; const rgb=colorForCount(c); return [rgb[0],rgb[1],rgb[2],210]; },
        stroked:true, getLineColor:[30,30,30], getLineWidth:1, lineWidthUnits:'pixels',
      });
      overlay.setProps({ layers:[layer] });
    });
  </script>
</body>
</html>
""").render(
        data_url=data_url, mapbox_token=mapbox_token, style_url=style_url,
        center_lng=center_lng, center_lat=center_lat, zoom=zoom,
        pitch=pitch, bearing=bearing, elevation_scale=elevation_scale,
        wireframe=wireframe, domain_min=domain_min, domain_max=domain_max,
        null_color=list(null_color),
    )
    common = fused.load("https://github.com/fusedio/udfs/tree/351515e/public/common/")
    return common.html_to_obj(html)
When to use: Continuous numerical data like population density, temperature, or elevation values.
Example UDF
6. Transparency & Opacity
Control the transparency of your visualizations for layering effects and visual hierarchy.
Vector Color Transparency:
"getFillColor": [255, 100, 100, 200],  // RGBA: Red, Green, Blue, Alpha
"getLineColor": [50, 50, 50, 255]      // Fully opaque outline
Opacity Guidelines:
- Good visibility: Use 180-255 for clearly visible features
- Semi-transparent: Use 100-179 for overlay effects
- Avoid very low opacity: Values below 100 make features barely visible
- Solid colors: Omit alpha channel for full opacity:
[255, 100, 100]
Examples:
// Good examples
"getFillColor": [255, 100, 100, 200],  // Clearly visible red
"getFillColor": [100, 150, 200],       // Solid blue (alpha defaults to 255)

// Poor examples
"getFillColor": [255, 255, 255, 25],   // Too transparent, barely visible
"getFillColor": [100, 150, 200, 50]    // Hard to see on most backgrounds
Raster Transparency:
- RGB images: Black pixels (0,0,0) are automatically transparent
- RGBA images: Use the 4th channel (alpha) for transparency control
Advanced Features
3D Visualization
Enable 3D effects by setting extruded: true and using getElevation:
Expected DataFrame structure:
| geometry | height_value | floors |
|---|---|---|
| POLYGON(...) | 45 | 15 |
| POLYGON(...) | 120 | 40 |
| POLYGON(...) | 30 | 10 |
Note: Numerical columns used for building height/elevation in 3D view. Use "@@=properties.column_name" syntax to reference height data.
Expand to see Visualise JSON
{
  "tileLayer": {
    "@@type": "TileLayer",
    "minZoom": 0,
    "maxZoom": 19,
    "tileSize": 256,
    "pickable": true
  },
  "rasterLayer": {
    "@@type": "BitmapLayer",
    "pickable": true
  },
  "vectorLayer": {
    "@@type": "GeoJsonLayer",
    "stroked": true,
    "filled": true,
    "pickable": true,
    "extruded": true,
    "getElevation": "@@=properties.height_value * 5",
    "elevationScale": 10,
    "getFillColor": [100, 150, 200, 180]
  }
}
Live example rendered from a UDF (HTML output):
Expand to see the Standalone UDF
@fused.udf(cache_max_age=0)
def udf(
    token: str = "UDF_DSM_Zonal_Stats",
    host: str = "https://www.fused.io",  # or https://staging.fused.io
    mapbox_token: str = "pk.eyJ1IjoiaXNhYWNmdXNlZGxhYnMiLCJhIjoiY2xicGdwdHljMHQ1bzN4cWhtNThvbzdqcSJ9.73fb6zHMeO_c8eAXpZVNrA",
    style_url: str = "mapbox://styles/mapbox/dark-v10",
    center_lng: float = -122.4194,  # SF
    center_lat: float = 37.7749,
    zoom: float = 16.0,
    pitch: float = 60.0,
    bearing: float = -20.0,
    minzoom: int = 0,
    maxzoom: int = 15,
    elevation_scale: float = 1.0,   # stats -> height multiplier
):
    from jinja2 import Template

    """
    Minimal Deck.gl 3D vector map (no raster). Requires server to serve MVT:
      {host}/.../{token}/run/tiles/{z}/{x}/{y}?dtype_out_vector=mvt
    """
    html = Template(r"""
<!DOCTYPE html>
<html>
<head>
  <meta charset="utf-8"/>
  <title>Deck.gl 3D Vector (Minimal)</title>
  <meta name="viewport" content="initial-scale=1,maximum-scale=1,user-scalable=no"/>
  <link href="https://api.mapbox.com/mapbox-gl-js/v3.2.0/mapbox-gl.css" rel="stylesheet"/>
  <script src="https://api.mapbox.com/mapbox-gl-js/v3.2.0/mapbox-gl.js"></script>
  <script src="https://unpkg.com/deck.gl@latest/dist.min.js"></script>
  <style>
    html,body{margin:0;height:100%} #map{position:absolute;inset:0}
  </style>
</head>
<body>
  <div id="map"></div>
  <script>
    const MAPBOX_TOKEN = {{ mapbox_token | tojson }};
    const STYLE_URL    = {{ style_url | tojson }};
    const HOST         = {{ host | tojson }};
    const TOKEN        = {{ token | tojson }};
    const CENTER       = [{{ center_lng }}, {{ center_lat }}];
    const ZOOM         = {{ zoom }};
    const PITCH        = {{ pitch }};
    const BEARING      = {{ bearing }};
    const MIN_ZOOM     = {{ minzoom }};
    const MAX_ZOOM     = {{ maxzoom }};
    const ELEV_SCALE   = {{ elevation_scale }};

    const mvtURL = (h,t) => h.replace(/\/+$/,'') +
      `/server/v1/realtime-shared/${t}/run/tiles/{z}/{x}/{y}?dtype_out_vector=mvt`;

    mapboxgl.accessToken = MAPBOX_TOKEN;
    if (mapboxgl.setTelemetryEnabled) { try { mapboxgl.setTelemetryEnabled(false); } catch(e){} }

    const map = new mapboxgl.Map({
      container: 'map',
      style: STYLE_URL,
      center: CENTER,
      zoom: ZOOM,
      pitch: PITCH,
      bearing: BEARING
    });

    const overlay = new deck.MapboxOverlay({
      layers: []
    });

    map.on('load', () => {
      map.addControl(overlay);

      const vector3d = new deck.MVTLayer({
        id: 'vector-3d',
        data: mvtURL(HOST, TOKEN),
        minZoom: MIN_ZOOM,
        maxZoom: MAX_ZOOM,
        pickable: true,
        extruded: true,
        wireframe: false,
        getElevation: f => {
          const s = f.properties && f.properties.stats;
          return (Number.isFinite(s) ? Number(s) : 0) * ELEV_SCALE;
        },
        getFillColor: f => {
          const s = f.properties && f.properties.stats;
          if (!Number.isFinite(s)) return [160,160,160,60];
          const t = Math.max(0, Math.min(1, s/100));
          return [Math.floor(30+200*t), Math.floor(120+60*(1-t)), Math.floor(90+30*(1-t)), 200];
        },
        getLineColor: [0,0,0,120],
        lineWidthMinPixels: 1,
        onClick: info => {
          if (!info || !info.coordinate || !info.object) return;
          new mapboxgl.Popup({closeButton:true})
            .setLngLat(info.coordinate)
            .setHTML('<pre style="margin:0;white-space:pre-wrap;">' +
                     JSON.stringify(info.object.properties||{}, null, 2) + '</pre>')
            .addTo(map);
        }
      });

      // Simple lighting so the extrusion looks 3D
      const ambient = new deck.AmbientLight({intensity: 1.0});
      const dir     = new deck.DirectionalLight({intensity: 1.0, direction: [-1,-2,-1]});
      overlay.setProps({ layers: [vector3d], effects: [new deck.LightingEffect({ambientLight: ambient, dirLight: dir})]});
    });
  </script>
</body>
</html>
""").render(
        token=token,
        host=host,
        mapbox_token=mapbox_token,
        style_url=style_url,
        center_lng=center_lng,
        center_lat=center_lat,
        zoom=zoom,
        pitch=pitch,
        bearing=bearing,
        minzoom=minzoom,
        maxzoom=maxzoom,
        elevation_scale=elevation_scale,
    )

    common = fused.load("https://github.com/fusedio/udfs/tree/351515e/public/common/")
    return common.html_to_obj(html)
Hold Cmd (macOS) or Ctrl (Windows/Linux) while dragging to tilt the map view and see 3D effects.
Example UDF
Debug Layers (DebugTileLayer)
Use DebugTileLayer with custom loading and error states for development:
Expand to see Visualise code
{
  "tileLayer": {
    "@@type": "DebugTileLayer",
    "minZoom": 0,
    "maxZoom": 15,
    "tileSize": 256,
    "pickable": true
  },
  "rasterLayer": {
    "@@type": "BitmapLayer",
    "pickable": true
  },
  "vectorLayer": {
    "@@type": "GeoJsonLayer",
    "stroked": true,
    "filled": true,
    "pickable": true,
    "extruded": true,
    "lineWidthMinPixels": 1
  },
  "loadingLayer": {
    "@@type": "GeoJsonLayer",
    "stroked": true,
    "filled": false,
    "pickable": true,
    "lineWidthMinPixels": 10,
    "getLineColor": [25, 55, 0, 255]
  },
  "errorLayer": {
    "@@type": "GeoJsonLayer",
    "stroked": true,
    "filled": true,
    "pickable": true,
    "lineWidthMinPixels": 10,
    "getLineColor": [255, 255, 0, 255],
    "getFillColor": [255, 20, 255, 40]
  }
}
Performance Optimization
- Zoom levels: Set appropriate
minZoomandmaxZoomto control data loading - Line width units: Use
lineWidthUnits: "pixels"for consistent appearance across zoom levels - Tile size: Adjust
tileSizefor optimal performance with your data density
FAQ: Debugging your visualizations
Why is my vector layer not colorized?
Let's take the example of a UDF that returns a GeoDataFrame with hex values:
@fused.udf()
def udf(
    bounds: fused.types.Bounds = None,
):
    # get_hex() is a non-important function for this demo that gives us US counties
    df_hex = get_hex(gdf, hex_res)
    df_hex['state_id'] = [id[:2] for id in df_hex["GEOID"]]

    return df_hex
And our visualization JSON looks like this:
  {
  "hexLayer": {
    "@@type": "H3HexagonLayer",
    "filled": true,
    "pickable": true,
    "extruded": false,
    "getHexagon": "@@=properties.hex",
    "getFillColor": {
      "@@function": "colorContinuous",
      "attr": "state_id",
      "domain": [
        0,
        50
      ],
      "steps": 2,
      "colors": "Magenta"
    }
  }
}
You should make sure:
hexLayer > getFillColor > attris set to a column that exists in theGeoDataFrame(in this casestate_id)- Make sure your
attrcolumn is in eitherintorfloattype, not instr. In this case we should caststate_idtoint:
@fused.udf()
def udf(
    bounds: fused.types.Bounds = None,
):
    df_hex = get_hex(gdf, hex_res)
    df_hex['state_id'] = [id[:2] for id in df_hex["GEOID"]]
    df_hex['state_id'] = df_hex['state_id'].astype(int)

    return df_hex
- Making sure your values are within the correct domain (
hexLayer > getFillColor > domain). In our case, we're showing US States, so the domain should be[0, 50].
Why are my 3D buildings not showing?
Common 3D visualization issues:
-
Wrong elevation function: Don't use distance functions like
haversinefor elevation// ❌ Wrong - haversine is for distances
"getElevation": {
"@@function": "haversine",
"attr": "HEIGHT"
}
// ✅ Correct - direct property reference
"getElevation": "@@=properties.HEIGHT" -
Missing required properties: Ensure you have both
extruded: trueand a height column"vectorLayer": {
"@@type": "GeoJsonLayer",
"extruded": true,
"getElevation": "@@=properties.height_value",
"elevationScale": 10
} -
Low transparency: Avoid very low alpha values that make buildings invisible
// ❌ Too transparent (barely visible)
"getFillColor": [255, 255, 255, 25]

// ✅ Good visibility
"getFillColor": [100, 150, 200, 180]
Why is my layer not appearing at all?
Common visibility issues:
- Pickable setting: Check that
pickable: trueis set for interactivity - Data type mismatch: Verify your UDF returns the expected data type (
GeoDataFramefor vector,arrayfor raster) - Zoom level issues: Ensure zoom levels (
minZoom,maxZoom) include your current map zoom level - Missing geometry: GeoJsonLayer requires a geometry column in your GeoDataFrame
- Incorrect layer type: Make sure you're using the right
@@typefor your data (GeoJsonLayer vs H3HexagonLayer)
For more details on DeckGL properties, see the DeckGL documentation.