Map (Legacy)
Map Builder is deprecated and hidden by default. You can re-enable it under Workbench Preferences → Deprecated features → Enable map view. For new work, use the Fused Map widget instead — see the Widget API for all available widgets.
As developers edit UDFs in the Code Editor and explore data, they can receive immediate visual feedback on how the code's transformations affect the data.
Geospatial data
Fused will render gpd.GeoDataFrame, gpd.GeoSeries, and shapely geometry UDF outputs as geometries on the map if their CRS is EPSG:4326. If the CRS differs, Fused will make a best-effort to project and render the geometries correctly.
To render array (raster) objects on the map, they must be uint8 and define their spatial extent. Objects like xarray.DataArray already contain spatial metadata. The spatial extent of arrays without spatial metadata, like numpy.ndarray, can be specified with a geometry object or an array bounds as [xmin, ymin, xmax, ymax]. If the bounds are not present, they default to (-180, -90, 180, 90).
# doctest: skip
return np.array([[…], […]]), [xmin, ymin, xmax, ymax]
For UDFs that return map Tiles, Fused runs the UDF for only the Tiles in the viewport. This enables efficient analysis on a fraction of a dataset.
Map controls
The map can be panned by dragging the viewport, zoomed in and out, and rotated with Cmd + Click + drag on MacOS (Ctrl + Click + drag on Windows / Linux)
The top of the map has controls to interact with the viewport. These include an address search bar, a basemap selector, a fullscreen toggle, data visualization icon, and a three-dot menu providing access to additional map options.
You can change the basemap in the map style settings in the top-right corner of the map. Currently, light, dark, satellite, and blank basemaps are supported.
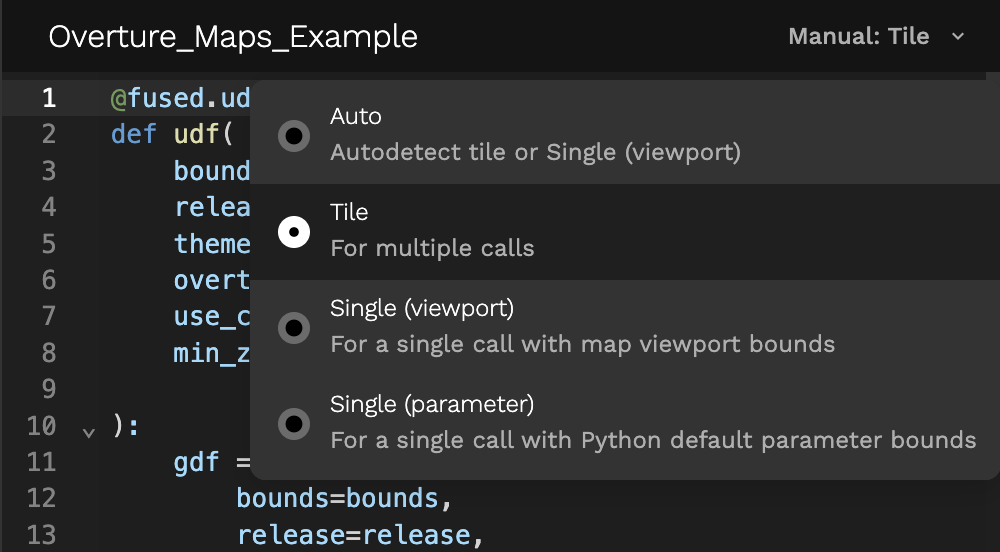
Auto, Tile, and Single (Viewport, Parameter)
On Map Builder, UDFs can explicitly be set to run as Tile or File - or autoselect between the two if the bounds object is typed.
Debug
Clicking a rendered feature enters debug mode. To exit, press Escape or click the X in the map tooltip header."
When data renders successfully on the map, clicking or hovering on it shows attributes for selected pixels or geometries. When data doesn't render, clicking errored tiles shows an error code, and the full error details can be copied as JSON. Additional debugging information can be found in the Runtime pane.