End to End Example with AIS Ship Positions
This page walks through a full H3 Data Retrieval Service pipeline on a large dataset: 1.12 billion ship positions in US waters, July to October 2024. We download NOAA's daily files, partition them into H3 files by day, index them, then query them from a UDF and straight from GET /h3/query. The canvas UDFs that start jobs are guarded, so opening the canvas never starts one. To learn the steps on a small dataset first, see Partition, Index and Query.
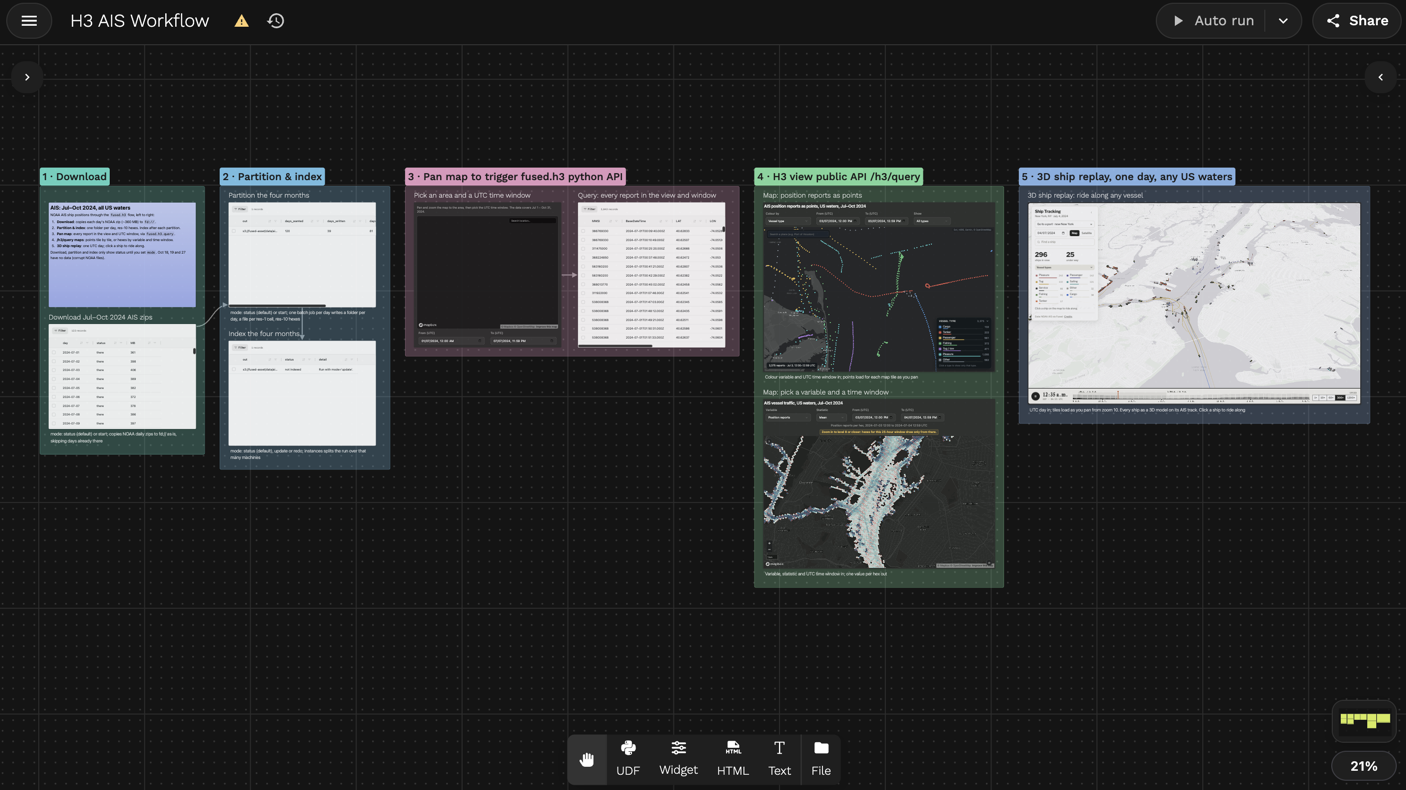
The H3_AIS_Workflow canvas has five sections: download, partition and index, a UDF query, maps on /h3/query and a 3D ship replay. Open it to run any of them.
- Source: NOAA AIS daily files, every vessel position report off US coasts
- Time range: 2024-07-01 to 2024-10-31, 123 days. NOAA's files for October 18, 19 and 27 are corrupt, so 120 days are partitioned.
- H3 settings: each report gets the H3 cell at resolution 10 that holds its position, and the data is partitioned by date, one folder per day
- Public copy: the result is indexed at
s3://fused-asset/data/ais/ais_week_h3_v2/and anyone can read it. To only query, skip to step 4.
1. Download
NOAA publishes one zip per day, about 290 to 410 MB each, at https://coast.noaa.gov/htdata/CMSP/AISDataHandler/2024/AIS_2024_07_01.zip. A UDF copies the zips as they are to Fused storage, all days at once, and skips the days already there.
Returns: one row per day with its status and size. Two days take about 90 seconds.
Code
@fused.udf(cache_max_age=0)
def udf(days: list = ["2024-07-01", "2024-07-02"], raw: str = "fd://ais_raw/"):
    from concurrent.futures import ThreadPoolExecutor

    import fsspec
    import pandas as pd
    import requests

    fs = fsspec.filesystem("s3")
    folder = fused.api.resolve(raw).rstrip("/")

    def copy(day):
        name = f"AIS_{day.replace('-', '_')}.zip"
        dest = f"{folder}/{name}"
        if fs.exists(dest):
            return {"day": day, "status": "already there"}
        url = f"https://coast.noaa.gov/htdata/CMSP/AISDataHandler/{day[:4]}/{name}"
        with requests.get(url, stream=True, timeout=300) as r:
            r.raise_for_status()
            with fs.open(f"{dest}.part", "wb") as out:
                for chunk in r.iter_content(1 << 23):
                    out.write(chunk)
        fs.mv(f"{dest}.part", dest)
        return {"day": day, "status": "downloaded", "MB": round(fs.size(dest) / 1e6)}

    with ThreadPoolExecutor(len(days)) as pool:
        return pd.DataFrame(list(pool.map(copy, days)))
2. Partition
- Source: each zip holds a CSV, so a UDF reads one day and adds a
datecolumn. Partition runs it withfused.h3.sources.udf. - Resolution: 10. Each cell has an edge of about 76 m, small enough to tell ships apart in a harbor (see the Resolution Guide).
- Partitioned by date: one folder per day, and each day is its own job. A day is about 9 to 10 million rows and takes about a minute to read on
m5.xlarge. - Running again: days already written are skipped, and
redo=Truerewrites the days you pass; see Running again.
Writes: one folder per day, with one Parquet file per large H3 cell inside it. The UDF returns the run id at once; two days finish in about 5 minutes.
ais_h3/
├── date=2024-07-01/
│   ├── 81033ffffffffff.parquet
│   └── ...
├── date=2024-07-02/
│   └── ...
└── _manifest.json
Code
@fused.udf(cache_max_age=0)
def udf(days: list = ["2024-07-01", "2024-07-02"], raw: str = "fd://ais_raw/", out: str = "fd://ais_h3/"):
    @fused.udf
    def read_day(date: str, raw: str):
        import zipfile

        import fsspec
        import numpy as np
        import pyarrow as pa
        import pyarrow.compute as pc
        import pyarrow.csv as pacsv

        types = {
            "MMSI": pa.int64(), "BaseDateTime": pa.timestamp("s"),
            "LAT": pa.float64(), "LON": pa.float64(), "SOG": pa.float64(), "COG": pa.float64(), "Heading": pa.float64(),
            "VesselName": pa.string(), "IMO": pa.string(), "CallSign": pa.string(),
            "VesselType": pa.float64(), "Status": pa.float64(), "Length": pa.float64(), "Width": pa.float64(),
            "Draft": pa.float64(), "Cargo": pa.float64(), "TransceiverClass": pa.string(),
        }
        zip_path = f"{fused.api.resolve(raw).rstrip('/')}/AIS_{date.replace('-', '_')}.zip"
        with fsspec.open(zip_path, "rb") as f, zipfile.ZipFile(f) as z, z.open(z.namelist()[0]) as csv:
            table = pacsv.read_csv(csv, convert_options=pacsv.ConvertOptions(column_types=types))
        lat, lon = table["LAT"], table["LON"]
        valid = pc.and_(
            pc.and_(pc.is_valid(lat), pc.is_valid(lon)),
            pc.and_(pc.and_(pc.greater_equal(lat, -90), pc.less_equal(lat, 90)), pc.and_(pc.greater_equal(lon, -180), pc.less_equal(lon, 180))),
        )
        table = table.filter(valid)
        return table.append_column("date", pa.array(np.full(table.num_rows, np.datetime64(date, "D")), pa.date32()))

    run = fused.h3.partition(
        fused.h3.sources.udf(read_day, raw=raw),
        out,
        partition_by={"date": days},
        point_column=("LAT", "LON"),
        h3_res=10,
        file_res=1,
        read_engine="m5.xlarge",
        engine="m5.xlarge",
    )
    return run.id
3. Index
- What it records: the cells, dates and time range each file covers, so a query reads only the files it needs.
- Columns:
hexfor the H3 cell,BaseDateTimefor time,datefor the partition. - Parallel: the 120 day folders are split into 12 slices that index at once.
- Running again: indexes only new or changed days;
redo=Truereads every day again. Seefused.h3.index.
Returns: the run id at once. The status of the public copy, from fused.h3.index_status:
| Field | Value |
|---|---|
| Status | ready |
| Files | 6,880 |
| Resolution | 10 |
| Time range | 2024-07-01 to 2024-10-31 |
date values | 120 |
Code
@fused.udf(cache_max_age=0)
def udf(path: str = "fd://ais_h3/"):
    run = fused.h3.index(path, time_column="BaseDateTime", options={"instances": 12})
    return run.id
4. Query
A UDF calls fused.h3.query with the map view (bounds) and a UTC time window, and returns every report inside them. A widget next to it sends the view and the window as you pan.
Returns: 6,214 reports from 194 vessels in New York Harbor for one hour, in 0.1 seconds. The whole day, 2024-07-03, returns 126,828 reports from 422 vessels in 0.13 seconds.
Code
@fused.udf
def udf():
    return fused.h3.query(
        "s3://fused-asset/data/ais/ais_week_h3_v2/",
        bbox=(-74.10, 40.55, -73.90, 40.72),
        time_min="2024-07-03T12:00:00",
        time_max="2024-07-03T12:59:59",
        columns=["MMSI", "BaseDateTime", "LAT", "LON", "SOG", "VesselName", "VesselType"],
    )
5. Map from /h3/query
This map reads every report in view straight from GET /h3/query, one request per map tile, with no UDF and no sign-in. Pick a UTC time window and what to colour the reports by; panning loads only the new tiles.
Widget code
To run this map, add a widget node to any canvas and paste in this JSON. It reads the public dataset straight from GET /h3/query, so it needs no UDF.
{
 "type": "div",
 "props": {
  "style": "width:100%;height:100%;display:grid;grid-template-rows:auto auto minmax(0,1fr);gap:10px"
 },
 "children": [
  {
   "type": "text",
   "props": {
    "value": "AIS position reports as points, US waters, Jul–Oct 2024",
    "variant": "h4",
    "style": "white-space:nowrap;overflow:hidden;text-overflow:ellipsis"
   }
  },
  {
   "type": "div",
   "props": {
    "style": "display:flex;flex-direction:row;flex-wrap:nowrap;gap:10px;align-items:flex-end;min-width:0"
   },
   "children": [
    {
     "type": "dropdown",
     "props": {
      "label": "Colour by",
      "param": "ais_pt_variable",
      "defaultValue": "vessel_type",
      "style": "flex:0.8 1 0;min-width:100px;max-width:230px;white-space:nowrap",
      "options": [
       {
        "value": "vessel_type",
        "label": "Vessel type"
       },
       {
        "value": "SOG",
        "label": "Speed over ground (kn)"
       },
       {
        "value": "Length",
        "label": "Vessel length (m)"
       }
      ]
     }
    },
    {
     "type": "datetime-input",
     "props": {
      "label": "From (UTC)",
      "param": "ais_pt_from",
      "mode": "datetime",
      "defaultValue": "2024-07-03T12:00",
      "min": "2024-07-01T00:00",
      "max": "2024-10-31T23:59",
      "style": "flex:1.5 1 0;min-width:150px;max-width:220px;white-space:nowrap"
     }
    },
    {
     "type": "datetime-input",
     "props": {
      "label": "To (UTC)",
      "param": "ais_pt_to",
      "mode": "datetime",
      "defaultValue": "2024-07-03T12:59",
      "min": "2024-07-01T00:00",
      "max": "2024-10-31T23:59",
      "style": "flex:1.5 1 0;min-width:150px;max-width:220px;white-space:nowrap"
     }
    },
    {
     "type": "dropdown",
     "props": {
      "label": "Show",
      "param": "ais_pt_type",
      "defaultValue": "all",
      "placeholder": "All types",
      "disabled": false,
      "centered": false,
      "nullable": false,
      "allowInvalidValue": false,
      "searchable": false,
      "style": "flex:0.7 1 0;min-width:96px;max-width:190px;white-space:nowrap",
      "options": [
       {
        "value": "all",
        "label": "All types"
       },
       {
        "value": "Cargo",
        "label": "Cargo"
       },
       {
        "value": "Tanker",
        "label": "Tanker"
       },
       {
        "value": "Passenger",
        "label": "Passenger"
       },
       {
        "value": "Fishing",
        "label": "Fishing"
       },
       {
        "value": "Tug / tow",
        "label": "Tug / tow"
       },
       {
        "value": "Pleasure",
        "label": "Pleasure"
       },
       {
        "value": "Other",
        "label": "Other"
       }
      ]
     }
    }
   ]
  },
  {
   "type": "div",
   "props": {
    "style": "position:relative;width:100%;height:100%;min-height:0;border-radius:6px;overflow:hidden"
   },
   "children": [
    {
     "type": "html",
     "props": {
      "style": "position:absolute;inset:0",
      "value": "<!doctype html>\n<html>\n<head>\n<meta charset=\"utf-8\">\n<script src=\"https://unpkg.com/deck.gl@9.1.15/dist.min.js\"></script>\n<style>\n  html, body { margin: 0; height: 100%; background: #0e1117; font: 12px system-ui, -apple-system, sans-serif; color: #e6e6e6; }\n  #map { position: absolute; inset: 0; }\n  .card { position: absolute; z-index: 2; background: rgba(14, 17, 23, 0.88); border: 1px solid rgba(255, 255, 255, 0.12); border-radius: 6px; padding: 6px 10px; }\n  #status { left: 12px; bottom: 12px; max-width: calc(100% - 290px); box-sizing: border-box; line-height: 1.45; white-space: nowrap; overflow: hidden; text-overflow: ellipsis; border-radius: 8px; }\n  body.lg-closed #status { max-width: calc(100% - 200px); }\n  #attr { position: absolute; z-index: 2; right: 8px; top: 6px; padding: 1px 6px; border-radius: 4px; background: rgba(14, 17, 23, 0.55); font-size: 9.5px; color: #8a93a0; pointer-events: none; white-space: nowrap; }\n  #status .note { color: #f2c14e; }\n  #legend { right: 12px; bottom: 12px; width: 236px; max-height: calc(100% - 70px); overflow: auto; padding: 8px 12px 9px; border-radius: 12px; background: rgba(14, 17, 23, 0.92); -webkit-backdrop-filter: blur(8px); backdrop-filter: blur(8px); box-shadow: 0 8px 24px rgba(0, 0, 0, 0.35); }\n  #legend .head { display: flex; align-items: center; gap: 8px; width: 100%; margin: 0 0 6px; padding: 2px 0; border: 0; background: none; font: inherit; font-size: 10.5px; letter-spacing: 0.7px; text-transform: uppercase; color: #9aa4b2; cursor: pointer; text-align: left; }\n  #legend .head b { flex: 1; min-width: 0; color: #e6e6e6; font-weight: 600; white-space: nowrap; overflow: hidden; text-overflow: ellipsis; }\n  #legend .head .tot { white-space: nowrap; font-variant-numeric: tabular-nums; }\n  #legend .head svg { width: 14px; height: 14px; flex: none; stroke: #9aa4b2; transition: transform 0.15s; }\n  #legend .head:hover b, #legend .head:hover svg { color: #fff; stroke: #fff; }\n  #legend.collapsed { width: auto; max-width: 220px; padding: 6px 10px; border-radius: 20px; }\n  #legend.collapsed .head { margin: 0; }\n  #legend.collapsed .head svg { transform: rotate(180deg); }\n  #legend.collapsed .body { display: none; }\n  #legend .row { display: grid; grid-template-columns: 11px minmax(0, 1fr) auto; align-items: center; gap: 8px; width: 100%; padding: 3px 4px; margin: 0 -4px; border: 0; border-radius: 5px; background: none; color: #d6dbe3; font: inherit; text-align: left; cursor: pointer; box-sizing: content-box; }\n  #legend .row:hover { background: rgba(255, 255, 255, 0.06); }\n  #legend .row.off { opacity: 0.35; }\n  #legend .row.on { background: rgba(255, 255, 255, 0.08); color: #fff; }\n  #legend .sw { width: 10px; height: 10px; border-radius: 3px; }\n  #legend .nm { min-width: 0; }\n  #legend .nm i { display: block; height: 3px; margin-top: 3px; border-radius: 2px; background: rgba(255, 255, 255, 0.08); overflow: hidden; }\n  #legend .nm i span { display: block; height: 100%; border-radius: 2px; }\n  #legend .ct { font-variant-numeric: tabular-nums; color: #9aa4b2; font-size: 11px; }\n  #legend .ramp { height: 10px; border-radius: 5px; margin: 4px 0 4px; }\n  #legend .ticks { display: flex; justify-content: space-between; color: #9aa4b2; font-size: 10.5px; font-variant-numeric: tabular-nums; }\n  #legend .hint { margin-top: 7px; font-size: 10.5px; color: #6b7480; }\n\n  #zoomcard { position: absolute; z-index: 3; left: 50%; top: 38%; transform: translate(-50%, -50%); width: min(340px, calc(100% - 40px)); padding: 14px 16px 15px; border-radius: 10px; background: rgba(14, 17, 23, 0.94); border: 1px solid rgba(242, 193, 78, 0.55); box-shadow: 0 0 0 4px rgba(242, 193, 78, 0.12), 0 10px 30px rgba(0, 0, 0, 0.45); text-align: center; }\n  #zoomcard .zt { font-size: 15px; font-weight: 700; color: #f2c14e; }\n  #zoomcard .zd { margin-top: 4px; color: #c3cad5; line-height: 1.45; }\n  #zoomcard button { margin-top: 10px; height: 30px; padding: 0 16px; border: 0; border-radius: 6px; background: #f2c14e; color: #14171f; font: 600 12.5px system-ui, -apple-system, sans-serif; cursor: pointer; }\n  #zoomcard button:hover { background: #ffd26a; }\n  .hidden { display: none !important; }\n  #search { left: 12px; top: 12px; width: max(160px, min(300px, calc(100% - 270px))); box-sizing: border-box; padding: 6px; border-radius: 10px; }\n  #q { width: 100%; box-sizing: border-box; background: #1a1f2b; color: #e6e6e6; border: 1px solid rgba(255,255,255,0.18); border-radius: 4px; padding: 6px 8px; font: inherit; outline: none; }\n  #results { max-height: 240px; overflow-y: auto; }\n  #results .res { padding: 5px 6px; cursor: pointer; border-radius: 4px; }\n  #results .res:hover { background: rgba(255,255,255,0.1); }\n</style>\n</head>\n<body>\n<div id=\"map\"></div>\n<div id=\"status\" class=\"card\">Loading…</div>\n<div id=\"legend\" class=\"card\"></div>\n<div id=\"attr\">Esri, HERE, Garmin, © OpenStreetMap</div>\n<div id=\"zoomcard\" class=\"hidden\"><div class=\"zt\">Zoom in to see the points</div><div class=\"zd\" id=\"zoomdet\"></div><button id=\"zoomin\">Zoom in</button></div>\n<div id='search' class='card'><input id='q' placeholder='Search a place (e.g. Port of Houston)' autocomplete='off'><div id='results'></div></div>\n<script type=\"module\">\nimport * as duckdb from \"https://cdn.jsdelivr.net/npm/@duckdb/duckdb-wasm@1.29.0/+esm\";\n\nconst dbReady = (async () => {\n  const bundle = await duckdb.selectBundle(duckdb.getJsDelivrBundles());\n  const wurl = URL.createObjectURL(new Blob(['importScripts(\"' + bundle.mainWorker + '\");'], { type: 'text/javascript' }));\n  const db = new duckdb.AsyncDuckDB(new duckdb.VoidLogger(), new Worker(wurl));\n  await db.instantiate(bundle.mainModule, bundle.pthreadWorker);\n  URL.revokeObjectURL(wurl);\n  const conn = await db.connect();\n  await conn.query('CREATE TABLE pts (tile VARCHAR, lon FLOAT, lat FLOAT, mmsi VARCHAR, name VARCHAR, time VARCHAR, sog FLOAT, cog FLOAT, length FLOAT, type_id UTINYINT, status SMALLINT)');\n  return { db, conn };\n})();\nconst sqlStr = v => \"'\" + String(v).replace(/'/g, \"''\") + \"'\";\nlet fileSeq = 0;\nconst TYPE_SQL = 'CASE WHEN vt BETWEEN 70 AND 79 THEN 0 WHEN vt BETWEEN 80 AND 89 THEN 1 WHEN vt BETWEEN 60 AND 69 THEN 2 WHEN vt = 30 THEN 3 WHEN vt IN (21,22,31,32,52) THEN 4 WHEN vt IN (36,37) THEN 5 ELSE 6 END';\n// Raw parquet bytes go straight into DuckDB (decoded in its worker, not on the UI thread).\nasync function insertParquet(tileKey, buf, b) {\n  const { db, conn } = await dbReady;\n  const f = 'p_' + (fileSeq++) + '.parquet';\n  await db.registerFileBuffer(f, new Uint8Array(buf));\n  try {\n    await conn.query('INSERT INTO pts SELECT ' + sqlStr(tileKey) + ', LON, LAT, CAST(MMSI AS VARCHAR), ' + \"COALESCE(VesselName, '')\" + ', CAST(BaseDateTime AS VARCHAR), CASE WHEN SOG >= 0 AND SOG < 102.3 THEN SOG END, CASE WHEN COG >= 0 AND COG < 360 THEN COG END, CASE WHEN Length > 0 THEN Length END, ' + TYPE_SQL + ', TRY_CAST(Status AS SMALLINT) FROM (SELECT *, TRY_CAST(VesselType AS INTEGER) AS vt FROM read_parquet(' + sqlStr(f) + ')) WHERE LON >= ' + b.west + ' AND LON < ' + b.east + ' AND LAT >= ' + b.south + ' AND LAT < ' + b.north);\n  } finally {\n    await db.dropFile(f);\n  }\n}\nfunction dropTile(key) {\n  return dbReady.then(({ conn }) => conn.query('DELETE FROM pts WHERE tile = ' + sqlStr(key))).catch(() => {});\n}\nlet gen = 0;\nlet visibleKeys = [];\nlet filter = { type: 'all' };\nlet table = null;\nlet nShown = 0;\nlet attrs = null, attrsVar = null, attrsTable = null;\nlet totalInView = 0;\nlet typeCounts = null;\nlet busy = false, pending = false;\n// Coalesce bursts of viewport/filter changes into one query at a time.\nasync function runFilter() {\n  if (busy) { pending = true; return; }\n  busy = true;\n  try { do { pending = false; await doFilter(); } while (pending); }\n  finally { busy = false; }\n}\nasync function doFilter() {\n  const keys = visibleKeys.slice();\n  if (!keys.length) { table = null; nShown = 0; typeCounts = null; showLegend(); render(); return; }\n  const { conn } = await dbReady;\n  let w = 'tile IN (' + keys.map(sqlStr).join(',') + ')';\n  const ti = TYPES.findIndex(t => t[0] === filter.type);\n  if (ti >= 0) w += ' AND type_id = ' + ti;\n  table = await conn.query('SELECT lon, lat, type_id, sog, length, mmsi, name, time, cog, status FROM pts WHERE ' + w);\n  nShown = table.numRows;\n  const cr = await conn.query('SELECT type_id, COUNT(*) AS n FROM pts WHERE tile IN (' + keys.map(sqlStr).join(',') + ') GROUP BY type_id');\n  typeCounts = new Array(TYPES.length).fill(0);\n  const ids = cr.getChild('type_id').toArray(), ns = cr.getChild('n').toArray();\n  for (let i = 0; i < ids.length; i++) typeCounts[ids[i]] = Number(ns[i]);\n  showLegend();\n  render();\n}\n// Build GPU-ready typed arrays once per result (no per-point JS objects).\nfunction buildAttrs(variable) {\n  const n = nShown;\n  const lon = table.getChild('lon').toArray(), lat = table.getChild('lat').toArray();\n  const pos = new Float32Array(n * 2), col = new Uint8Array(n * 4);\n  if (variable === 'vessel_type') {\n    const tid = table.getChild('type_id').toArray();\n    for (let i = 0; i < n; i++) { const c = TYPES[tid[i]][1]; col[4*i] = c[0]; col[4*i+1] = c[1]; col[4*i+2] = c[2]; col[4*i+3] = 255; }\n  } else {\n    const v = table.getChild(variable === 'SOG' ? 'sog' : 'length');\n    const dom = VARIABLES[variable].domain;\n    for (let i = 0; i < n; i++) { const c = ramp(v.get(i), dom); col[4*i] = c[0]; col[4*i+1] = c[1]; col[4*i+2] = c[2]; col[4*i+3] = c.length > 3 ? c[3] : 255; }\n  }\n  for (let i = 0; i < n; i++) { pos[2*i] = lon[i]; pos[2*i+1] = lat[i]; }\n  return { length: n, attributes: { getPosition: { value: pos, size: 2 }, getFillColor: { value: col, size: 4, normalized: true } } };\n}\n\nconst QUERY_URL = \"https://www.fused.io/server/v1/h3/query\";\nconst PATH = \"s3://fused-asset/data/ais/ais_week_h3_v2/\";\nconst COLUMNS = [\"MMSI\", \"BaseDateTime\", \"LAT\", \"LON\", \"SOG\", \"COG\", \"VesselName\", \"VesselType\", \"Status\", \"Length\"];\nconst MAX_HOURS = 168;\nconst MAX_PAGES = 4;\nconst DEFAULTS = { ais_pt_variable: \"vessel_type\", ais_pt_from: \"2024-07-03T12:00\", ais_pt_to: \"2024-07-03T12:59\" };\n\nconst TYPES = [\n  [\"Cargo\", [76, 155, 232]],\n  [\"Tanker\", [232, 87, 76]],\n  [\"Passenger\", [242, 193, 78]],\n  [\"Fishing\", [95, 201, 126]],\n  [\"Tug / tow\", [176, 124, 232]],\n  [\"Pleasure\", [76, 211, 211]],\n  [\"Other\", [138, 147, 160]]\n];\nconst TYPE_COLOR = Object.fromEntries(TYPES);\nconst RAMP = [[255, 255, 178], [254, 204, 92], [253, 141, 60], [240, 59, 32], [189, 0, 38], [122, 1, 119]];\nconst VARIABLES = {\n  vessel_type: { label: \"Vessel type\" },\n  SOG: { label: \"Speed over ground\", unit: \"kn\", domain: [0, 25] },\n  Length: { label: \"Vessel length\", unit: \"m\", domain: [0, 300] }\n};\nconst STATUS = { 0: \"Under way (engine)\", 1: \"At anchor\", 2: \"Not under command\", 3: \"Restricted manoeuvrability\", 5: \"Moored\", 7: \"Fishing\", 8: \"Under way (sailing)\" };\n\nfunction vesselType(code) {\n  if (code >= 70 && code <= 79) return \"Cargo\";\n  if (code >= 80 && code <= 89) return \"Tanker\";\n  if (code >= 60 && code <= 69) return \"Passenger\";\n  if (code === 30) return \"Fishing\";\n  if ([21, 22, 31, 32, 52].includes(code)) return \"Tug / tow\";\n  if (code === 36 || code === 37) return \"Pleasure\";\n  return \"Other\";\n}\n\nfunction ramp(value, domain) {\n  if (value == null || Number.isNaN(value)) return [138, 147, 160, 140];\n  const t = Math.min(1, Math.max(0, (value - domain[0]) / (domain[1] - domain[0]))) * (RAMP.length - 1);\n  const i = Math.min(RAMP.length - 2, Math.floor(t));\n  const f = t - i;\n  return RAMP[i].map((c, k) => Math.round(c + f * (RAMP[i + 1][k] - c)));\n}\n\nfunction zoomFloor(hours) {\n  if (hours <= 1) return 8;\n  if (hours <= 6) return 9;\n  if (hours <= 24) return 10;\n  if (hours <= 72) return 11;\n  return 12;\n}\n\nconst DATA_MIN = Date.parse(\"2024-07-01T00:00:00Z\"), DATA_MAX = Date.parse(\"2024-10-31T23:59:59Z\");\nfunction toMs(t, end) {\n  let v = String(t || \"\").trim().replace(\" \", \"T\");\n  if (v.length >= 19) v = v.slice(0, 19);\n  else if (v.length === 16) v += end ? \":59\" : \":00\";\n  else if (v.length === 10) v += end ? \"T23:59:59\" : \"T00:00:00\";\n  return Date.parse(v + \"Z\");\n}\n\nconst statusEl = document.getElementById(\"status\");\nconst legendEl = document.getElementById(\"legend\");\nlet state = null;\nlet zoom = 11;\nlet viewState = { longitude: -74.03, latitude: 40.63, zoom: 11, pitch: 0, bearing: 0 };\nlet loading = 0;\nlet inView = { points: 0, tiles: 0, cut: 0 };\n\nfunction readParams(p) {\n  const pick = k => (typeof p[k] === \"string\" && p[k] ? p[k] : DEFAULTS[k]);\n  let variable = pick(\"ais_pt_variable\");\n  if (!VARIABLES[variable]) variable = DEFAULTS.ais_pt_variable;\n  let start = toMs(pick(\"ais_pt_from\"), false);\n  let end = toMs(pick(\"ais_pt_to\"), true);\n  const notes = [];\n  if (!Number.isFinite(start) || !Number.isFinite(end)) {\n    start = toMs(DEFAULTS.ais_pt_from, false);\n    end = toMs(DEFAULTS.ais_pt_to, true);\n    notes.push(\"Could not read the time window, so the default hour is shown.\");\n  }\n  if (end < start) {\n    const a = toMs(pick(\"ais_pt_to\"), false), b = toMs(pick(\"ais_pt_from\"), true);\n    start = a; end = b;\n    notes.push(\"From was after To, so the two times are swapped.\");\n  }\n  if (start < DATA_MIN || end > DATA_MAX) {\n    start = Math.max(start, DATA_MIN);\n    end = Math.min(end, DATA_MAX);\n    notes.push(\"The data covers July 1 to October 31, 2024 only.\");\n  }\n  if (end <= start) { start = toMs(DEFAULTS.ais_pt_from, false); end = toMs(DEFAULTS.ais_pt_to, true); notes.push(\"The window had no time left, so the default hour is shown.\"); }\n  const timeMin = new Date(start).toISOString().slice(0, 19);\n  const timeMax = new Date(end).toISOString().slice(0, 19);\n  const hours = Math.max(1, (end - start + 1000) / 3600000);\n  return { variable, timeMin, timeMax, hours, floor: zoomFloor(hours), note: notes.join(\" \") };\n}\n\nfunction tileUrl(bbox, s, cursor) {\n  const q = new URLSearchParams({\n    path: PATH,\n    min_lng: bbox.west.toFixed(6), min_lat: bbox.south.toFixed(6),\n    max_lng: bbox.east.toFixed(6), max_lat: bbox.north.toFixed(6),\n    time_min: s.timeMin, time_max: s.timeMax, format: \"parquet\"\n  });\n  COLUMNS.forEach(c => q.append(\"columns\", c));\n  if (cursor) q.set(\"cursor\", cursor);\n  return QUERY_URL + \"?\" + q.toString();\n}\n\nasync function loadTile(tile, s, key) {\n  const bbox = tile.bbox;\n  let cursor = null;\n  let pages = 0;\n  do {\n    const r = await fetch(tileUrl(bbox, s, cursor), { signal: tile.signal });\n    if (r.status === 204) break;\n    if (!r.ok) {\n      const text = await r.text();\n      let detail = text;\n      try { detail = JSON.parse(text).detail || text; } catch (e) {}\n      throw new Error(\"HTTP \" + r.status + \": \" + String(detail).slice(0, 160));\n    }\n    const buf = await r.arrayBuffer();\n    if (tile.signal && tile.signal.aborted) break;\n    await insertParquet(key, buf, bbox);\n    cursor = r.headers.get(\"X-Fused-Next-Cursor\");\n    pages += 1;\n  } while (cursor && pages < MAX_PAGES);\n  return { key, cut: cursor ? 1 : 0 };\n}\n\nfunction colorOf(variable) {\n  if (variable === \"vessel_type\") return d => TYPE_COLOR[d.type];\n  const domain = VARIABLES[variable].domain;\n  const key = variable === \"SOG\" ? \"sog\" : \"length\";\n  return d => ramp(d[key], domain);\n}\n\nfunction esriLayer(name) {\n  return new deck.TileLayer({\n    id: \"esri-\" + name,\n    data: \"https://server.arcgisonline.com/ArcGIS/rest/services/Canvas/World_Dark_Gray_\" + name + \"/MapServer/tile/{z}/{y}/{x}\",\n    minZoom: 0,\n    maxZoom: 16,\n    tileSize: 256,\n    renderSubLayers: props => {\n      const b = props.tile.boundingBox;\n      return new deck.BitmapLayer(props, { data: null, image: props.data, bounds: [b[0][0], b[0][1], b[1][0], b[1][1]] });\n    }\n  });\n}\nconst basemap = esriLayer(\"Base\");\nconst labels = esriLayer(\"Reference\");\n\nfunction pointsLayer(s) {\n  const getFillColor = colorOf(s.variable);\n  return new deck.TileLayer({\n    id: \"ais-points\",\n    data: s.timeMin + \"/\" + s.timeMax,\n    minZoom: s.floor,\n    maxZoom: 14,\n    tileSize: 512,\n    maxRequests: 6,\n    refinementStrategy: \"no-overlap\",\n    getTileData: tile => {\n      loading += 1;\n      showStatus();\n      const key = s.gen + ':' + tile.id;\n      return loadTile(tile, s, key).finally(() => { loading -= 1; showStatus(); });\n    },\n    maxCacheSize: 60,\n    onTileUnload: tile => { if (tile.content && tile.content.key) dropTile(tile.content.key); },\n    onViewportLoad: tiles => {\n      visibleKeys = tiles.filter(t => t.content && t.content.key).map(t => t.content.key);\n      runFilter();\n      inView = {\n        tiles: tiles.length,\n        cut: tiles.reduce((n, t) => n + (t.content ? t.content.cut : 0), 0)\n      };\n      showStatus();\n    },\n    onTileError: e => { statusEl.innerHTML = \"\"; statusEl.textContent = \"Could not load points: \" + (e && e.message ? e.message : e); },\n    updateTriggers: { renderSubLayers: [s.variable] },\n    renderSubLayers: () => null\n  });\n}\n\nfunction filteredLayer(s) {\n  if (!table || !nShown) return null;\n  if (attrsTable !== table || attrsVar !== s.variable) { attrs = buildAttrs(s.variable); attrsTable = table; attrsVar = s.variable; }\n  return new deck.ScatterplotLayer({\n    id: \"ais-filtered\",\n    data: attrs,\n    radiusUnits: \"pixels\",\n    getRadius: 2.5,\n    radiusMinPixels: 1.5,\n    opacity: 0.85,\n    pickable: true\n  });\n}\n\nlet tilesLayer = null;\nfunction render() {\n  if (!state) return;\n  const ok = zoom >= state.floor;\n  map.setProps({ layers: ok ? [basemap, tilesLayer.clone(), filteredLayer(state), labels] : [basemap, labels] });\n  showStatus();\n}\n\nfunction windowText(hours) {\n  if (hours <= 1.01) return \"This 1-hour window\";\n  if (hours < 48) return \"This \" + Math.round(hours) + \"-hour window\";\n  return \"This \" + Math.round(hours / 24) + \"-day window\";\n}\n\nfunction fmt(v, unit) {\n  return v == null ? \"n/a\" : (Math.round(v * 10) / 10) + \" \" + unit;\n}\n\nfunction tooltip(info) {\n  if (!info || info.layer == null || info.layer.id !== 'ais-filtered' || info.index < 0 || !table) return null;\n  const o = table.get(info.index);\n  if (!o) return null;\n  const d = { name: o.name, mmsi: o.mmsi, time: String(o.time).slice(0, 19), type: TYPES[o.type_id][0], status: STATUS[o.status] || 'Other / not set', sog: o.sog, cog: o.cog, length: o.length };\n  return {\n    text: (d.name || \"Unknown vessel\") + \"\\nMMSI \" + d.mmsi + \"\\n\" + d.time + \" UTC\\n\" + d.type + \", \" + d.status +\n      \"\\nSpeed \" + fmt(d.sog, \"kn\") + \", course \" + fmt(d.cog, \"°\") + \"\\nLength \" + fmt(d.length, \"m\"),\n    style: { background: \"rgba(14,17,23,0.95)\", color: \"#e6e6e6\", fontSize: \"12px\", borderRadius: \"6px\", border: \"1px solid rgba(255,255,255,0.15)\" }\n  };\n}\n\nconst MONTHS = [\"Jan\", \"Feb\", \"Mar\", \"Apr\", \"May\", \"Jun\", \"Jul\", \"Aug\", \"Sep\", \"Oct\", \"Nov\", \"Dec\"];\nfunction shortSpan(a, b) {\n  const da = MONTHS[Number(a.slice(5, 7)) - 1] + \" \" + Number(a.slice(8, 10)), db = MONTHS[Number(b.slice(5, 7)) - 1] + \" \" + Number(b.slice(8, 10));\n  return da === db ? da + \", \" + a.slice(11, 16) + \"–\" + b.slice(11, 16) + \" UTC\" : da + \" \" + a.slice(11, 16) + \" – \" + db + \" \" + b.slice(11, 16) + \" UTC\";\n}\n\nfunction showStatus() {\n  if (!state) return;\n  const span = shortSpan(state.timeMin, state.timeMax);\n  let text;\n  const zc = document.getElementById(\"zoomcard\");\n  zc.classList.toggle(\"hidden\", zoom >= state.floor);\n  if (zoom < state.floor) {\n    document.getElementById(\"zoomdet\").textContent = windowText(state.hours) + \" loads points from zoom \" + state.floor + \". The map is at zoom \" + zoom.toFixed(1) + \".\";\n    text = \"Zoom in to zoom \" + state.floor + \" to see the points\";\n  } else if (loading > 0) {\n    text = \"Loading points… \" + loading + \" tile\" + (loading > 1 ? \"s\" : \"\") + \" to go\";\n  } else {\n    text = nShown.toLocaleString(\"en-US\") + \" reports\" + (filter.type !== \"all\" ? \" · \" + filter.type : \"\") + \" · \" + span;\n    if (inView.cut) text += \" · zoom in to see all points\";\n  }\n  statusEl.textContent = text;\n  statusEl.title = text + (state.note ? \". \" + state.note : \"\");\n  if (state.note) { const n = document.createElement(\"span\"); n.className = \"note\"; n.textContent = \" · \" + state.note; statusEl.appendChild(n); }\n}\n\nfunction showLegend() {\n  if (!state) return;\n  const info = VARIABLES[state.variable];\n  legendEl.innerHTML = \"\";\n  const head = document.createElement(\"button\");\n  head.className = \"head\";\n  head.type = \"button\";\n  head.title = legendOpen ? \"Hide the legend\" : \"Show the legend\";\n  const total = typeCounts ? typeCounts.reduce((a, b) => a + b, 0) : 0;\n  head.innerHTML = \"<b>\" + info.label + (info.unit ? \" (\" + info.unit + \")\" : \"\") + \"</b><span class='tot'>\" + (typeCounts ? total.toLocaleString(\"en-US\") : \"\") + \"</span><svg viewBox='0 0 24 24' fill='none' stroke-width='2.2' stroke-linecap='round' stroke-linejoin='round'><path d='M6 9l6 6 6-6'/></svg>\";\n  head.onclick = () => setLegendOpen(!legendOpen);\n  legendEl.appendChild(head);\n  const bodyEl = document.createElement(\"div\");\n  bodyEl.className = \"body\";\n  legendEl.appendChild(bodyEl);\n  if (state.variable === \"vessel_type\") {\n    const mx = typeCounts ? Math.max(1, ...typeCounts) : 1;\n    TYPES.forEach(([name, c], i) => {\n      const n = typeCounts ? typeCounts[i] : 0;\n      const b = document.createElement(\"button\");\n      b.className = \"row\" + (filter.type === name ? \" on\" : filter.type !== \"all\" ? \" off\" : \"\");\n      b.title = filter.type === name ? \"Show all types\" : \"Show only \" + name.toLowerCase();\n      const col = \"rgb(\" + c.join(\",\") + \")\";\n      b.innerHTML = \"<span class='sw' style='background:\" + col + \";box-shadow:0 0 6px \" + col + \"'></span><span class='nm'>\" + name + \"<i><span style='width:\" + (100 * n / mx).toFixed(1) + \"%;background:\" + col + \"'></span></i></span><span class='ct'>\" + (typeCounts ? n.toLocaleString(\"en-US\") : \"\") + \"</span>\";\n      b.onclick = () => setTypeFilter(filter.type === name ? \"all\" : name);\n      bodyEl.appendChild(b);\n    });\n    const hint = document.createElement(\"div\");\n    hint.className = \"hint\";\n    hint.textContent = \"Click a type to show only that type.\";\n    bodyEl.appendChild(hint);\n  } else {\n    const ramp = document.createElement(\"div\");\n    ramp.className = \"ramp\";\n    ramp.style.background = \"linear-gradient(90deg,\" + RAMP.map(c => \"rgb(\" + c.join(\",\") + \")\").join(\",\") + \")\";\n    bodyEl.appendChild(ramp);\n    const ticks = document.createElement(\"div\");\n    ticks.className = \"ticks\";\n    const d = info.domain;\n    for (let k = 0; k <= 4; k++) { const sp = document.createElement(\"span\"); sp.textContent = String(Math.round(d[0] + (d[1] - d[0]) * k / 4)) + (k === 4 ? \"+\" : \"\"); ticks.appendChild(sp); }\n    bodyEl.appendChild(ticks);\n  }\n  legendEl.classList.toggle(\"collapsed\", !legendOpen);\n  document.body.classList.toggle(\"lg-closed\", !legendOpen);\n}\n\nlet legendOpen = true;\ntry { const v = localStorage.getItem(\"ais_pt_legend\"); legendOpen = v ? v === \"open\" : window.innerWidth >= 700; } catch (e) { legendOpen = window.innerWidth >= 700; }\nfunction setLegendOpen(open) {\n  legendOpen = open;\n  try { localStorage.setItem(\"ais_pt_legend\", open ? \"open\" : \"closed\"); } catch (e) {}\n  showLegend();\n}\n\n\nfunction setTypeFilter(name) {\n  try { window.fused.params.set(\"ais_pt_type\", name); } catch (e) {}\n  update(Object.assign({}, window.fused.params.getAll(), { ais_pt_type: name }));\n}\n\nconst map = new deck.Deck({\n  parent: document.getElementById(\"map\"),\n  initialViewState: { longitude: -74.03, latitude: 40.63, zoom: 11, minZoom: 3, maxZoom: 16 },\n  controller: true,\n  getTooltip: tooltip,\n  onViewStateChange: ({ viewState: vs }) => {\n    viewState = vs;\n    const before = zoom < (state ? state.floor : 0);\n    zoom = vs.zoom;\n    if (before !== zoom < (state ? state.floor : 0)) render();\n    else if (state && zoom < state.floor) showStatus();\n  },\n  layers: [basemap, labels]\n});\n\ndocument.getElementById(\"zoomin\").onclick = () => {\n  if (!state) return;\n  const z = Math.min(16, state.floor + 0.4);\n  map.setProps({ initialViewState: Object.assign({}, viewState, { zoom: z, minZoom: 3, maxZoom: 16, transitionDuration: 900, transitionInterpolator: new deck.FlyToInterpolator() }) });\n  zoom = z;\n  render();\n};\n\nconst qEl = document.getElementById('q');\nconst resEl = document.getElementById('results');\nlet geoTimer = null;\nlet geoSeq = 0;\nqEl.addEventListener('input', () => {\n  clearTimeout(geoTimer);\n  const v = qEl.value.trim();\n  if (v.length < 3) { geoSeq++; resEl.innerHTML = ''; return; }\n  geoTimer = setTimeout(() => geocode(v), 400);\n});\nasync function geocode(v) {\n  const my = ++geoSeq;\n  resEl.textContent = 'Searching…';\n  try {\n    const r = await fetch('https://nominatim.openstreetmap.org/search?format=jsonv2&limit=6&q=' + encodeURIComponent(v));\n    const js = await r.json();\n    if (my !== geoSeq) return;\n    resEl.innerHTML = '';\n    if (!js.length) { resEl.textContent = 'No places found'; return; }\n    js.forEach(p => {\n      const d = document.createElement('div');\n      d.className = 'res';\n      d.textContent = p.display_name;\n      d.onclick = () => flyTo(p);\n      resEl.appendChild(d);\n    });\n  } catch (e) {\n    if (my === geoSeq) resEl.textContent = 'Search failed: ' + e.message;\n  }\n}\nfunction flyTo(p) {\n  resEl.innerHTML = '';\n  qEl.value = p.display_name.split(',')[0];\n  let z = 12;\n  if (p.boundingbox) {\n    const b = p.boundingbox.map(Number);\n    const span = Math.max(b[1] - b[0], b[3] - b[2], 0.001);\n    z = Math.min(14, Math.log2(360 / span) - 1);\n  }\n  z = Math.max(state ? state.floor : 8, z);\n  map.setProps({ initialViewState: { longitude: Number(p.lon), latitude: Number(p.lat), zoom: z, minZoom: 3, maxZoom: 16, transitionDuration: 1500, transitionInterpolator: new deck.FlyToInterpolator() } });\n  zoom = z;\n  render();\n}\n\nlet lastKey = \"\";\nfunction update(params) {\n  params = params || {};\n  const nf = { type: typeof params.ais_pt_type === 'string' && params.ais_pt_type ? params.ais_pt_type : 'all' };\n  const filterChanged = nf.type !== filter.type;\n  filter = nf;\n  const s = readParams(params);\n  const key = JSON.stringify(s);\n  if (key !== lastKey) {\n    const timeChanged = !state || state.timeMin !== s.timeMin || state.timeMax !== s.timeMax;\n    lastKey = key;\n    if (timeChanged) {\n      gen += 1;\n      visibleKeys = [];\n      table = null;\n      nShown = 0;\n      dbReady.then(({ conn }) => conn.query('DELETE FROM pts'));\n      s.gen = gen;\n      tilesLayer = pointsLayer(s);\n    } else {\n      s.gen = state.gen;\n    }\n    state = s;\n    showLegend();\n    render();\n  }\n  if (filterChanged) { showLegend(); runFilter(); }\n}\n\nupdate(window.fused.params.getAll());\nwindow.fused.params.onChange(update);\n</script>\n</body>\n</html>\n"
     }
    }
   ]
  }
 ]
}
Each tile is one request like this one, which returns the same hour as step 4 as a Parquet file; see Query a dataset for every parameter:
curl -G "https://www.fused.io/server/v1/h3/query" \
  --data-urlencode "path=s3://fused-asset/data/ais/ais_week_h3_v2/" \
  -d min_lng=-74.10 -d min_lat=40.55 -d max_lng=-73.90 -d max_lat=40.72 \
  -d time_min=2024-07-03T12:00:00 -d time_max=2024-07-03T12:59:59 \
  -d columns=MMSI -d columns=BaseDateTime -d columns=LAT -d columns=LON \
  -o harbor.parquet
6. Map with a fused-hex layer
A fused-hex layer on a Fused Map draws the dataset with no code: it calls GET /h3/query for each tile in view and colours each res-10 cell by its number of reports in the time window. Add this layer to a fused-map widget's layers.
Code
{
  "id": "ais",
  "type": "fused-hex",
  "h3Column": "hex",
  "minZoom": 8,
  "source": {
    "path": "s3://fused-asset/data/ais/ais_week_h3_v2/",
    "timeColumn": "BaseDateTime",
    "dateMin": "2024-07-03T12:00:00",
    "dateMax": "2024-07-03T12:59:59",
    "reduce": "sum",
    "variables": ["SOG"]
  },
  "style": {
    "fillColor": {"type": "continuous", "attr": "count", "palette": "Teal", "domain": [0, 50]}
  }
}
Reference
- Partition, Index and Query: best practices for each step
- H3 Large Datasets
- H3 Visualization: map an indexed dataset
fused.h3: the Python APIGET /h3/query: every parameter- H3_AIS_Workflow canvas