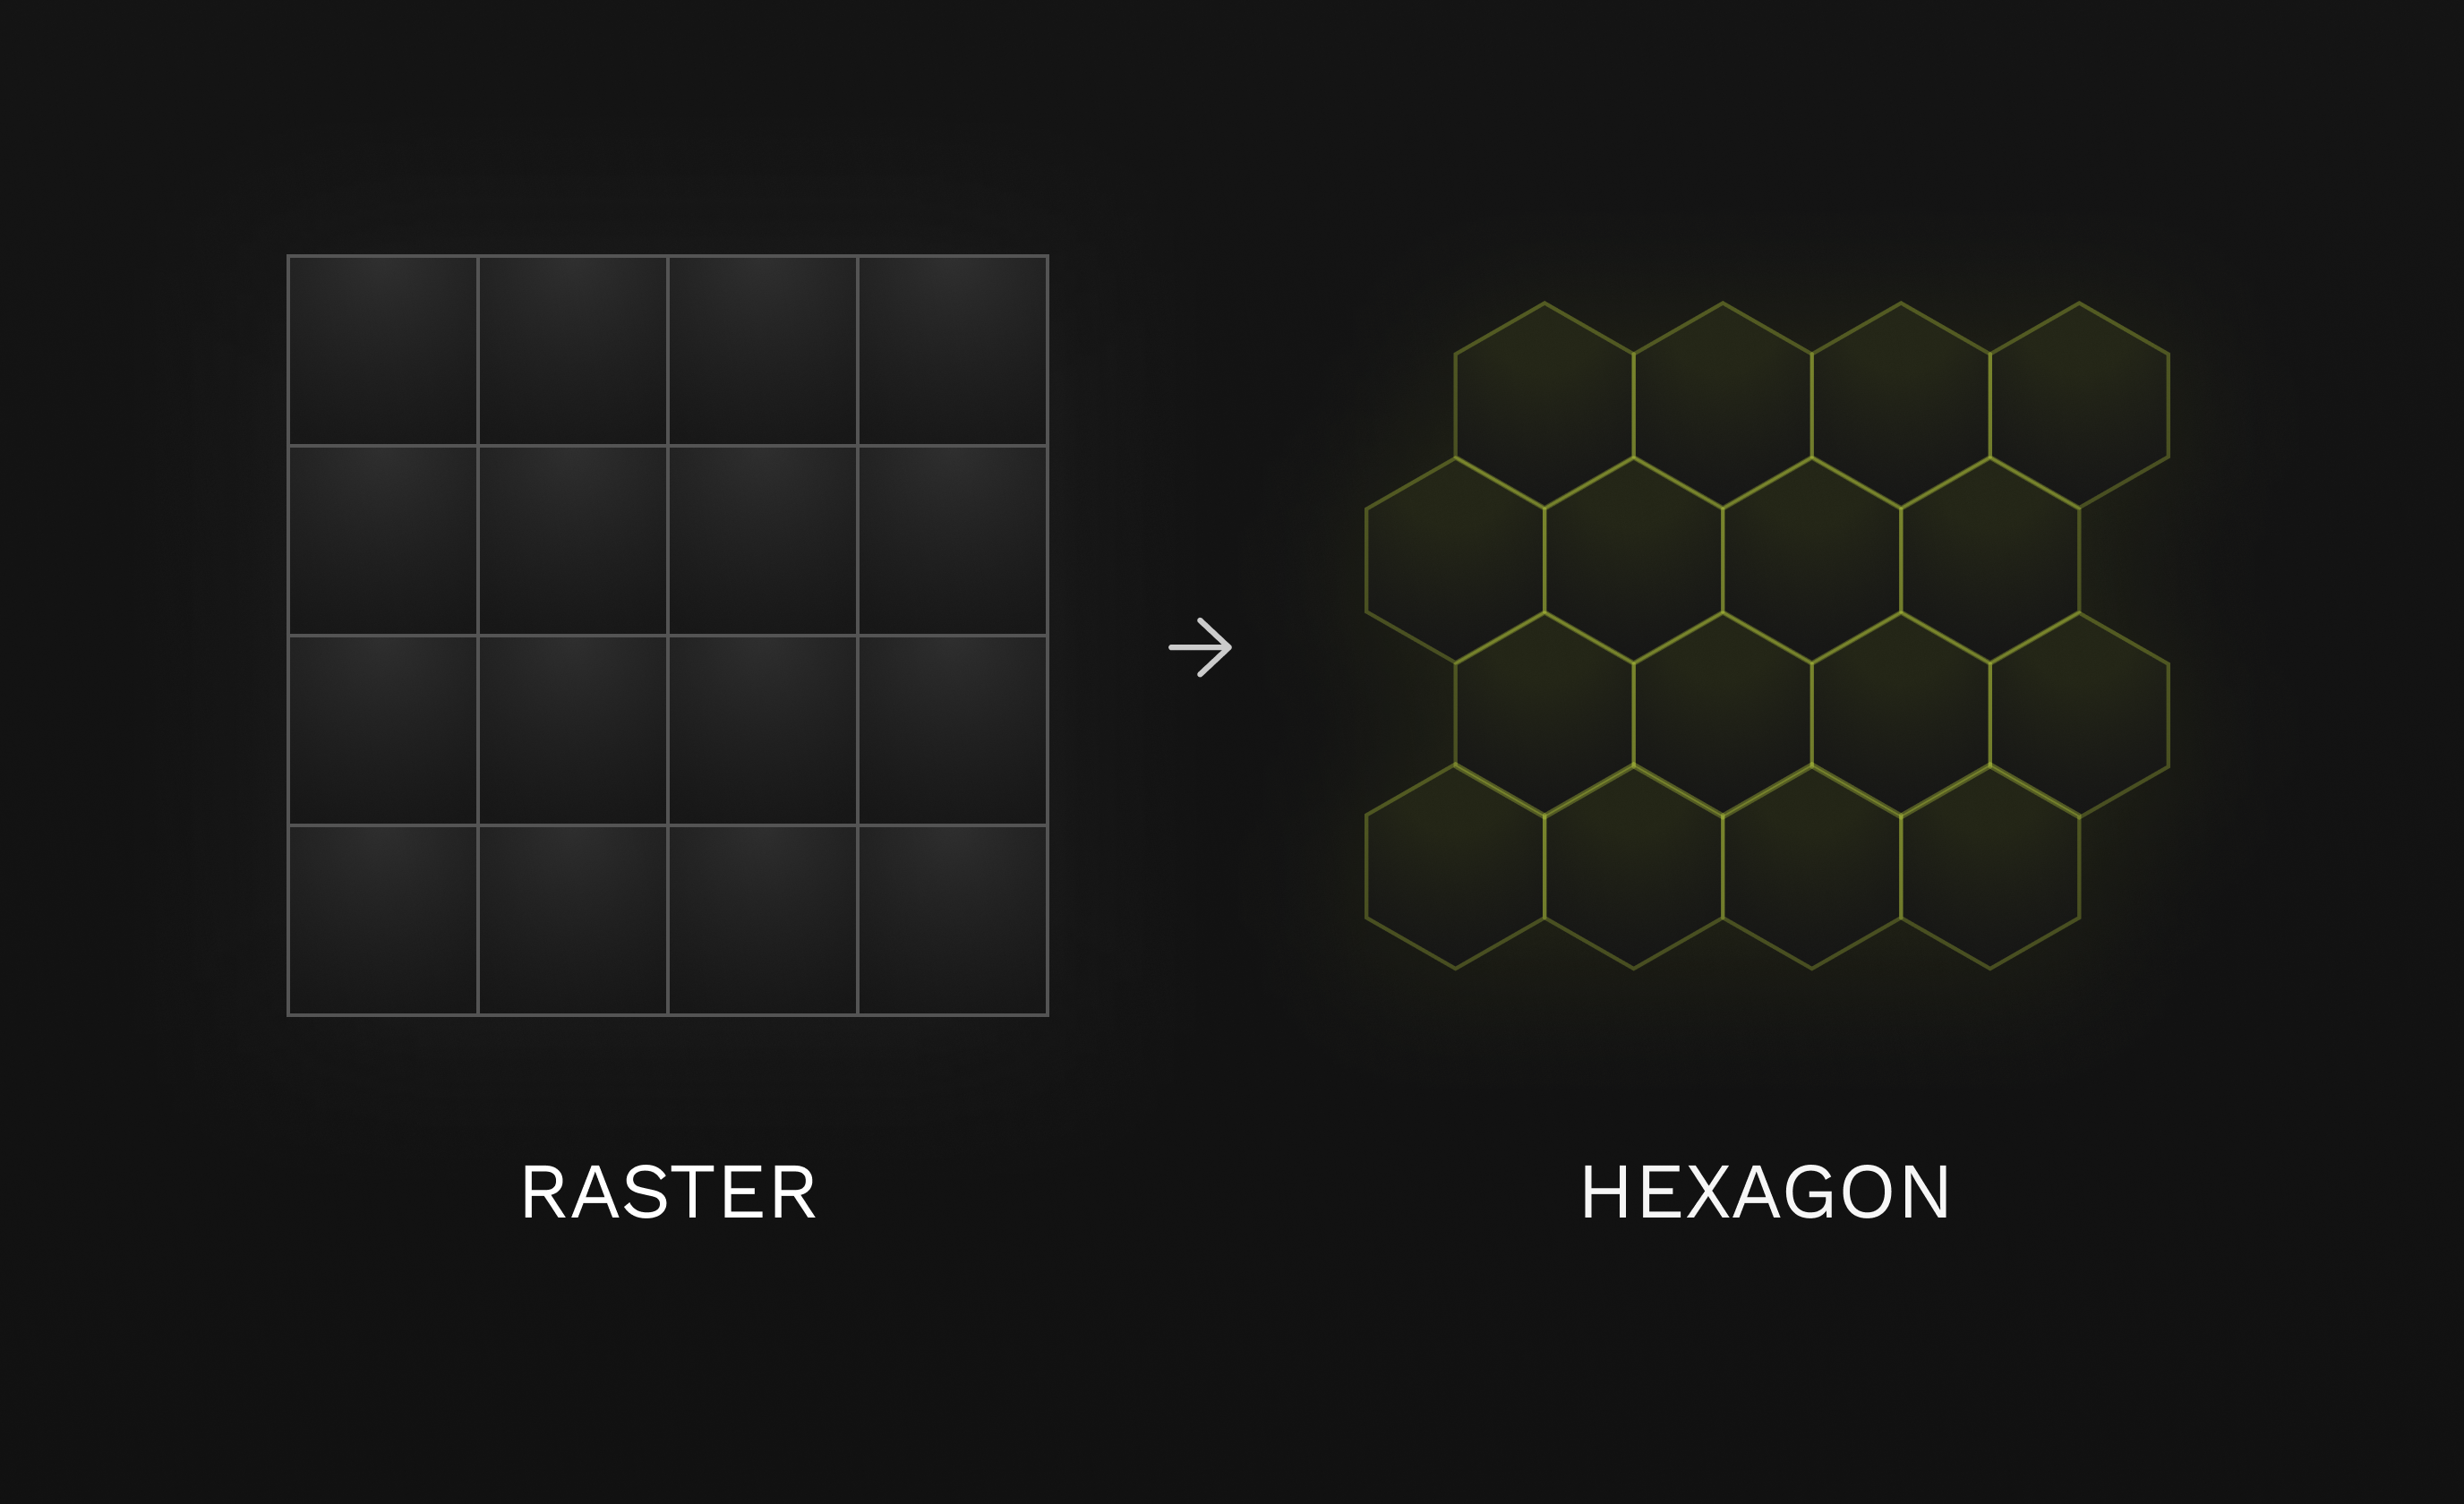
Raster to Hexagon
Transforming raster data into H3 cells
When to use
Transforming raster data into H3 cells is useful when you need to:
- Want to have spatial statistics about a raster (heatmap like visualization)
- A fast way to run statistics across different disparate datasets by combining them all to hexagons
Code implementation
We've made a Public UDF Hexagonify_raster_from_url that you can use in your own UDFs or any workflow.
note
To call a public UDF you need to use the prefix UDF_ in front of the name.
This allows you to run this UDF without needing an environment setup on your account.
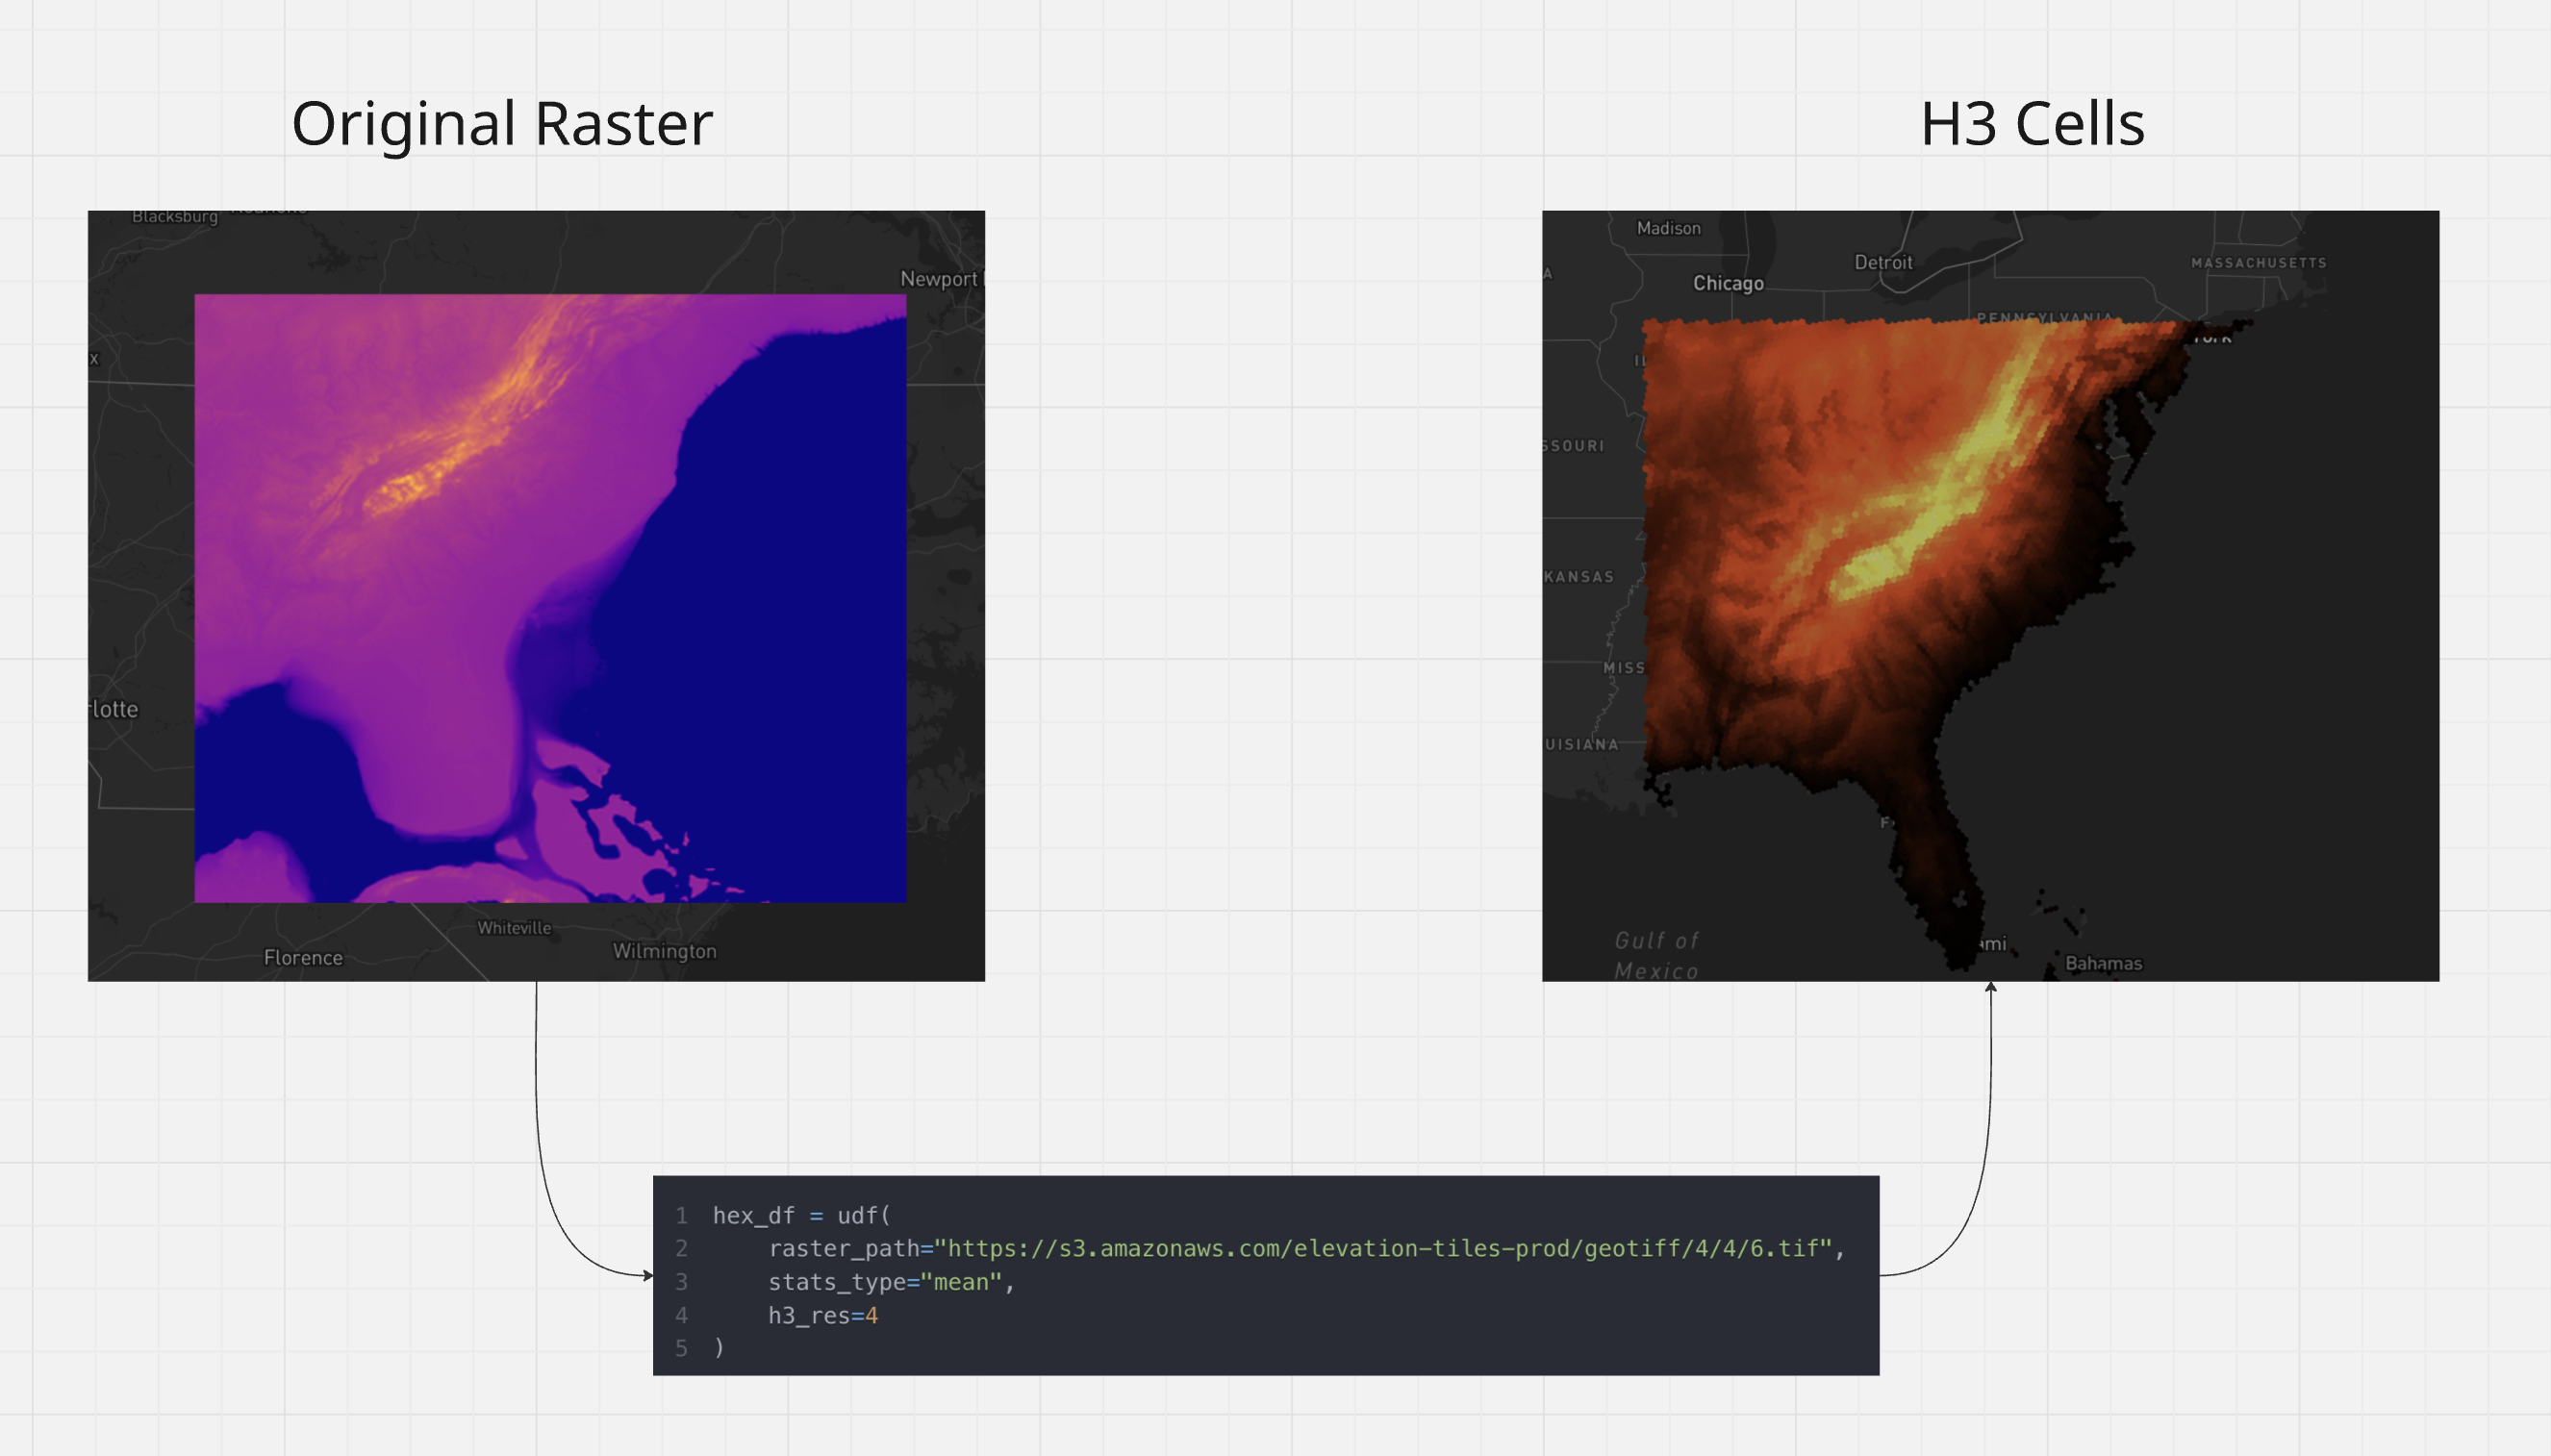
hex_df = fused.run(
    "UDF_Hexagonify_raster_from_url",
    raster_path="https://s3.amazonaws.com/elevation-tiles-prod/geotiff/4/4/6.tif",
    stats_type="mean",
    h3_res=4
)
Example application
- DEM_Tile_Hexify Public UDF.
- This UDF takes a Raster Tile from an open S3 bucket containing an elevation model and converts a tile into H3 on the fly