Aggregate
After ingesting a dataset to H3 hexagons it's possible to visualize it in Fused but we can also directly work with the data.
This page shows how to aggregate data at different resolutions or create derivative layers.
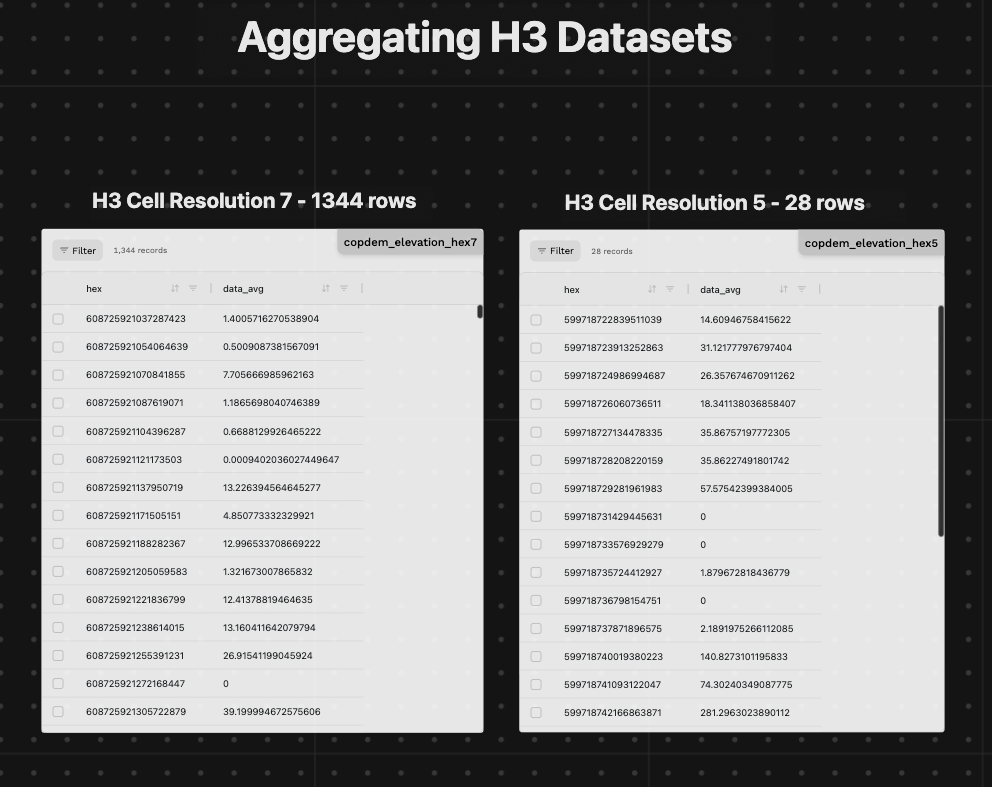
Example aggregating elevation data across the US at different H3 resolutions:
@fused.udf
def udf(
    bounds: fused.types.Bounds = [-74.556, 40.400, -73.374, 41.029],  # Default to full NYC
):
    path = "s3://fused-asset/hex/copernicus-dem-90m/"
    hex_reader = fused.load("https://github.com/fusedio/udfs/tree/8024b5c/community/joris/Read_H3_dataset/")

    df = hex_reader.read_h3_dataset(path, bounds, res=None) # res=None lets the hex_reader determine the resolution based on the current bounds

    return df
You can already use the h3_reader.read_h3_dataset and specify:
resat a specific resolutionvalueto filter on a specific value (especially for categorical data)
This reader uses DuckDB under the hood to read the data meaning you can write additional queries after reading the data as shown in creating derivative layers.
Aggregate at lower resolutions
H3 hexagons allow for aggregation at different resolutions. The ingestion process already creates different overviews at different H3 resolutions.
Numerical data
Example numerical values:
- Temperature
- Elevation
- Income
- Population
Aggregating means:
- Summing values (i.e. how many people live in a H3 cell in total)
- Taking mean / max / min / stddev (i.e. what is the average temperature in a H3 cell)
Example: Aggregating elevation across the US at different H3 levels
@fused.udf
def udf(
    bounds: fused.types.Bounds = [-74.556, 40.400, -73.374, 41.029],  # Default to full NYC
    res: int = 4, # Default to H3 resolution 4
):
    path = "s3://fused-asset/hex/copernicus-dem-90m/"
    hex_reader = fused.load("https://github.com/fusedio/udfs/tree/dd40354/community/joris/Read_H3_dataset/")
    df = hex_reader.read_h3_dataset(
        path,
        bounds,
        res=res
    )
    return df
Categorical data
Example categorical data:
- Land Use
- Crop Type
- Zone
Aggregating means:
- Counting values (i.e. how many different crop types are there in a H3 cell)
- Taking mode (i.e. what is the most common crop type in a H3 cell)
Example: Aggregating Corn yields across the US at different H3 levels
Expand for code
@fused.udf
def udf(
    bounds: fused.types.Bounds = [-127.54220803198237,10.667151173068717,-66.93703570835524,55.22298640160706],
    res: int = None,  # if left to None, hex_reader will determine resolution itself
    data_value: int = 1,  # 1=Corn in CDL for this example
    year: int = 2024,
):
    import h3.api.basic_int as h3
    path = f"s3://fused-asset/hex/cdls_v8/year={year}/"

    common = fused.load("https://github.com/fusedio/udfs/tree/6dd2c4e/public/common/")
    hex_reader = fused.load("https://github.com/fusedio/udfs/tree/f2b3909/community/joris/Read_H3_dataset/")

    # Read all hexagons where the CDL value matches the requested data class (e.g. Corn)
    df = hex_reader.read_h3_dataset(path, bounds, res=res, value=data_value)
    print(df.T)

    if 'pct' not in df.columns:
        # Dynamically compute the % of each hex covered by the specified crop type
        data_res = h3.get_resolution(df["hex"].iloc[0])
        print(f"{data_res=}")

        con = common.duckdb_connect()
        df = con.query(f"""
            SELECT
                hex,
                SUM(area) as total_area,
                ANY_VALUE(data) as data,
                h3_get_hexagon_area_avg({data_res}, 'm^2') as hex_area,
                (SUM(area) / h3_get_hexagon_area_avg({data_res}, 'm^2')) * 100 as pct
            FROM df
            WHERE data == {data_value}
            GROUP BY hex
        """).to_df()

    print(df.shape)
    if df.shape[0] > 0:
        return df
    else:
        return None
Derivative layers
You can also create derivative layers by writing custom logic after reading data using the h3_reader.read_h3_dataset
Example: Calculating slope from elevation
Expand for code
@fused.udf
def udf(
    bounds: fused.types.Bounds = [-74.556, 40.400, -73.374, 41.029],  # Default to full NYC
):
    path = "s3://fused-asset/hex/copernicus-dem-90m/"

    hex_reader = fused.load("https://github.com/fusedio/udfs/tree/8024b5c/community/joris/Read_H3_dataset/")
    df = hex_reader.read_h3_dataset(path, bounds, res=None)

    # Slope calculation using h3_grid_ring
    common = fused.load("https://github.com/fusedio/udfs/tree/5b11e17/public/common/")
    con = common.duckdb_connect()
    qr = f"""
    WITH hex_neighbors AS (
        SELECT
            h1.hex AS hex,
            h1.data_avg AS elevation,
            UNNEST(h3_grid_ring(h1.hex, 1)) AS neighbor_hex
        FROM df h1       -- Notice that DuckDB allows you to directly call the dataframe by its name
    ),
    neighbor_data AS (
        SELECT
            n.hex,
            n.elevation,
            n.neighbor_hex,
            df2.data_avg AS neighbor_elevation,
            h3_get_hexagon_edge_length_avg(h3_get_resolution(n.hex), 'm') AS edge_length_m
        FROM hex_neighbors n
        JOIN df df2 ON n.neighbor_hex = df2.hex
    ),
    calculations AS (
        SELECT
            hex,
            elevation,
            DEGREES(ATAN(ABS(elevation - neighbor_elevation) / edge_length_m)) AS slope_deg
        FROM neighbor_data
    ),
    slope_aggregated AS (
        SELECT
            hex,
            elevation,
            AVG(slope_deg) * 100 AS avg_slope_deg,
            MAX(slope_deg) * 100 AS max_slope_deg
        FROM calculations
        GROUP BY hex, elevation
    )
    SELECT
        s.hex,
        ROUND(s.elevation, 2) AS elevation,
        ROUND(s.avg_slope_deg, 2) AS avg_slope_deg,
        ROUND(s.max_slope_deg, 2) AS max_slope_deg
    FROM slope_aggregated s;
    """
    processed_df = con.execute(qr).df()

    print(processed_df.describe())

    return processed_df