Search PDFs, Turn Tables into DataFrames
This tutorial will show you how to:
- Search for PDFs online directly in Fused
- Turn tables in PDFs into DataFrames
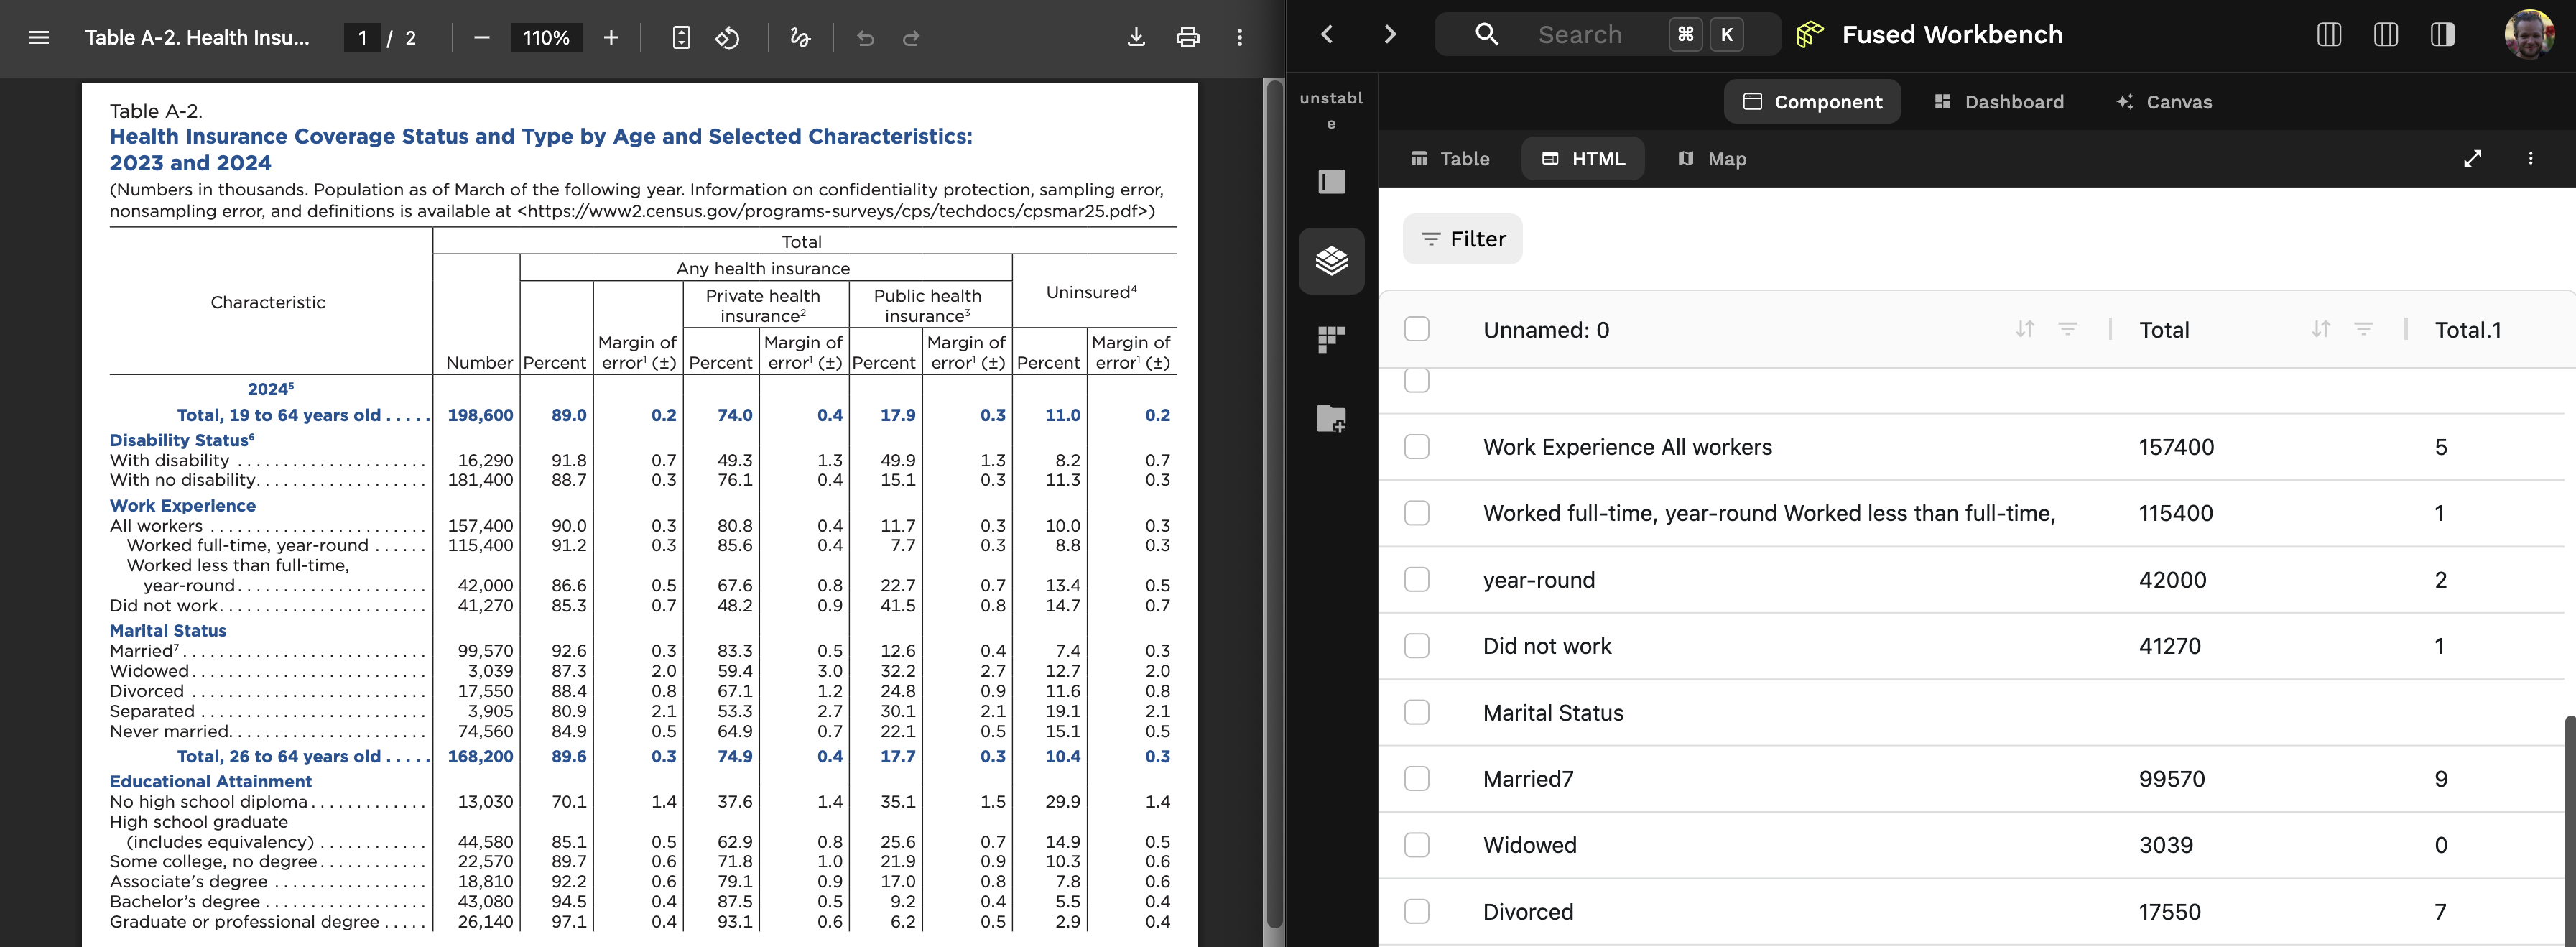
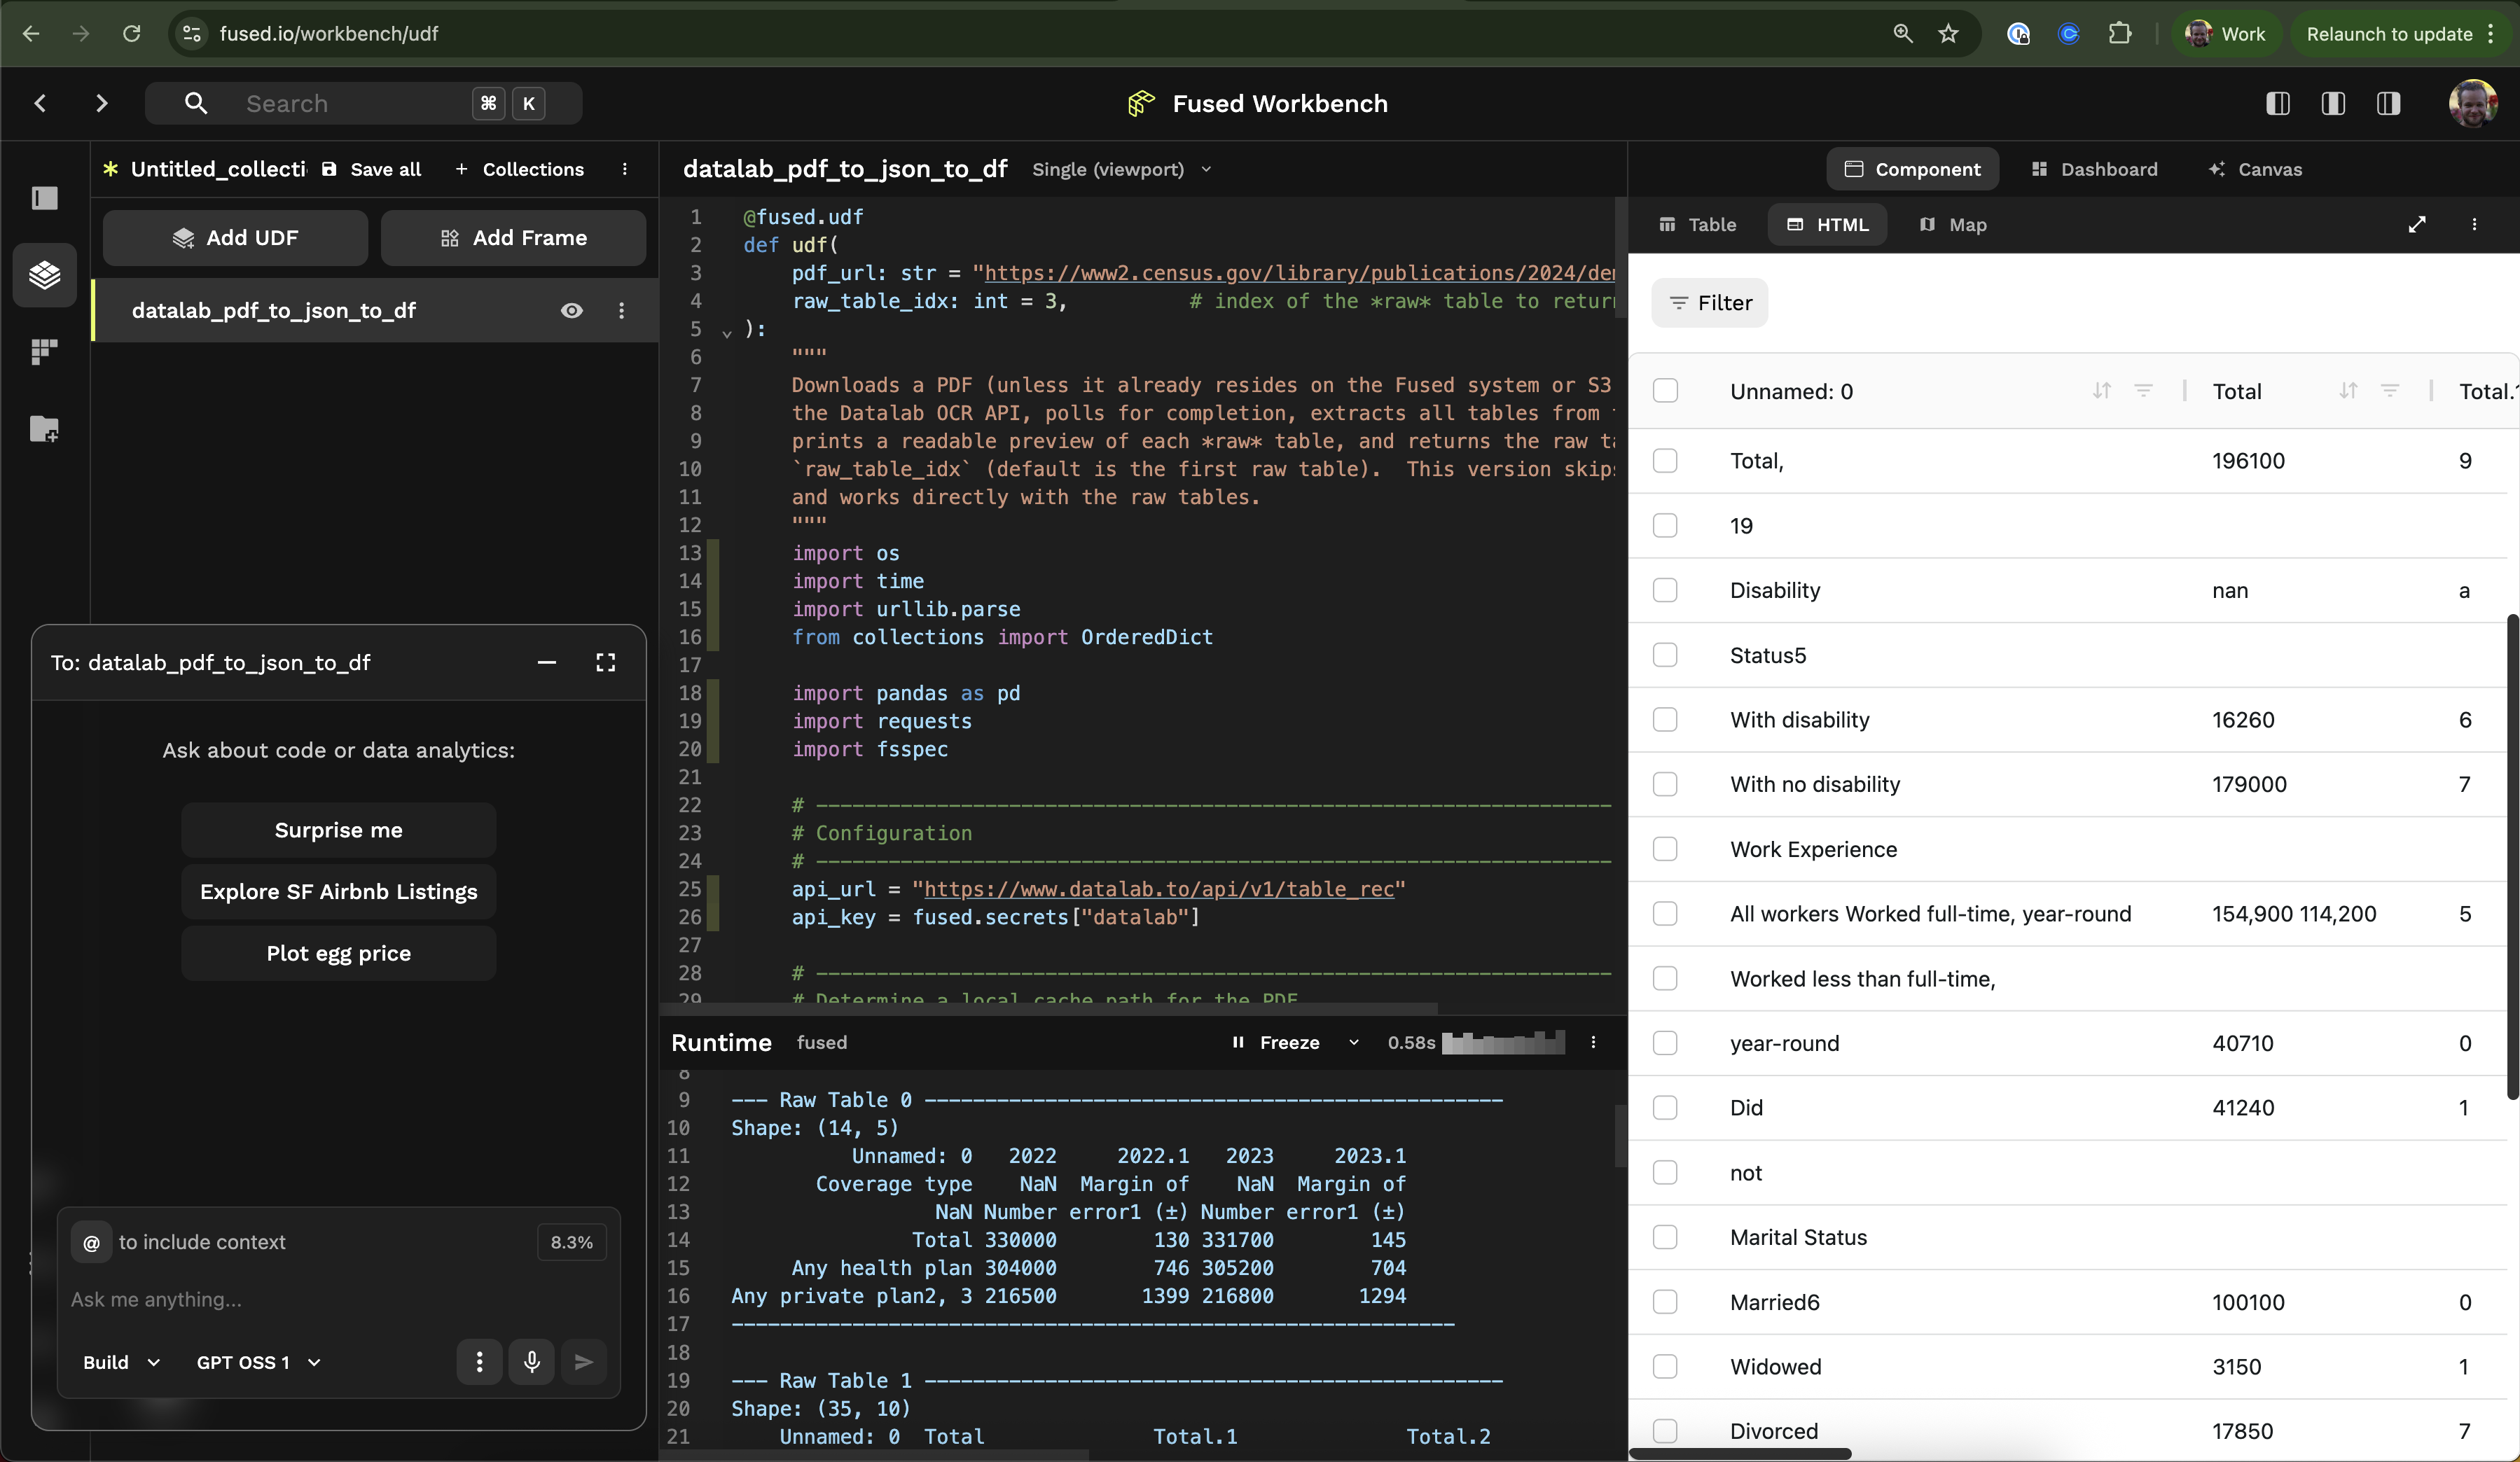
Left: Original PDF. Right: DataFrame of PDF in Workbench
Try out a hosted app for yourself:
Searching for PDFs
You can search for PDFs directly in Fused:
Search for any PDFs from Census data that would provide me health insurance coverage & type by age.
I want the data to be available in a table format.
The AI Assistant will provide a list of links to PDFs that are as close to your request as possible:
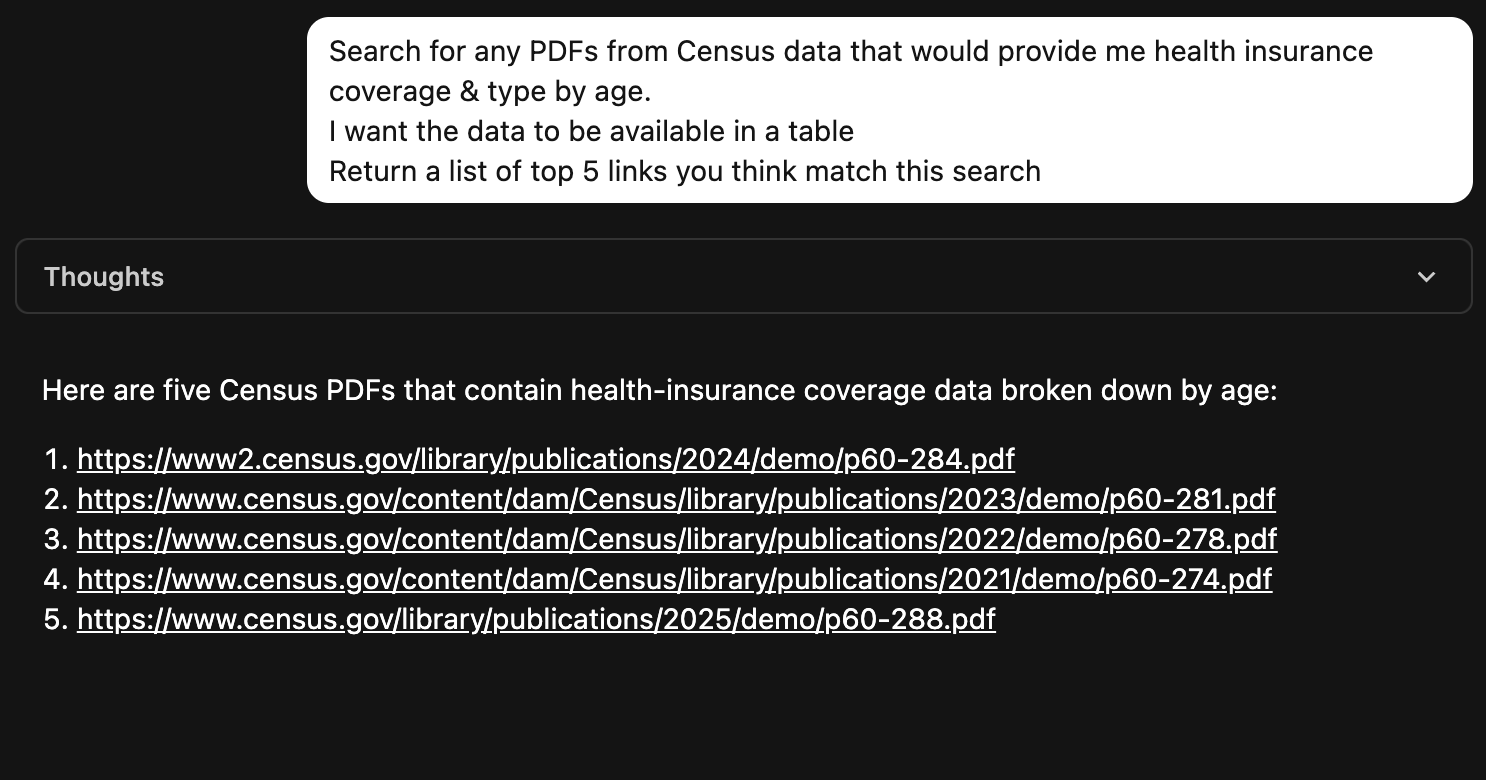
In its current stage we recommend you explore the PDFs for yourself to see which one matches your request best.
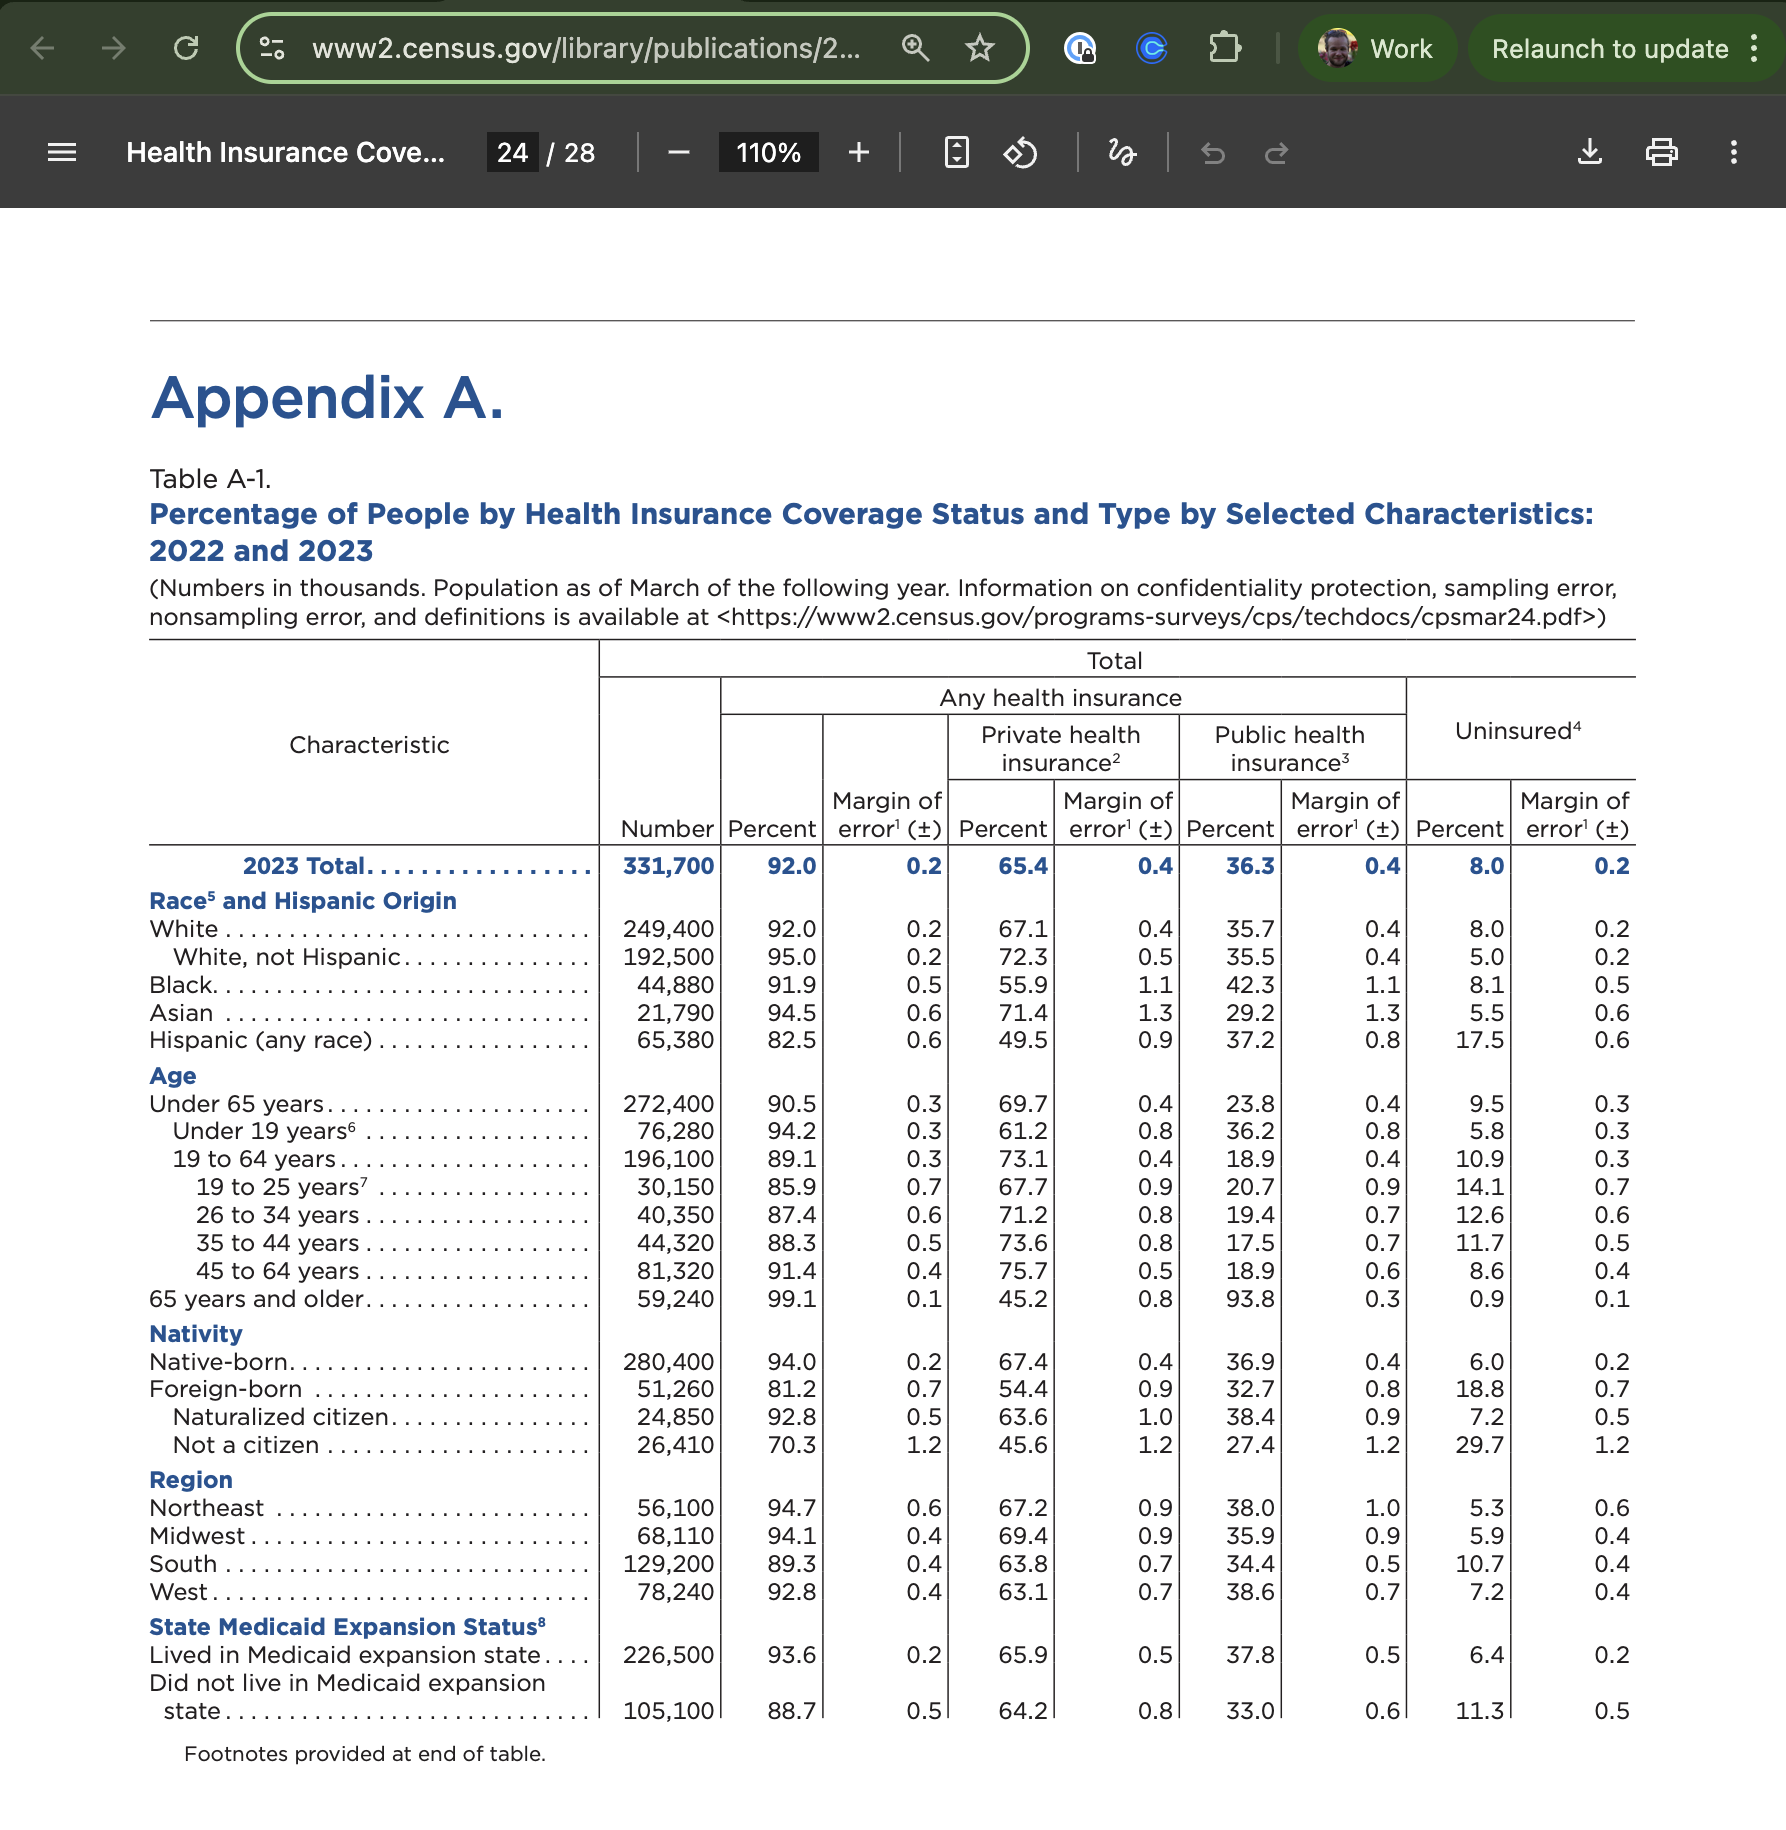
The first link, pointing to Census .gov data seems to match our request. Opening it and going to the Appendix we find what we're looking for:
Turning PDF Tables in DataFrames
Next:
- Use the Datalab API to turn a PDF into a JSON
- Write a UDF that turns the JSON into a DataFrame
Using a preexisting UDF
We built a UDF on top of the Datalab API that you can directly use:
# in a notebook
import fused

df = fused.run(
    "fsh_1IH3QxpoAIEz9qtUChfqtS",
    pdf_url="https://www2.census.gov/library/publications/2024/demo/p60-284.pdf",
    raw_table_idx=0
)

print(df)
This will not return the table we're looking for. This is a simple UDF that returns each table found in the JSON from DataLab as a DataFrame
The print message will however show us all the available tables found:
--- Raw Table 0 ------------------------------------------------
Shape: (14, 5)
          Unnamed: 0   2022     2022.1   2023     2023.1
       Coverage type    NaN  Margin of    NaN  Margin of
                 NaN Number error1 (±) Number error1 (±)
               Total 330000        130 331700        145
     Any health plan 304000        746 305200        704
Any private plan2, 3 216500       1399 216800       1294
------------------------------------------------------------

--- Raw Table 1 ------------------------------------------------
Shape: (35, 10)
    Unnamed: 0  Total              Total.1              Total.2              Total.3              Total.4              Total.5              Total.6     Total.7 Unnamed: 9
           NaN    NaN Any health insurance Any health insurance Any health insurance Any health insurance Any health insurance Any health insurance         NaN        NaN
Characteristic    NaN                  NaN                  NaN                  NaN       Private health                  NaN        Public health  Uninsured4 Uninsured4
           NaN    NaN                  NaN                  NaN                  NaN           insurance2                  NaN           insurance3  Uninsured4 Uninsured4
           NaN    NaN                  NaN            Margin of                  NaN            Margin of                  NaN            Margin of         NaN  Margin of
           NaN Number              Percent           error1 (±)              Percent               error1          (±) Percent               error1 (±) Percent error1 (±)
------------------------------------------------------------

--- Raw Table 2 ------------------------------------------------
Shape: (35, 11)
    Unnamed: 0  Total Total.1    Total.2 Total.3              Total.4       Total.5       Total.6     Total.7 Unnamed: 9  Unnamed: 10
           NaN    NaN     NaN        NaN     NaN Any health insurance           NaN           NaN         NaN        NaN          NaN
Characteristic    NaN     NaN        NaN     NaN       Private health Public health Public health  Uninsured4 Uninsured4          NaN
           NaN    NaN     NaN        NaN     NaN           insurance2           NaN    insurance3  insurance3        NaN          NaN
           NaN    NaN     NaN  Margin of     NaN            Margin of           NaN     Margin of         NaN  Margin of          NaN
           NaN Number Percent error1 (±) Percent               error1   (±) Percent        error1 (±) Percent error1 (±)          NaN
------------------------------------------------------------

--- Raw Table 3 ------------------------------------------------
Shape: (29, 11)
    Unnamed: 0  Total              Total.1              Total.2              Total.3              Total.4              Total.5              Total.6     Total.7 Unnamed: 9  Unnamed: 10
           NaN    NaN Any health insurance Any health insurance Any health insurance Any health insurance Any health insurance Any health insurance         NaN        NaN          NaN
Characteristic    NaN                  NaN                  NaN                  NaN       Private health        Public health        Public health  Uninsured4 Uninsured4          NaN
           NaN    NaN                  NaN                  NaN                  NaN           insurance2                  NaN           insurance3  insurance3        NaN          NaN
           NaN    NaN                  NaN            Margin of                  NaN            Margin of                  NaN            Margin of         NaN  Margin of          NaN
           NaN Number              Percent           error1 (±)              Percent               error1          (±) Percent               error1 (±) Percent error1 (±)          NaN
------------------------------------------------------------

--- Raw Table 4 ------------------------------------------------
Shape: (30, 11)
    Unnamed: 0                Total              Total.1              Total.2              Total.3              Total.4              Total.5       Total.6     Total.7    Total.8  Unnamed: 10
           NaN Any health insurance Any health insurance Any health insurance Any health insurance Any health insurance Any health insurance           NaN         NaN        NaN          NaN
           NaN                  NaN                  NaN                  NaN                  NaN       Private health                  NaN Public health  Uninsured4 Uninsured4          NaN
Characteristic                  NaN                  NaN                  NaN                  NaN           insurance2                  NaN    insurance3  insurance3        NaN          NaN
           NaN                  NaN                  NaN            Margin of                  NaN            Margin of                  NaN     Margin of         NaN  Margin of          NaN
           NaN               Number              Percent           error1 (±)              Percent               error1          (±) Percent        error1 (±) Percent error1 (±)          NaN
------------------------------------------------------------
It looks like the table 3 matches what we're looking for:
import fused

df = fused.run(
    "fsh_1IH3QxpoAIEz9qtUChfqtS",
    pdf_url="https://www2.census.gov/library/publications/2024/demo/p60-284.pdf",
    raw_table_idx=3 # Table 3, one matching our request
)

print(df)
Which returns the following DataFrame:
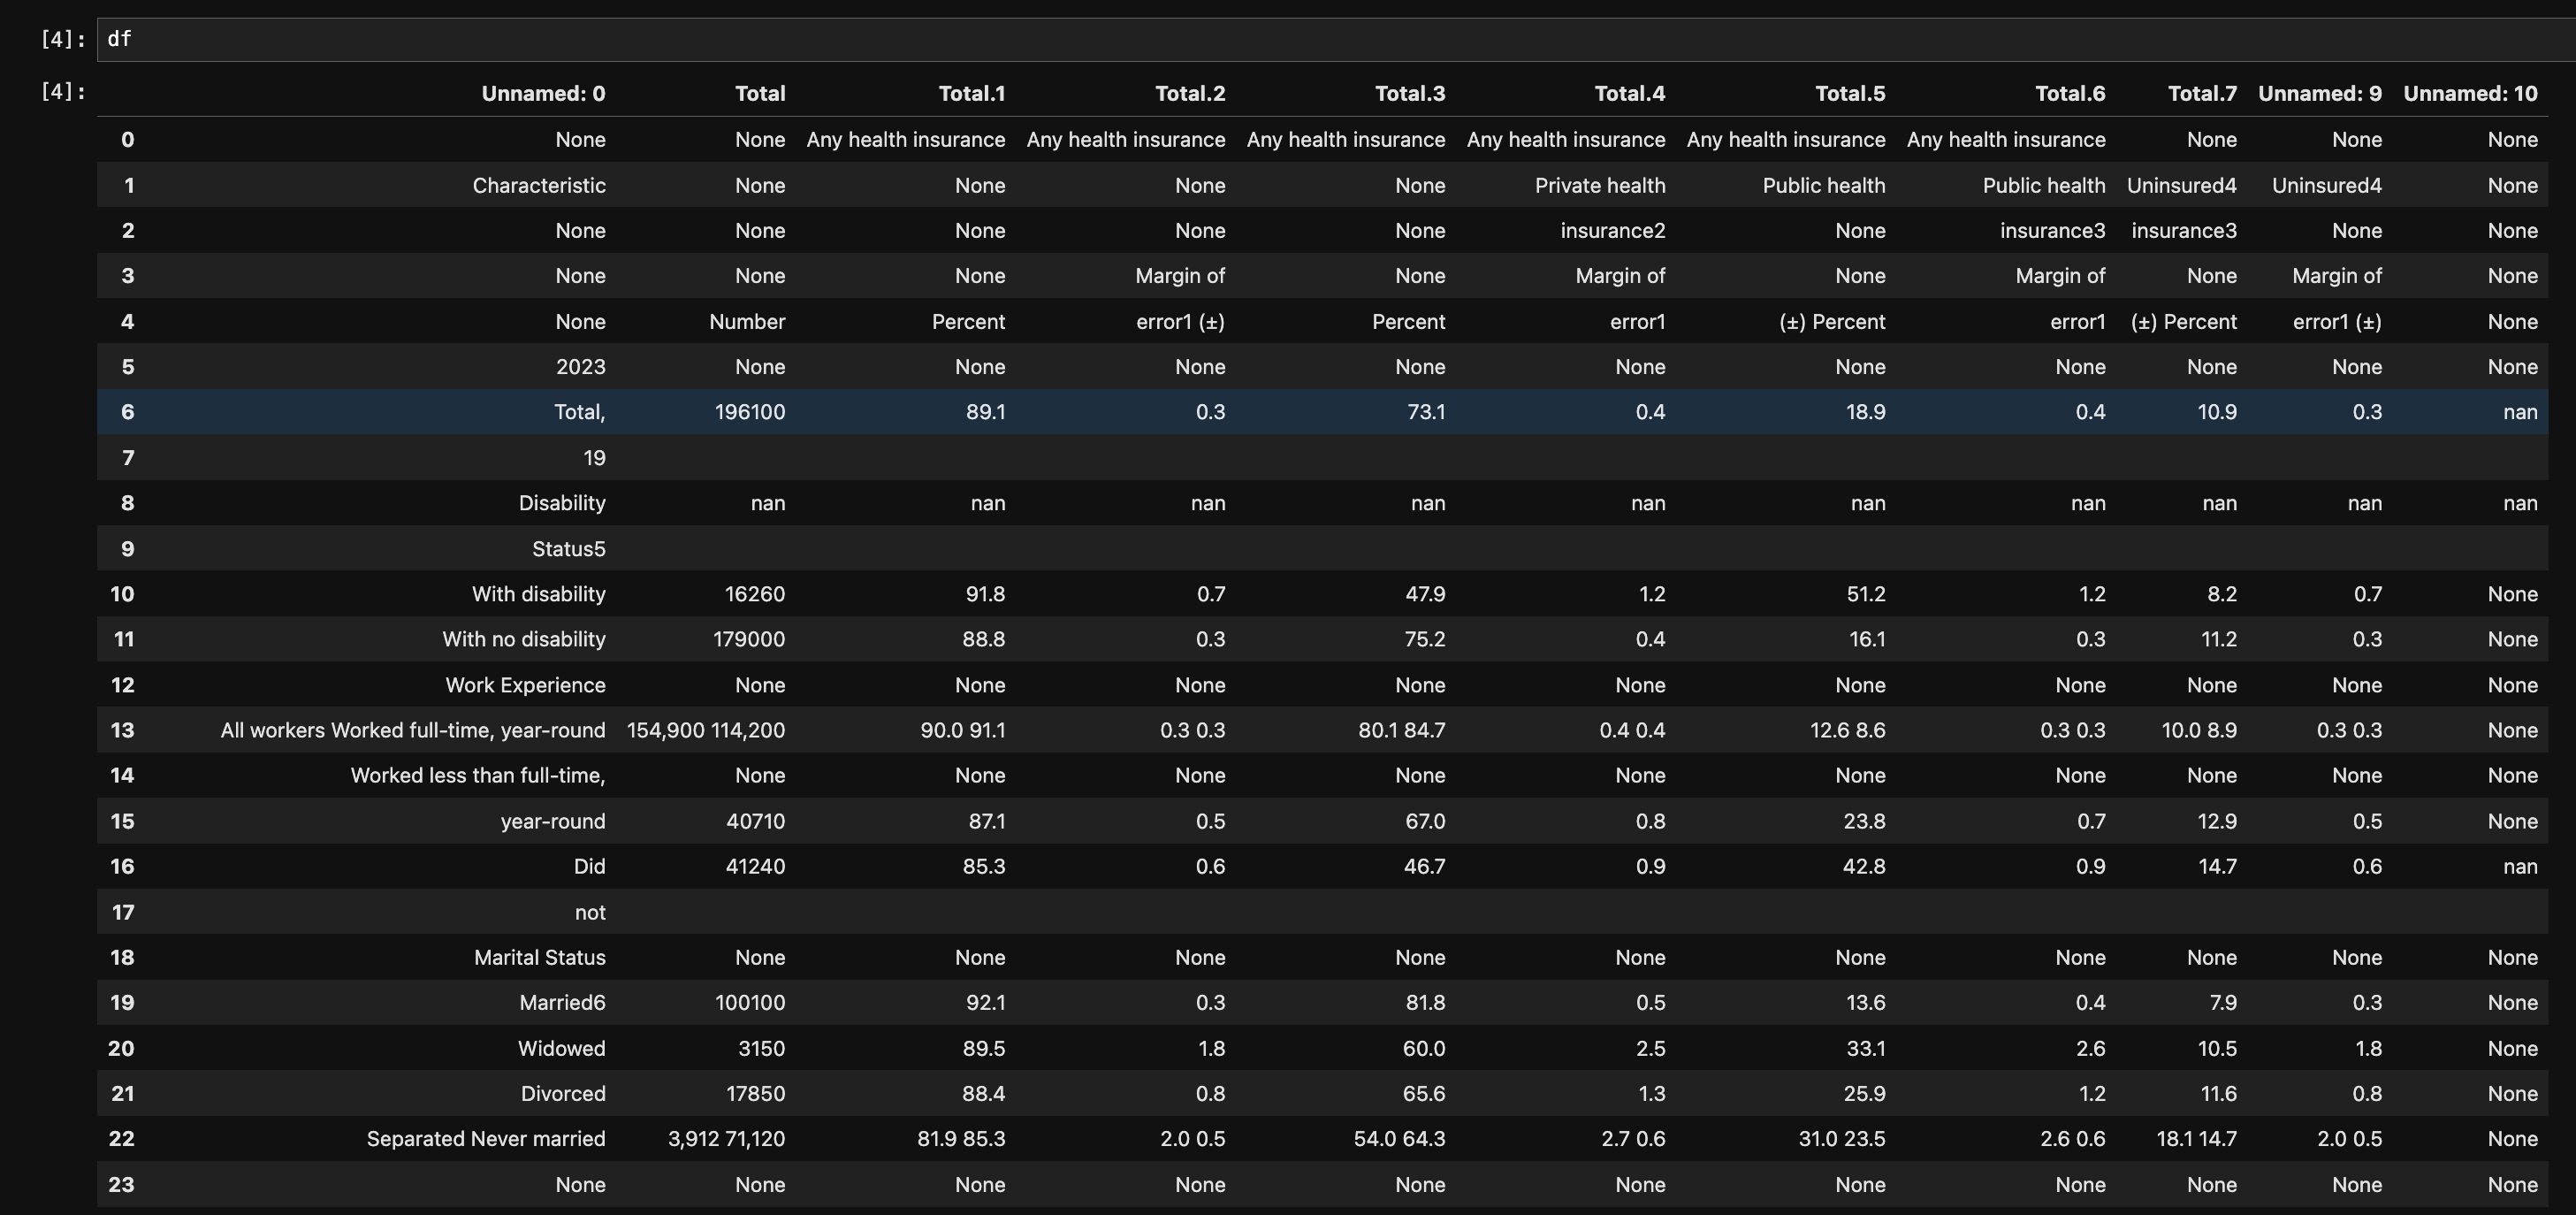
You may notice the table has some formatting issues. These can be fixed relatively easily by asking the AI Assistant to fix them.
Build it yourself
You can make a copy of the UDF from the UDF Explorer
You will need to:
- Setup an account on DataLab
- Get an API Key
- Add
datalabas a secret in the Preferences
And now you get edit this UDF for yourself:
Next Steps
Now that you have a DataFrame you can explore how to build on top:
- Ask AI to visualize the data
- See how to turn any of your UDFs into an API endpoint
- Let anyone talk to this data through MCP Servers