The App That Finds Your City's Rainfall Twin Globally

TL;DR Milind analyzes global precipitation patterns using H3 indexing, cosine similarity, and Earth Engine data to create an interactive rainfall comparison app.
This article explores a User Defined Function (UDF) that utilizes global precipitation data to compare rainfall patterns between different locations worldwide and then creates an interactive app!
Introduction
While we focus on rainfall, the approach can be applied to various parameters, potentially transforming fields from climate research to investment strategies. The UDF uses precipitation data and geospatial techniques to compare monthly rainfall averages globally, demonstrating how data analysis can uncover connections between distant locations. Let's dive into how this UDF works and its potential applications.
How It Works
Our UDF utilizes the following key components:
- Earth Engine API: To fetch global precipitation data
- H3 Index: For efficient spatial indexing
- DuckDB: For fast query execution on geospatial data
- Cosine Similarity: To compare rainfall vectors
The Workflow
- Data Aggregation with DuckDB: The data retrieval process is streamlined using Fused and Xarray:
-
Fused and Earth Engine: Fused simplifies access to Google Earth Engine's vast catalog. It provides a more intuitive and faster interface with a much better file manager for working with spatial data compared to the Earth Engine platform itself.
-
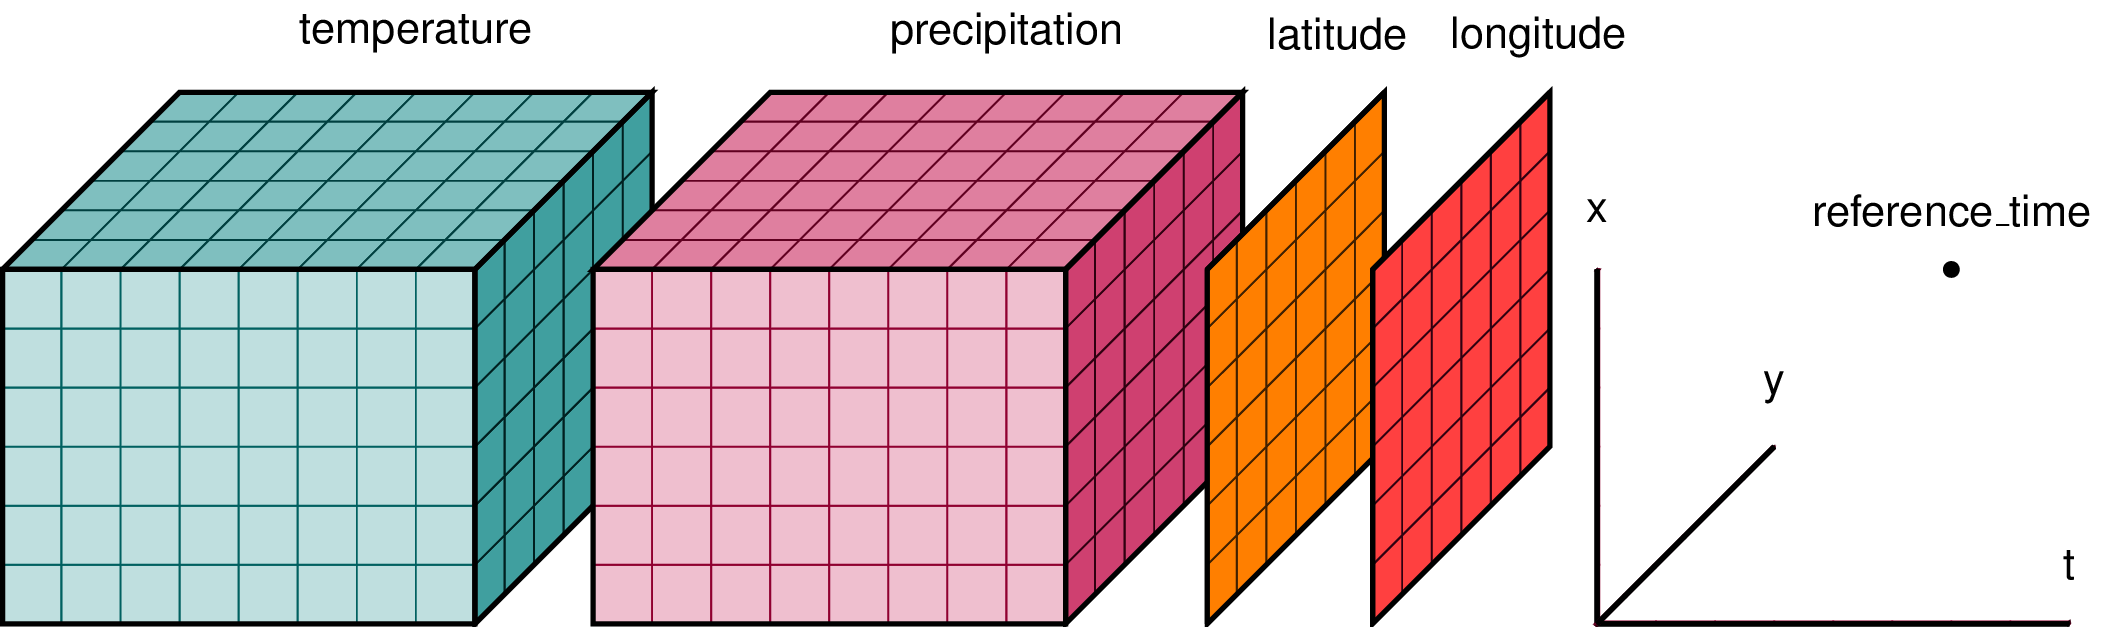
Xarray Integration: We use Xarray to work with our multi-dimensional rainfall data. It allows for easy handling of labeled arrays and datasets, particularly useful for time-series climate data.
-
- Data Aggregation with DuckDB: After retrieving the raw data, we use DuckDB to efficiently aggregate it. This involves:
- Grouping the data by H3 hexagon and month
- Calculating the average monthly rainfall for each hexagon
- Creating 12-element vectors representing annual rainfall patterns for each location
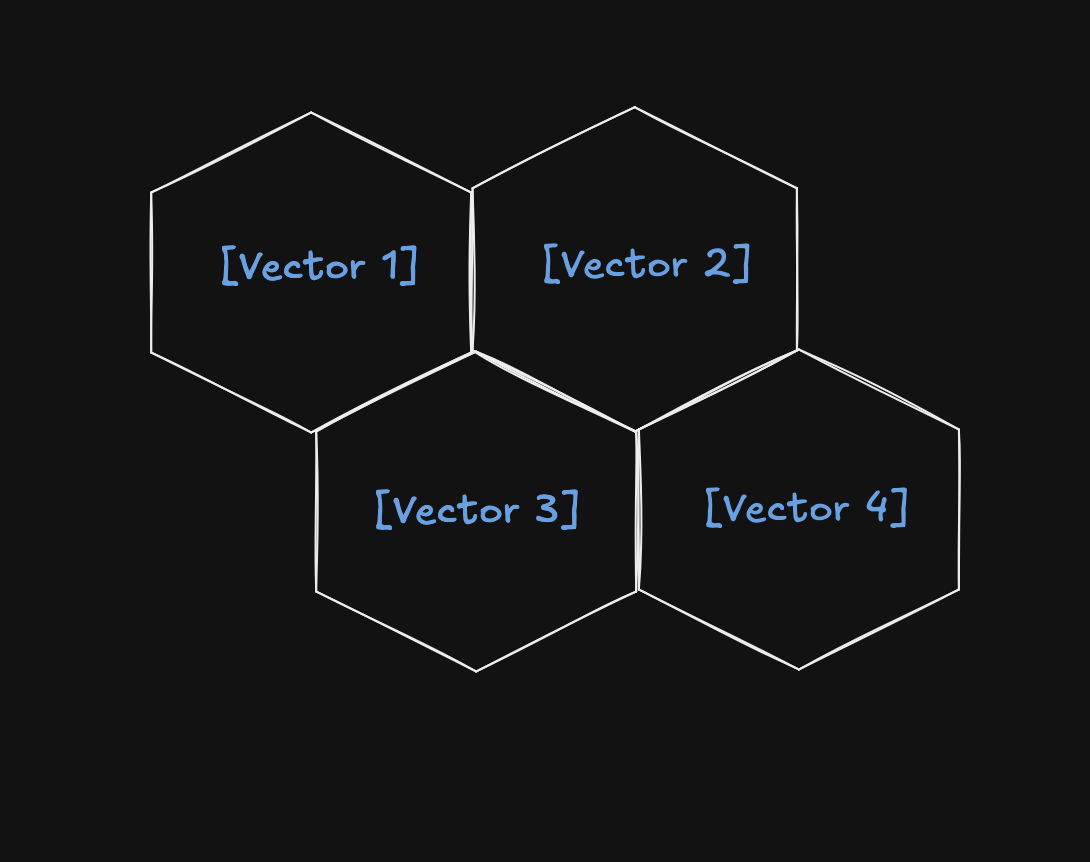
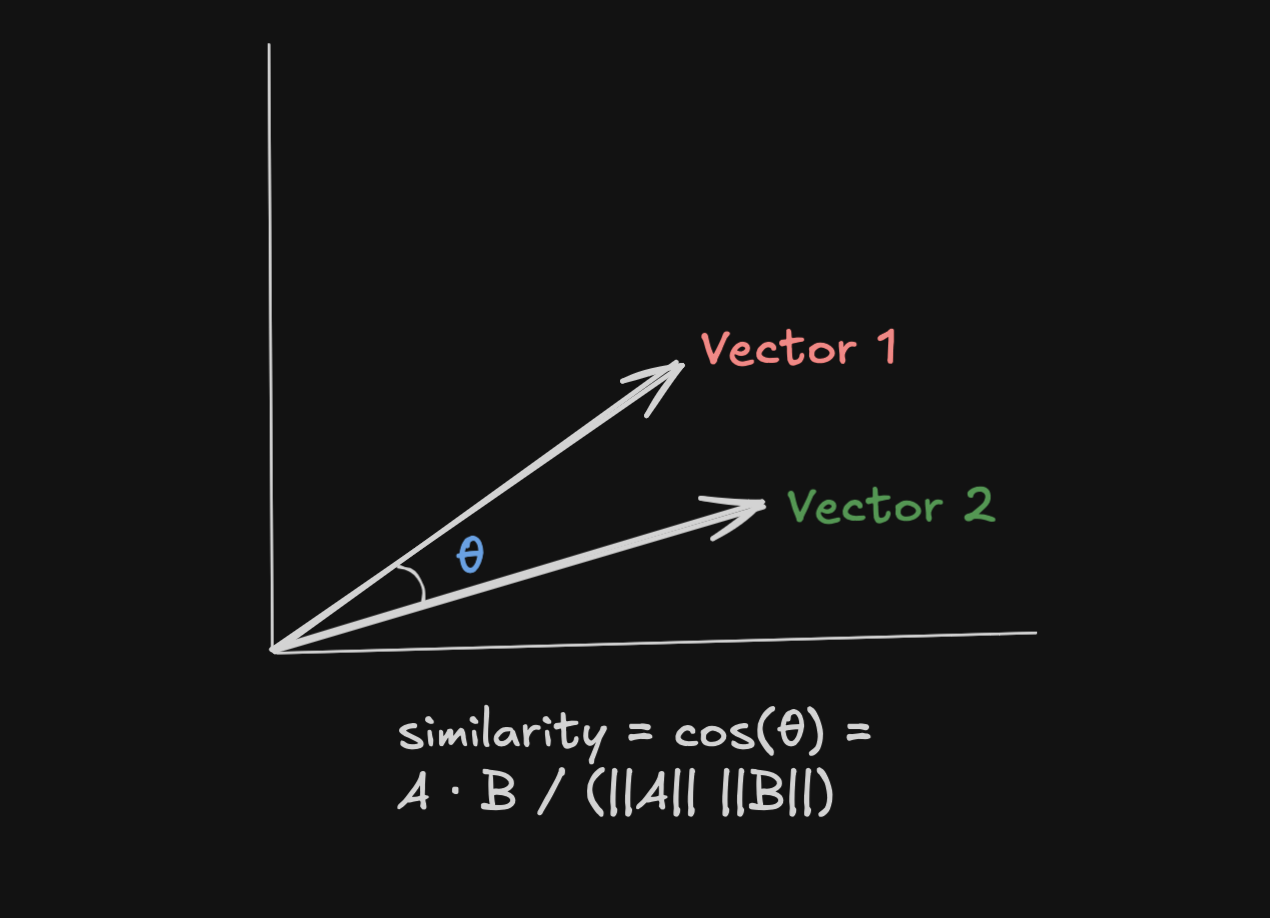
- Cosine Similarity Calculation: Finally, we use cosine similarity to compare these rainfall vectors. This allows us to quantify how similar the rainfall pattern of one location is to another, or a reference pattern.
- Converting UDF to an app with Fused App Builder: To make the rainfall similarity comparison UDF accessible and interactive, I used the Fused App Builder to help quickly build an app from the UDF that I just created. Every data scientists favourite prototyping tool is Streamlit which helps to build frontends in Python quickly and that's what the app builder brings to you! Convenience of Streamlit with the Power of Fused.
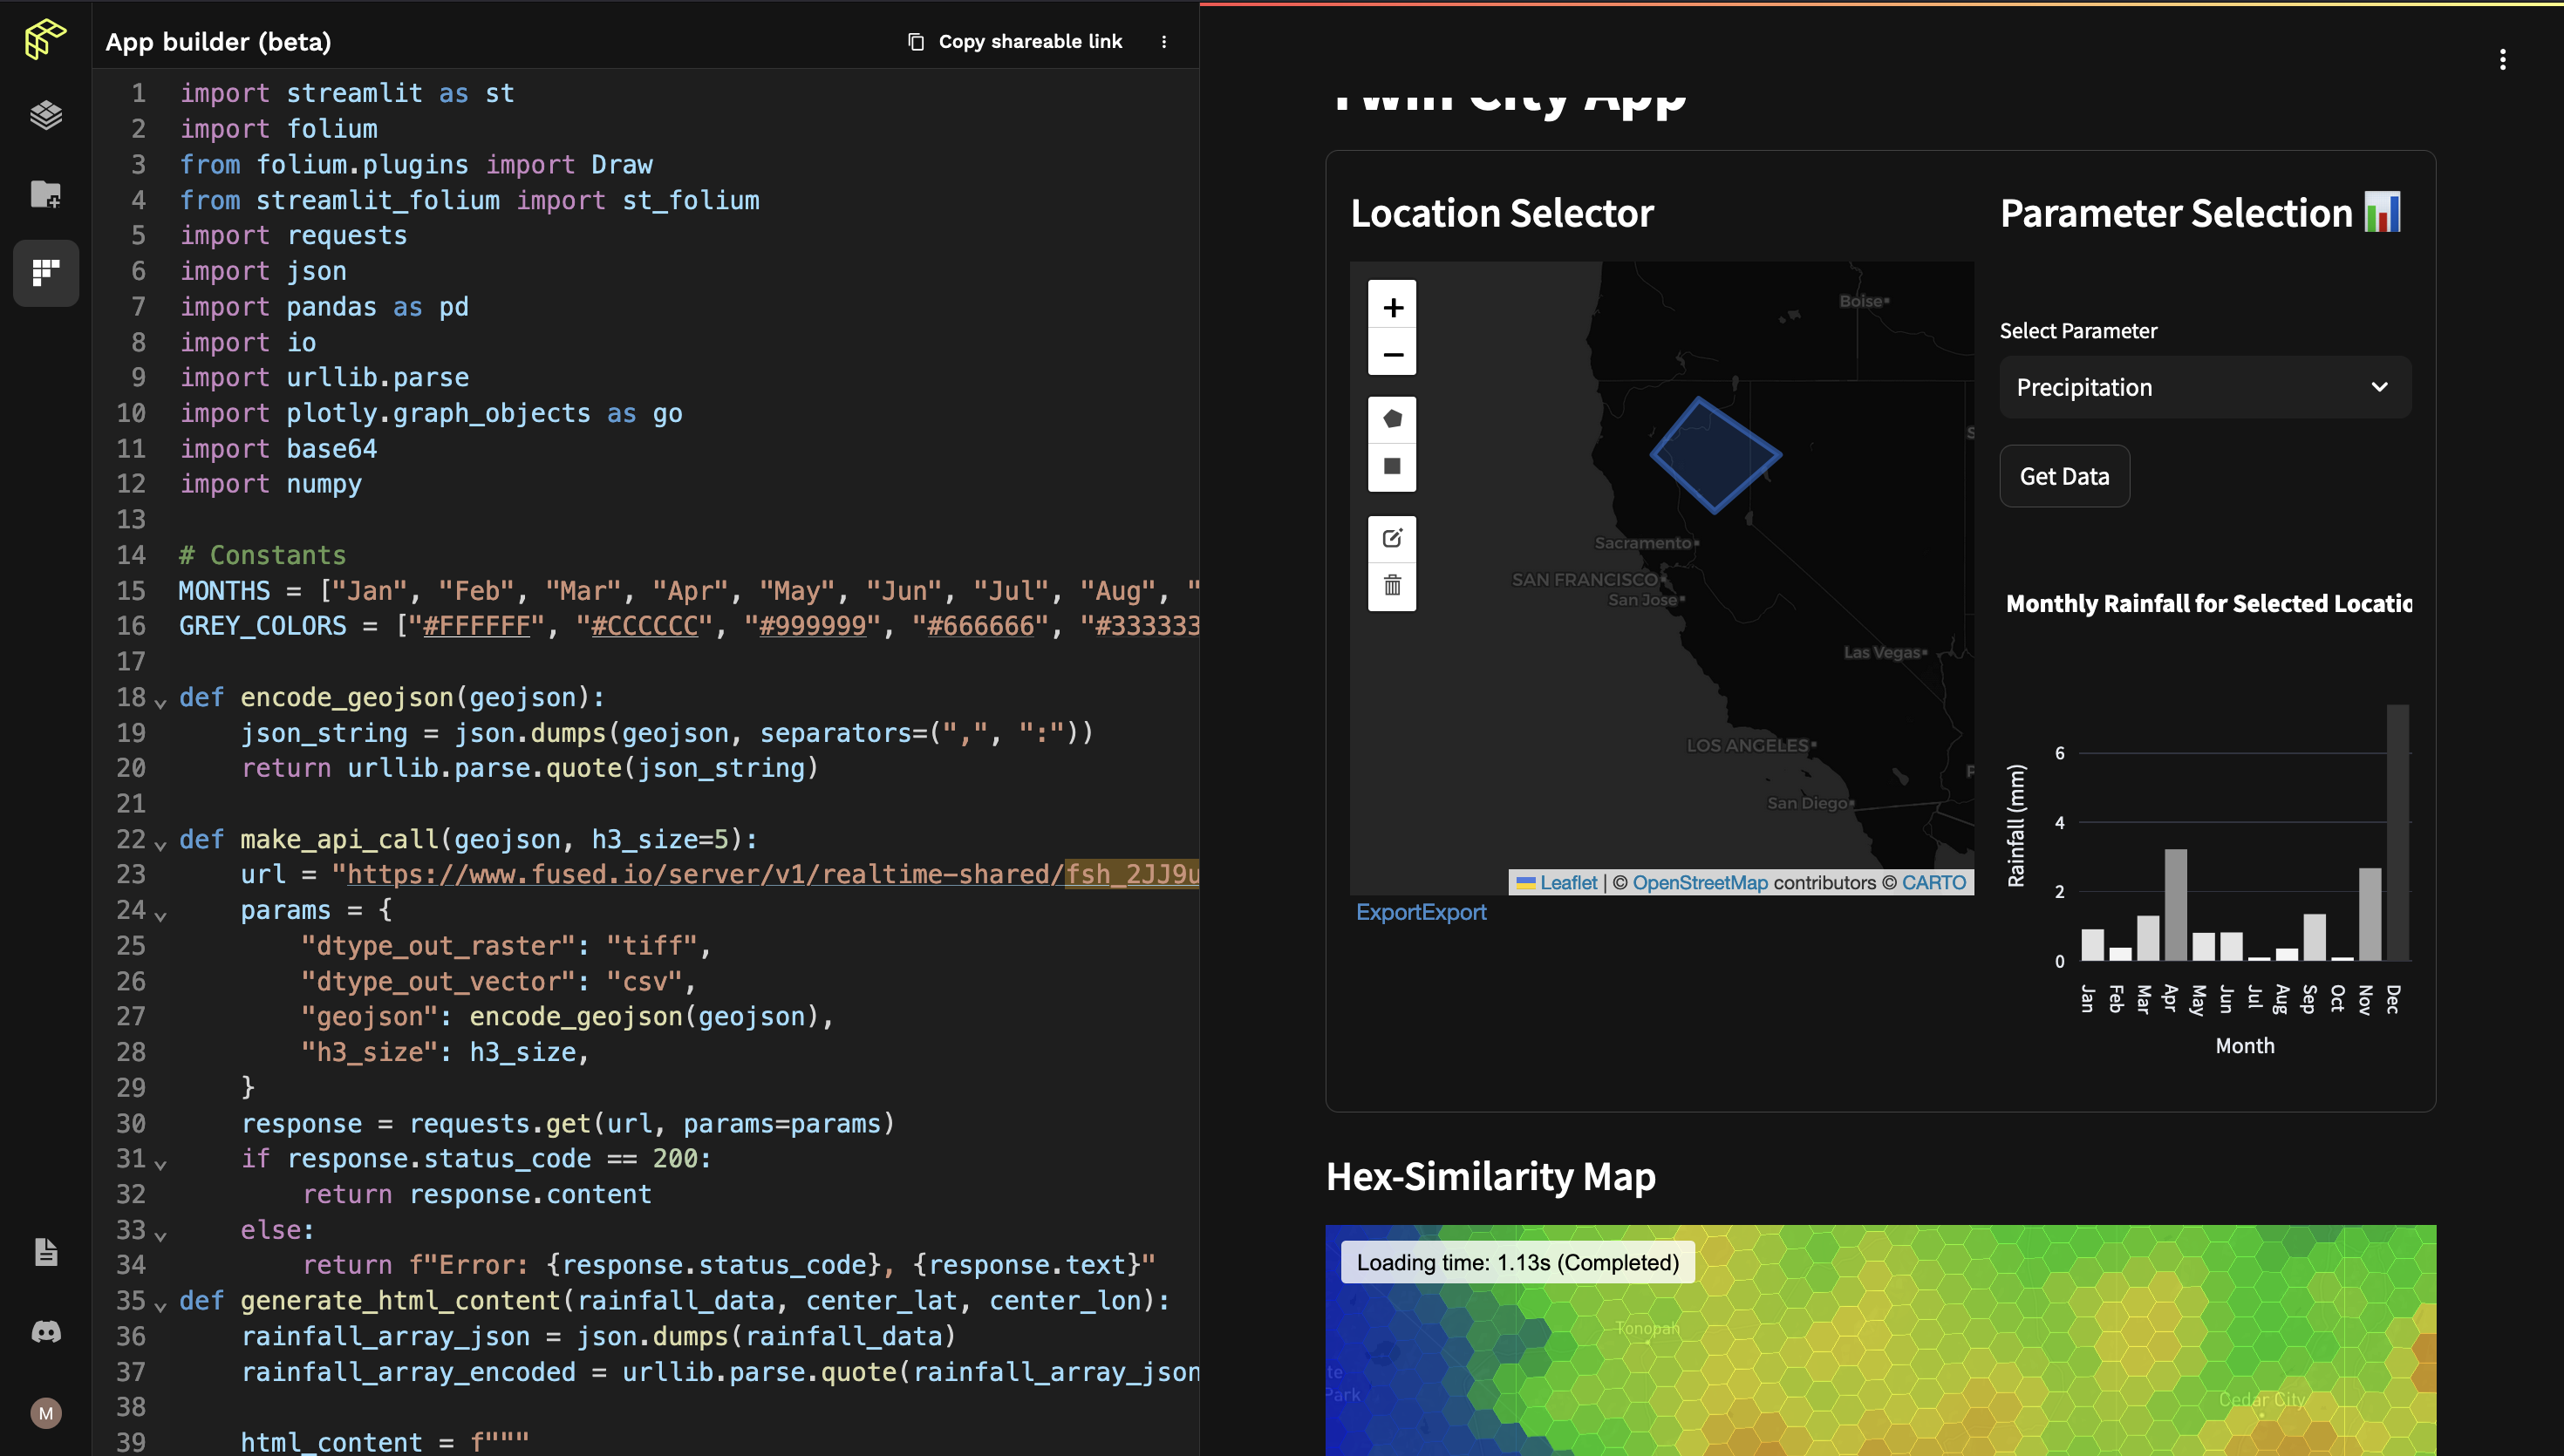
The App Builder
If you are familiar with Streamlit, it is super convenient to build UI from just Python code. Folium maps helped me build interactive maps where I can draw areas to compare with and I could also write a custom HTML-based iframe to integrate Mapbox GL within the app itself, the snippets of which again are available in the Fused documentation.
- Interactive Folium Map
I implemented a Streamlit Folium based map that allows users to select a location of interest.
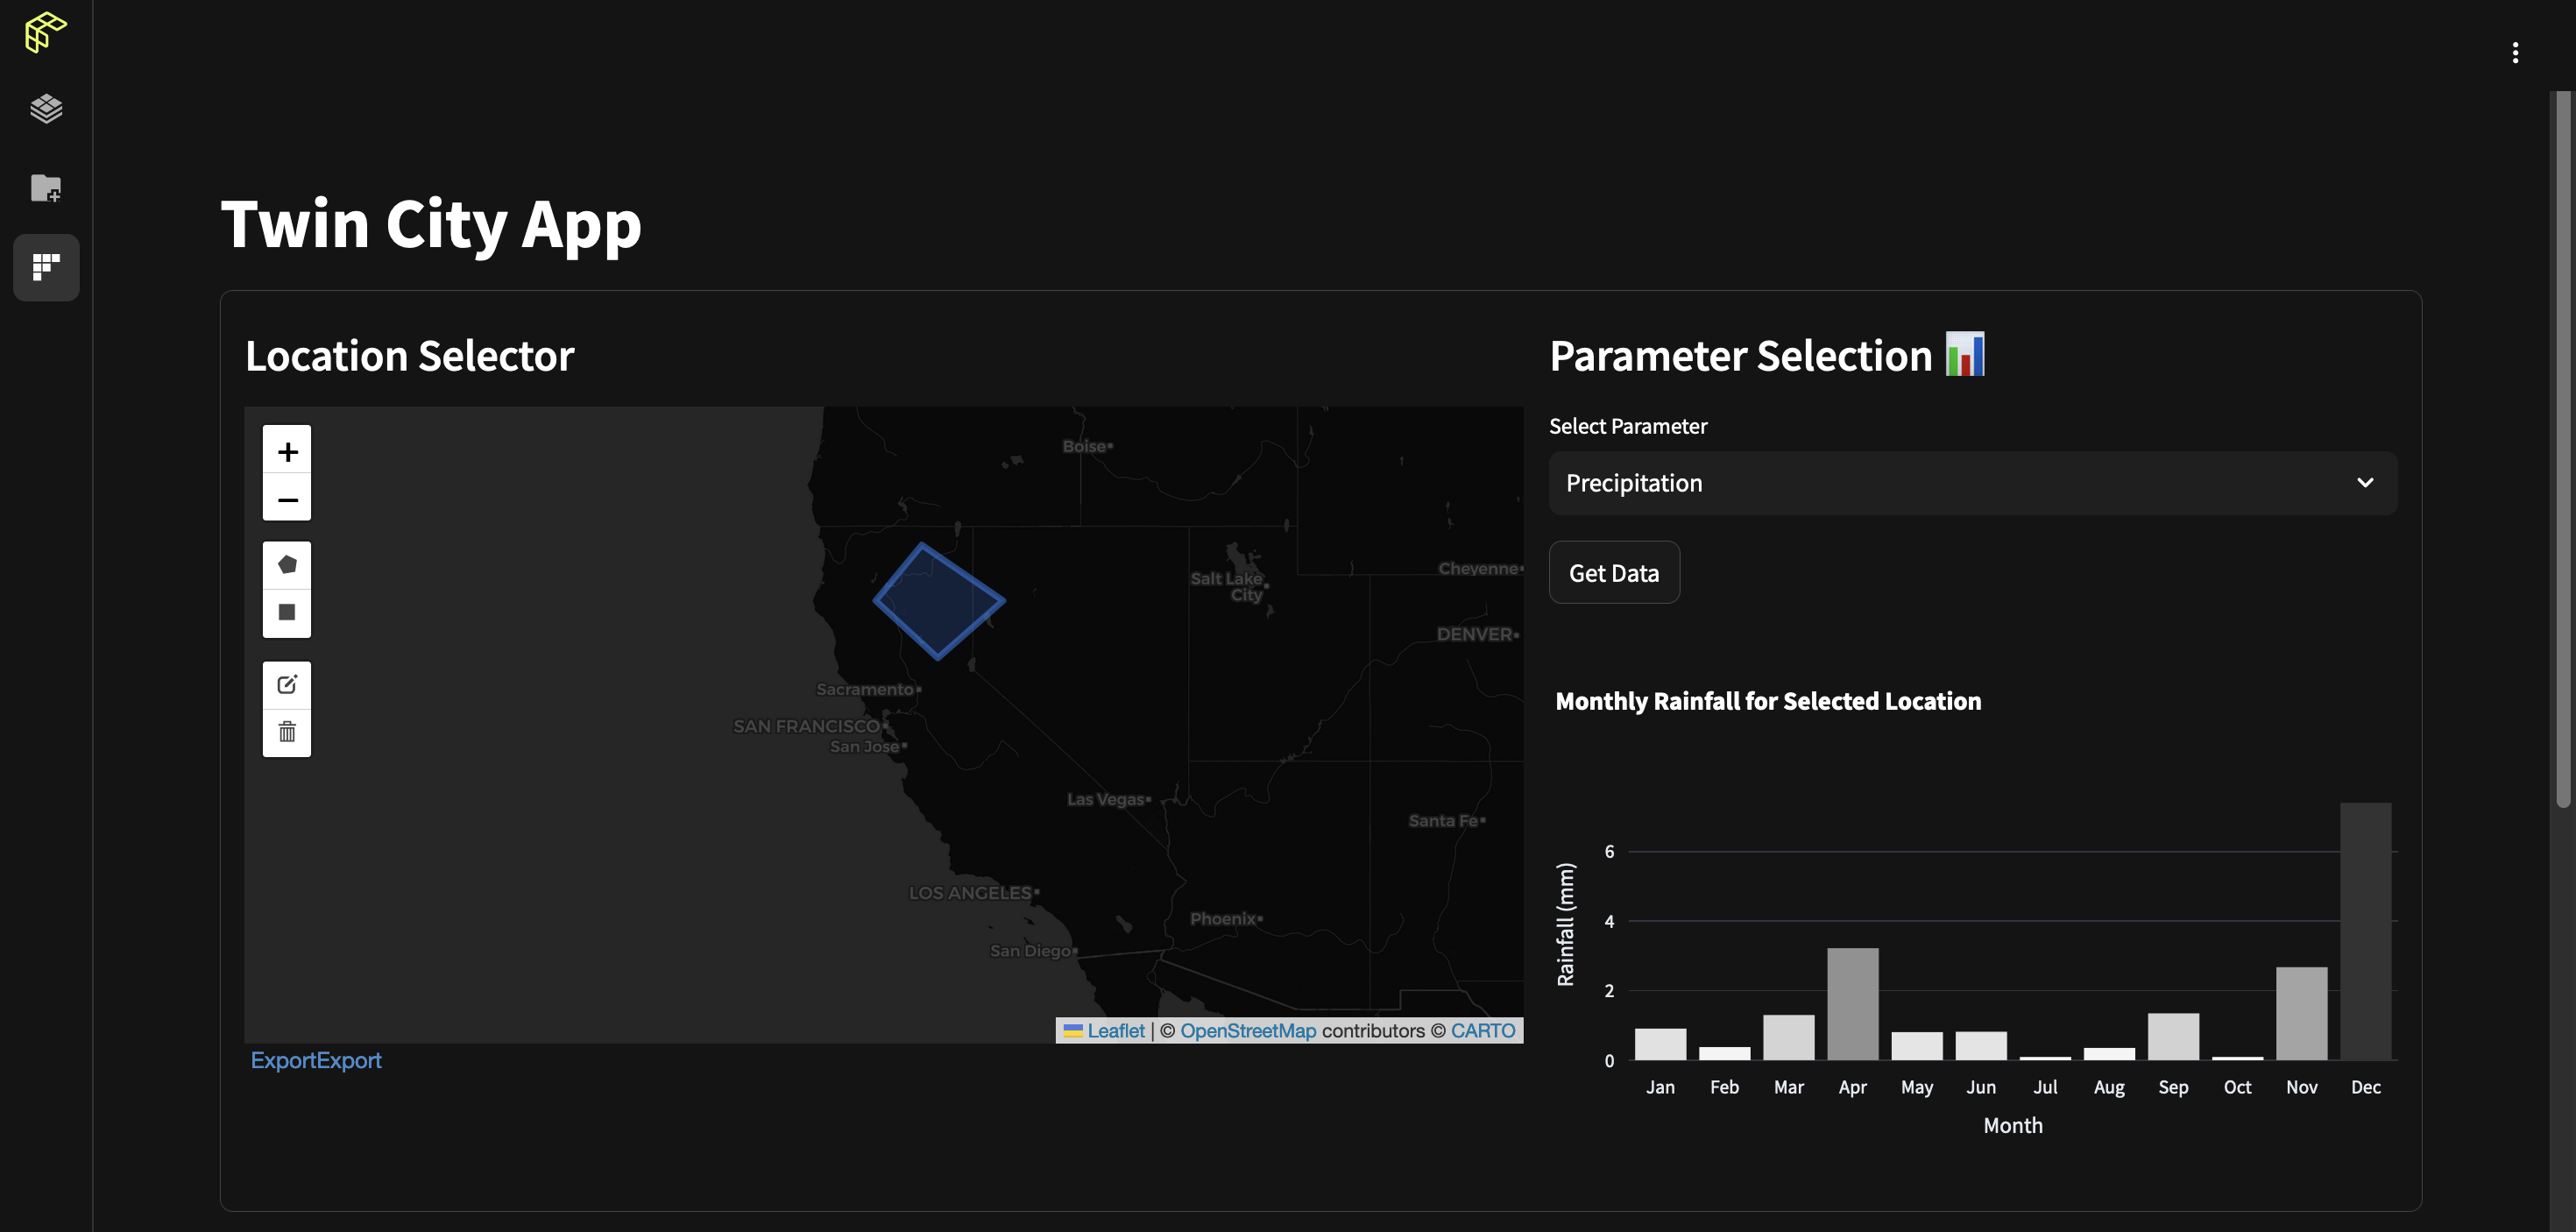
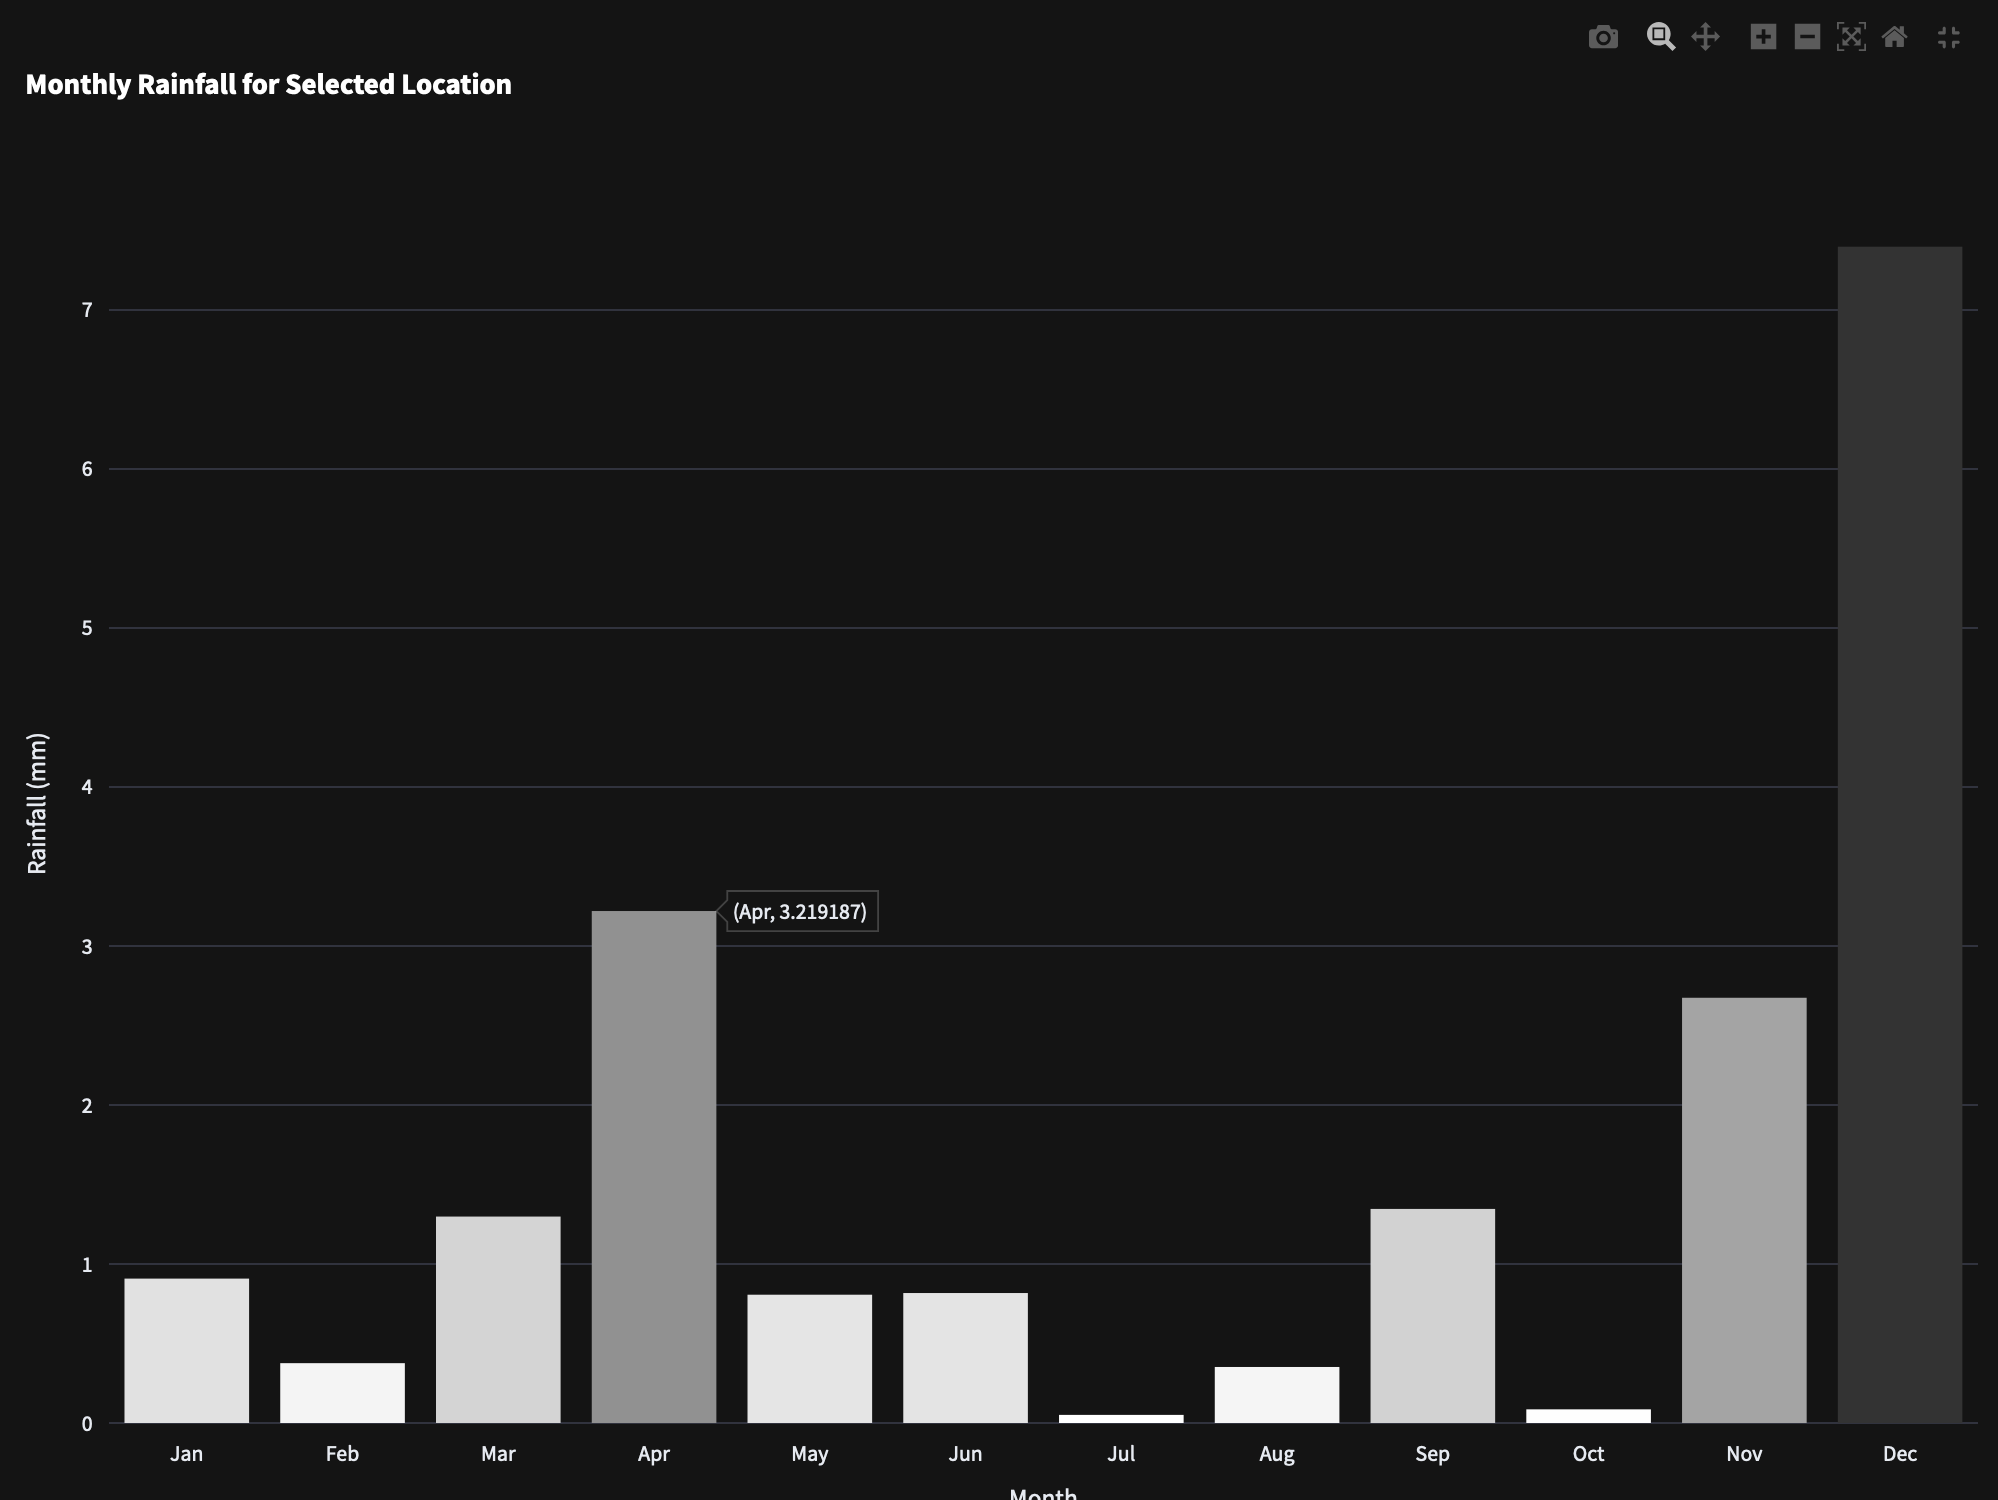
- Plotly Charts
A bar chart displays monthly rainfall data for the selected location in the folium map after querying the UDF and passing the GeoJSON shape as a parameter in the UDF,
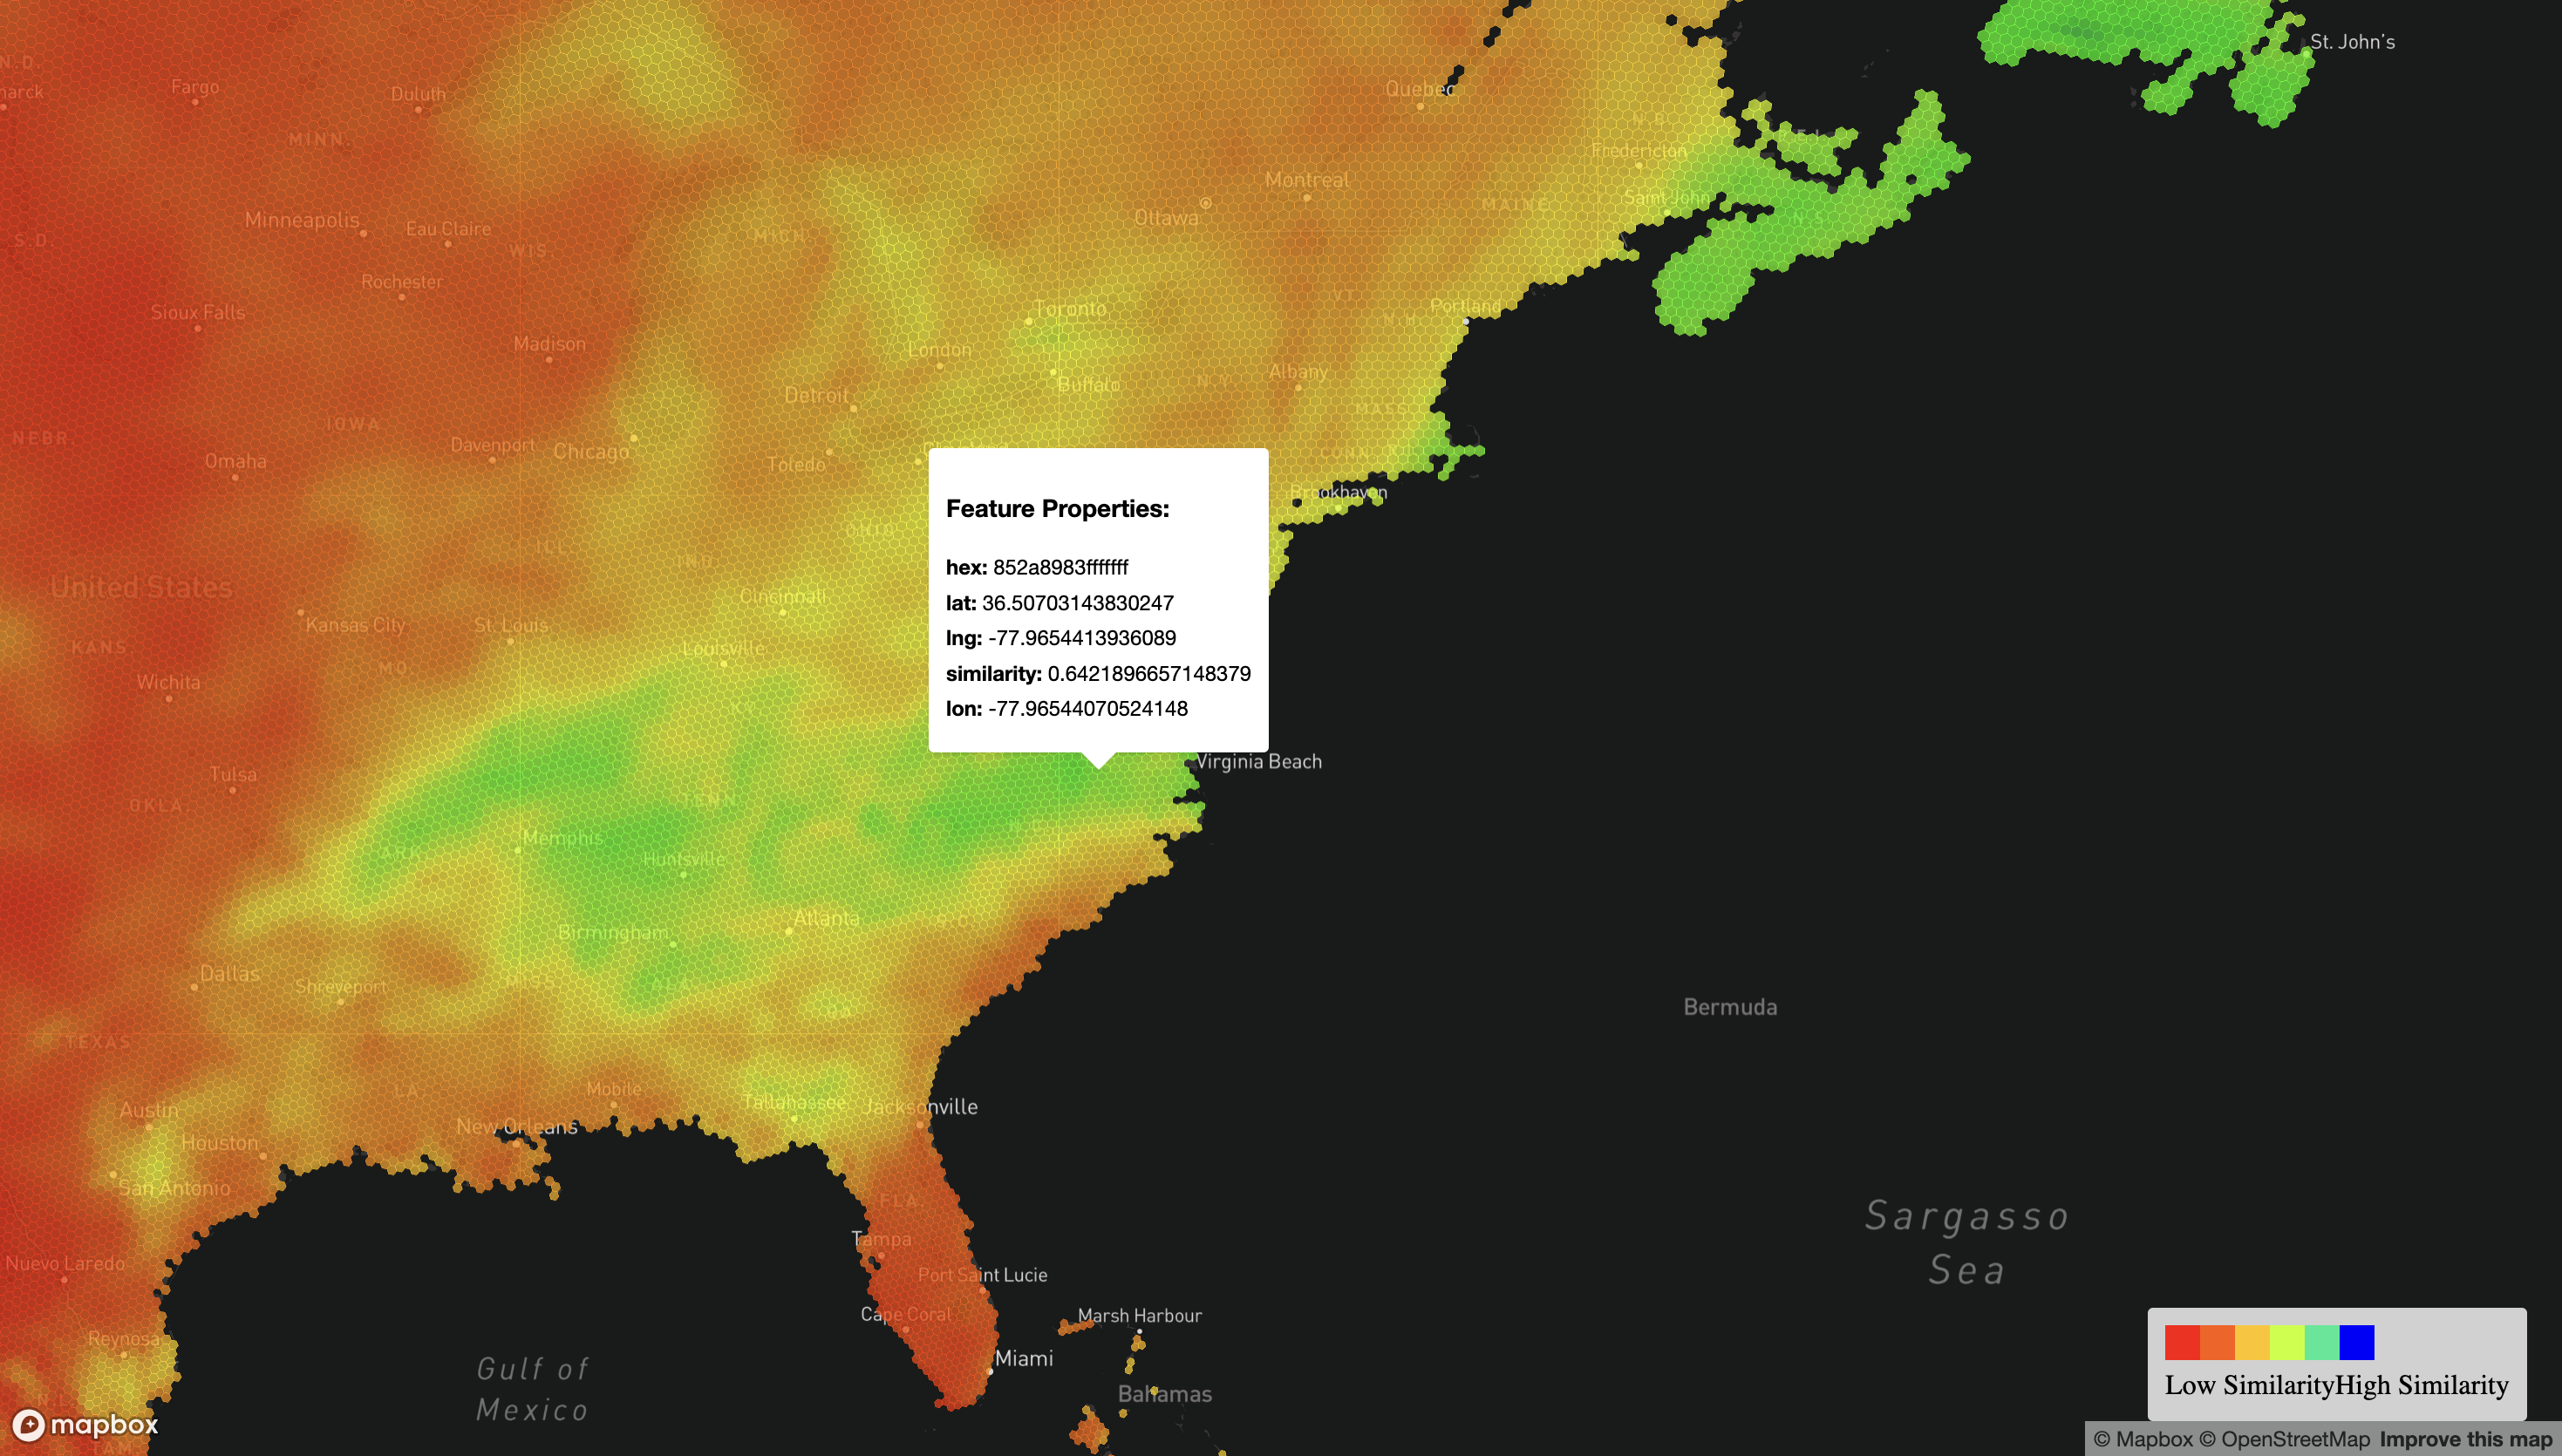
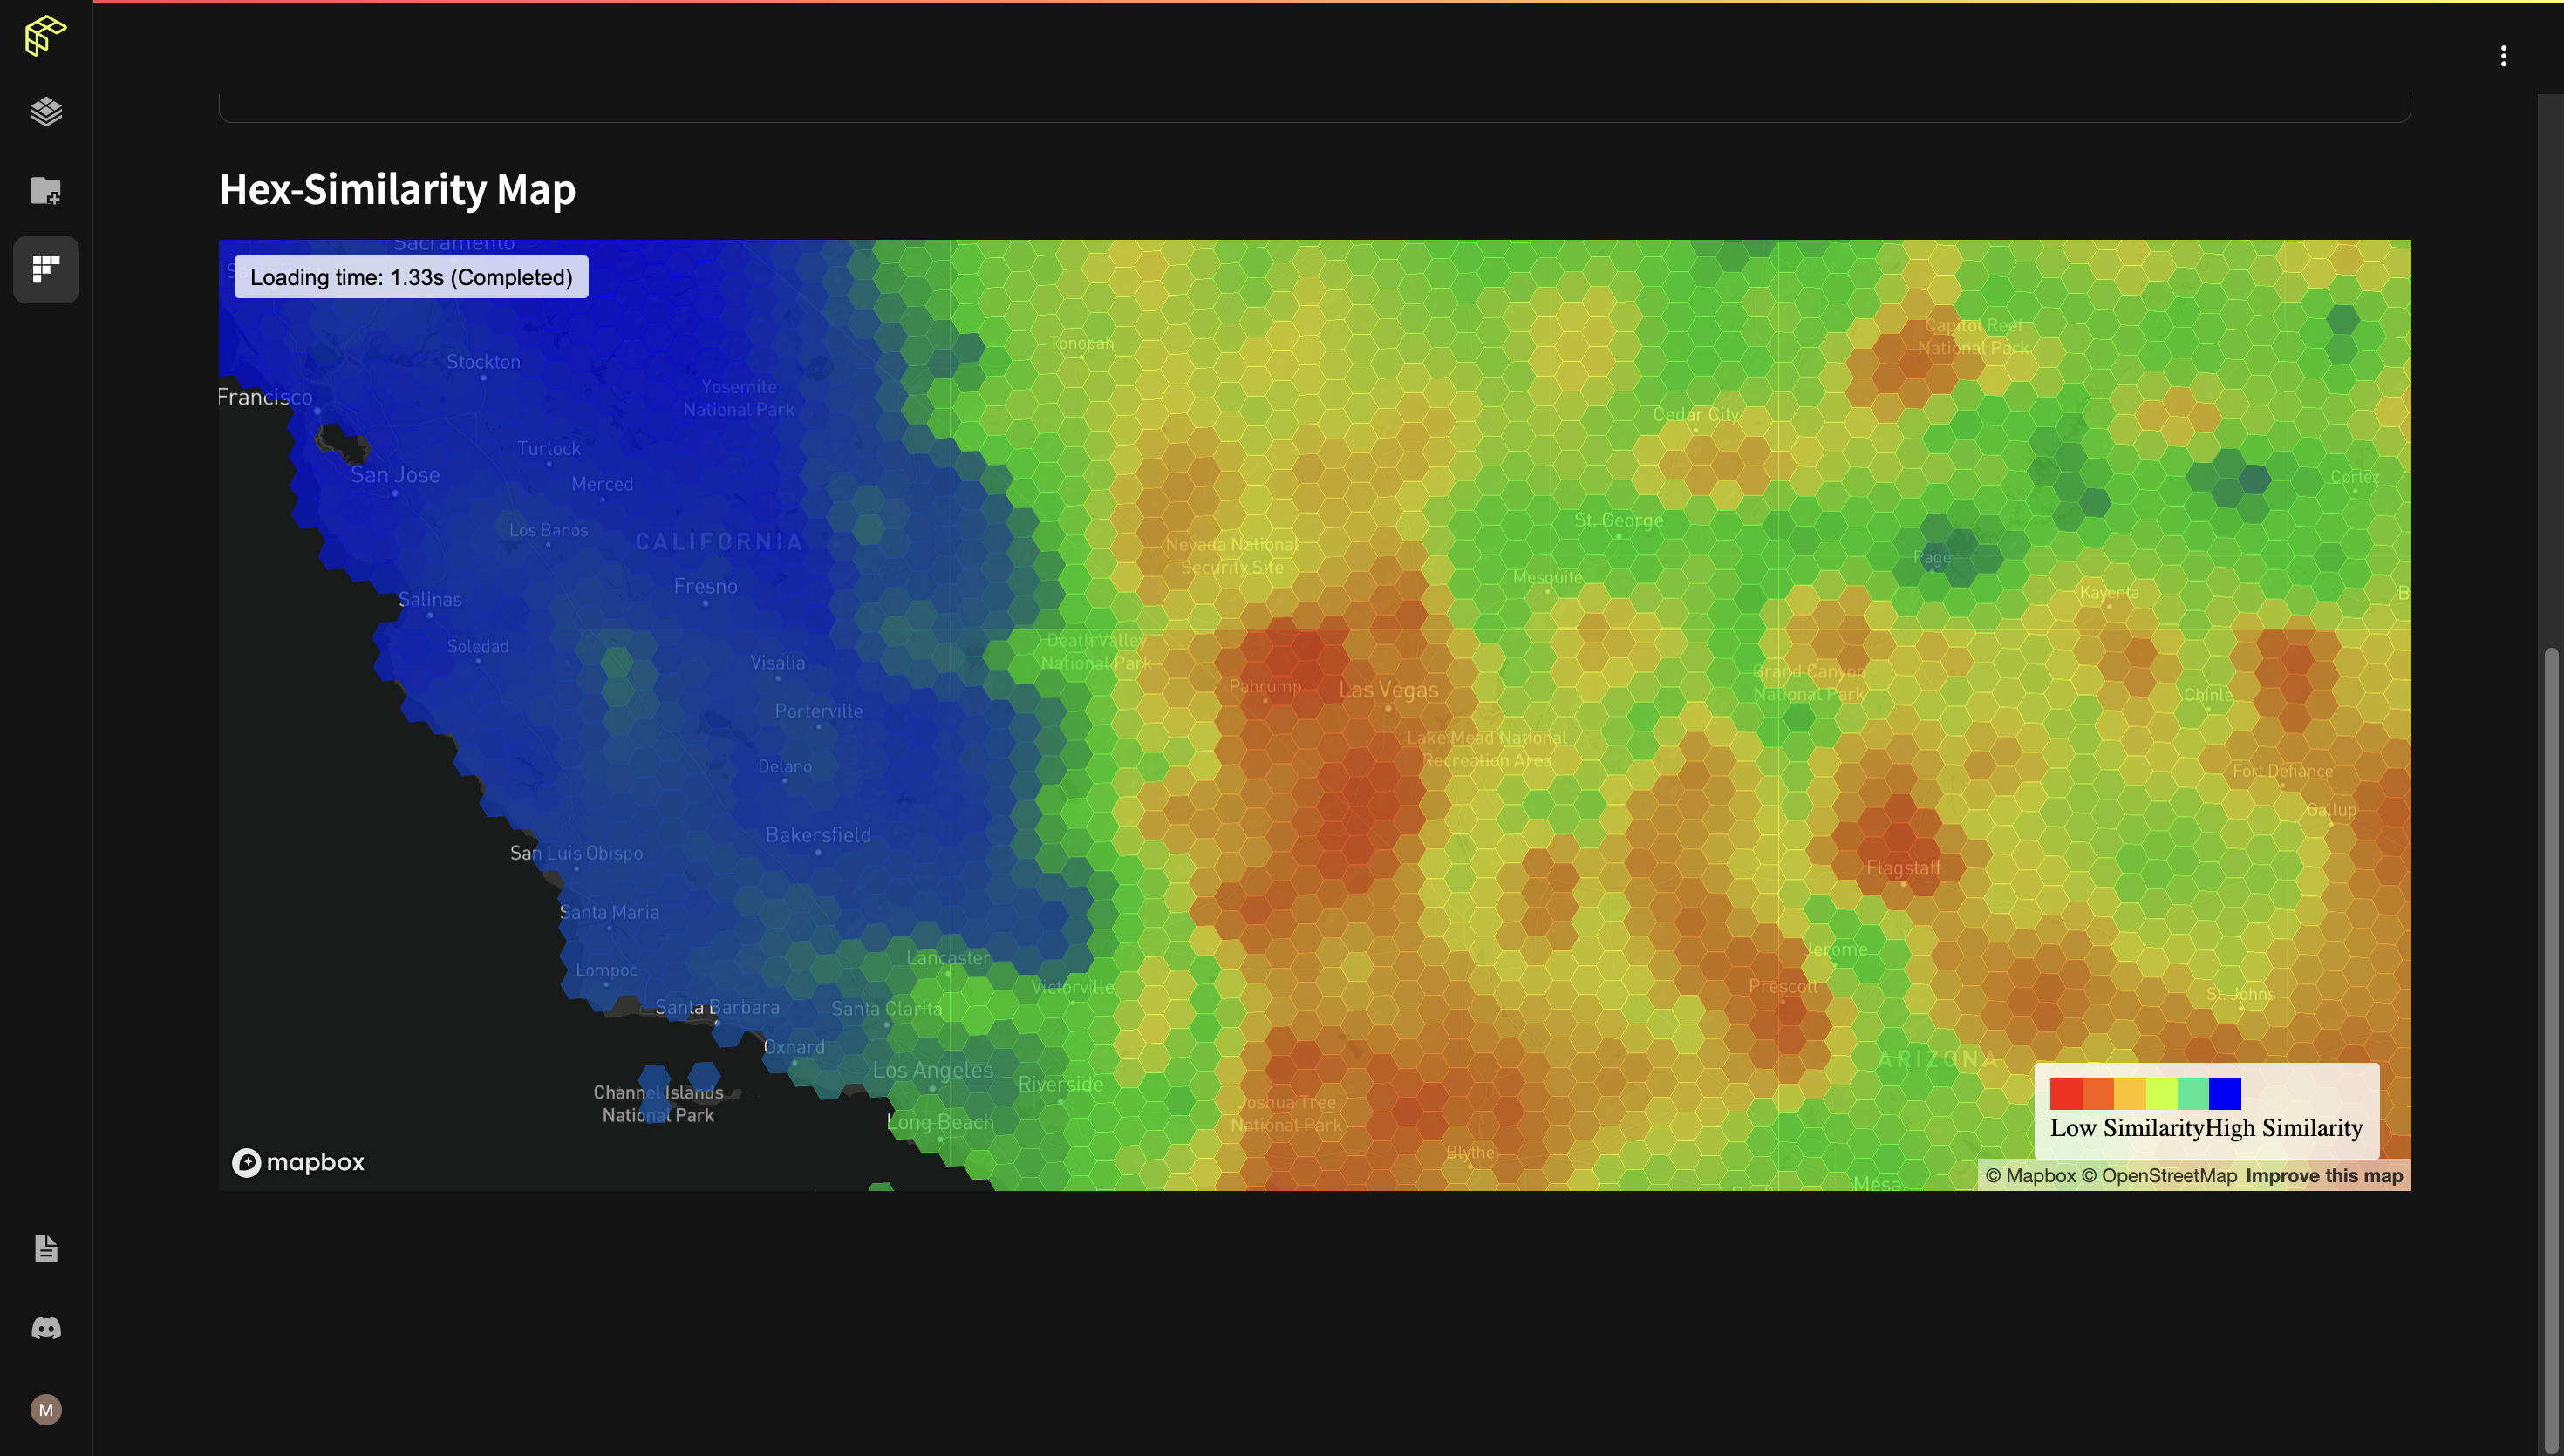
- Iframe Integration
- The hex-similarity map shows global rainfall pattern similarities.
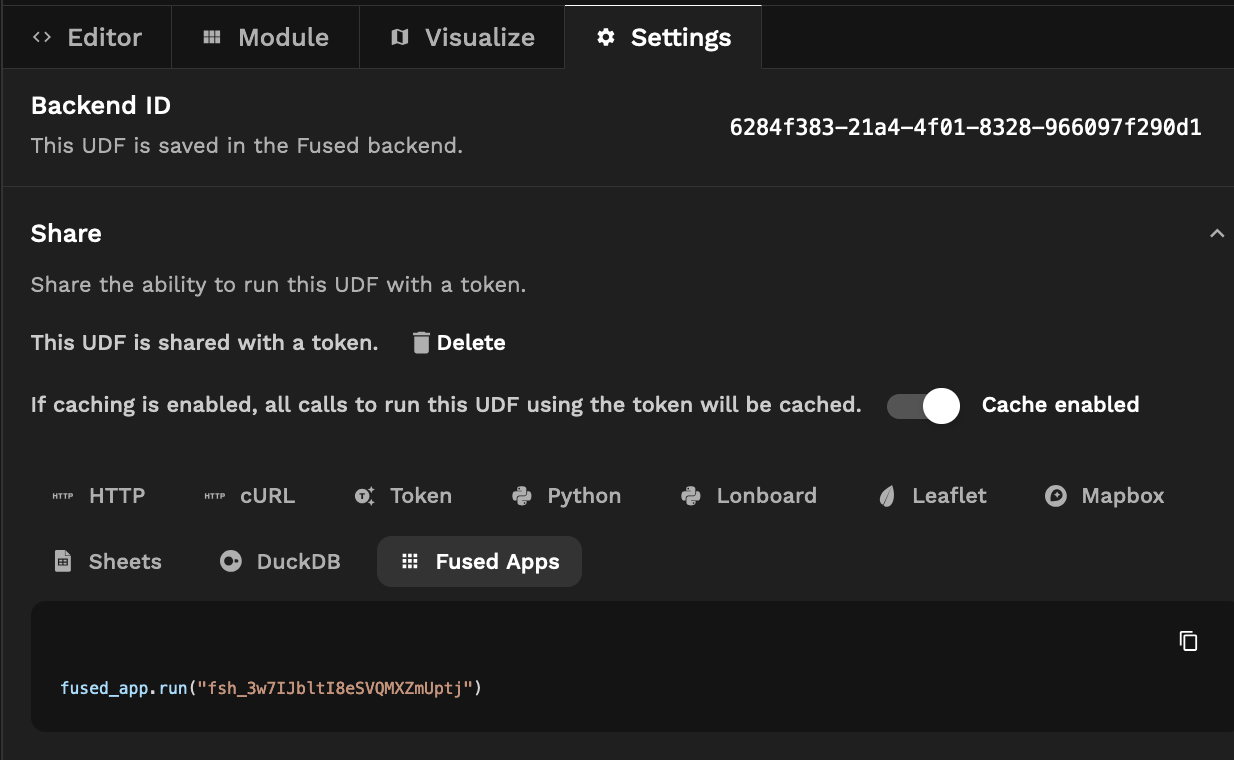
Calling the UDF within the App
Just one line of code to call my UDFs within the app to
- Fetch the historical rainfall data from Google Earth Engine for the marked area.
- Aggregate rainfall vectors
- Calculate the similarities of the location with the vectors in the bounding box in the iframe
It was as easy as fused_app.run("fsh_****")
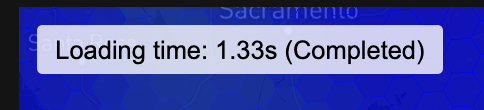
Performance and Optimization
Fused and Streamlit already have excellent caching mechanisms which helped me cache large amounts of data and information prior to the usage so that the next time the app loads, the computations are much faster! I can compare the rainfall patterns of any two locations on the Earth in seconds with a few lines of code. How cool is that!
Building scalable Geospatial Applications have never been so quick and easy!