H3 Parcel Suitability

Tula van Balen of BCG presented H3 Parcel Suitability at the H3 Conference 2026 in New York City: a single Fused canvas that answers how well suited a piece of land is by putting every relevant dataset on the same H3 grid. The session wasn't recorded, so this post walks through the canvas Tula presented.
Open the H3 Parcel Suitability canvas →
Start with a parcel
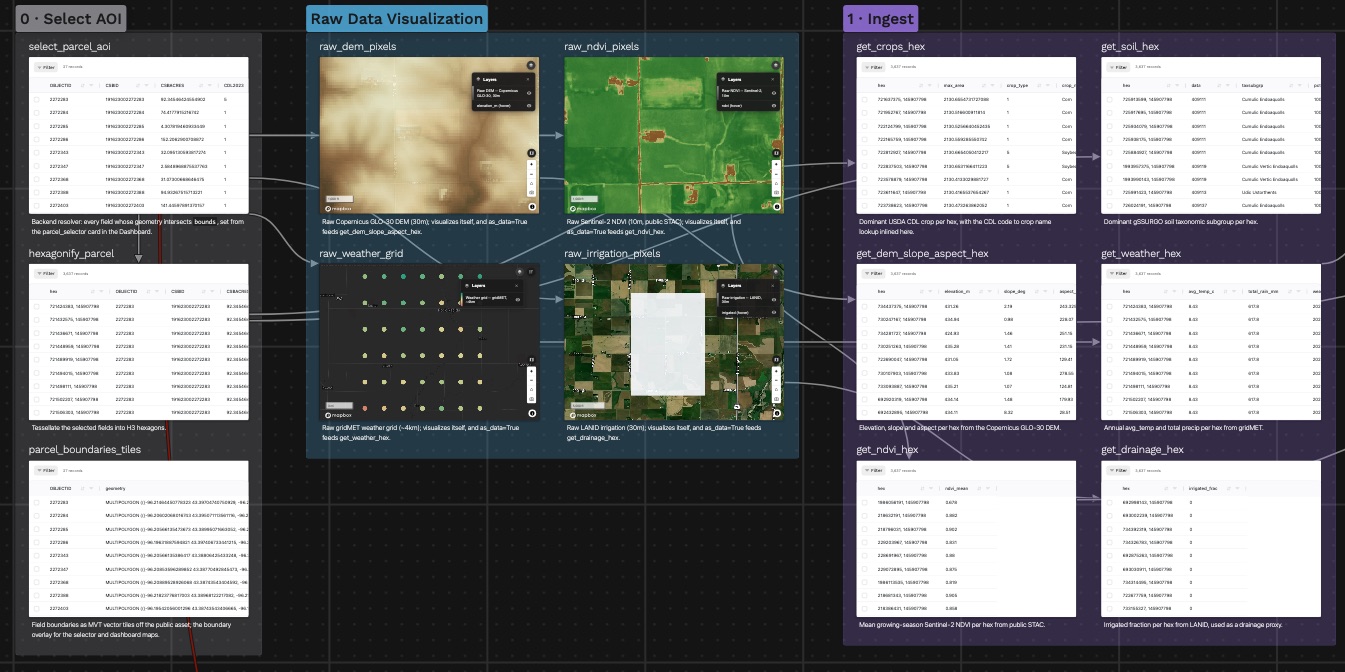
The canvas works on real field boundaries: USDA Crop Sequence Boundaries for Lyon County, Iowa. Pick a preset region or draw a box on the map, and every field that intersects it becomes the area of interest. Those fields are then tessellated into H3 hexagons at resolution 11, and that hex set is the backbone for everything that follows.
Six datasets, one grid
Suitability depends on many layers that arrive in different shapes and resolutions. The canvas first shows each raw source at its native resolution, then brings each one onto the parcel's hexagons:
- Crops: the dominant USDA Cropland Data Layer crop per hex
- Soil: the dominant gSSURGO soil taxonomic subgroup per hex
- Terrain: elevation, slope and aspect from the 30 m Copernicus GLO-30 DEM
- Weather: annual average temperature and total precipitation from the roughly 4 km gridMET grid
- Vegetation: mean growing-season NDVI from 10 m Sentinel-2 imagery
- Irrigation: the irrigated fraction from the 30 m LANID dataset, used as a drainage proxy
Once everything shares a cell ID, combining the layers is a join on the hex column instead of a spatial overlay. The canvas joins them into one wide table with a row per hexagon, then rolls that up to one row per farm: averages for the numeric layers, a circular mean for aspect (it is a compass bearing), and the majority crop and soil.
Clustering fields by land quality
To turn the table into a suitability signal, the canvas runs KMeans on two per-field measures, mean NDVI and mean slope. The three clusters are ranked by vegetation vigor against terrain roughness and labeled "High vegetation · Low slope", "Moderate" and "Low vegetation · High slope". A linked map and scatter plot let you hover a field on either side and see where it falls.
A dashboard you can ask questions
Everything ends in a Land Intelligence dashboard:
- Parcel selector: sets the area for the whole pipeline
- Multi-layer map: every feature as a toggleable hex layer, with farm boundaries on top, elevation and slope in 3D, and hexes switching between resolutions 8 and 11 as you zoom
- Filter bar: narrows farms by NDVI, slope, elevation, temperature, rain, irrigation, crop, soil or land-cover cluster
- "Ask your data" chat: an AI assistant that answers questions with read-only SQL over the parcel's per-hex table
The demo uses farmland in Iowa, but the workflow (ingest diverse layers, standardize them to one hex grid, then query and model) applies to any land-parcel dataset.