Calculating Fire Ratings with Overture Buildings and Places
TL;DR Chris Amico shows how to combine Overture Maps data with fire perimeters to analyze wildfire impact on buildings and businesses.
As communities continue to rebuild and recover from the devastation caused by natural disasters such as wildfires, the question remains: How can we quantify what was lost, especially in the built environment? With the ability to analyze detailed building footprints and overlay fire boundaries, we can begin to answer this by providing a rough estimate of the damage and identifying which structures were impacted by the flames.
In this blog post, Chris Amico shows how by leveraging data such as Overture Building footprints and fire progression maps, we can gain insight into the extent of fire risk. This enables news agencies to derive insights such as count of shops or homes exposed or even assess the capacity of highway routes for residents to evacuate before a prospect fire reaches them.
To follow along, you check out the UDFs and app associated with the blog post:
- Fire Proximity GERS_Lookup UDF
- Fire Proximity Building_Score UDF
- Fire Proximity Buffer UDF
- Google Sheet that enriches the "Fire Risk" column for any given Building GERS
- App: H3 rollups within water buffer
Introduction
Fused simplifies the process of spatially joining datasets with Overture Maps data, such as integrating with fire-related datasets.
For this example, we use the Inter Agency Fire Perimeter Historical dataset (published by the National Interagency Fire Center (NIFC)) which includes historical fire perimeters up to 2024. Joining fire perimeters with Overture Buildings and Places data enables us to highlight service gaps or identify regions that may require immediate response.
This demo will first select buildings within a buffer zone to determine which fire perimeter they fall within. Then, it will perform an H3 stats roll-up of business categories from Overture Places, counting the number and types of businesses that fall within each distance range. This will involve rolling up Overture Places business categories into H3 hexagons.
The Workflow
These UDFs return Overture Buildings and Places within a buffer distance from a fire. They offers a simple way to determine the scope of possible fire damage and quickly assess the number of businesses, homes, and other significant structures within the affected area. By adjusting the buffer or selecting fire extent based on dates, users can fine-tune their analysis to gain deeper insights into how far the fire's reach extends and what establishments were most at risk.
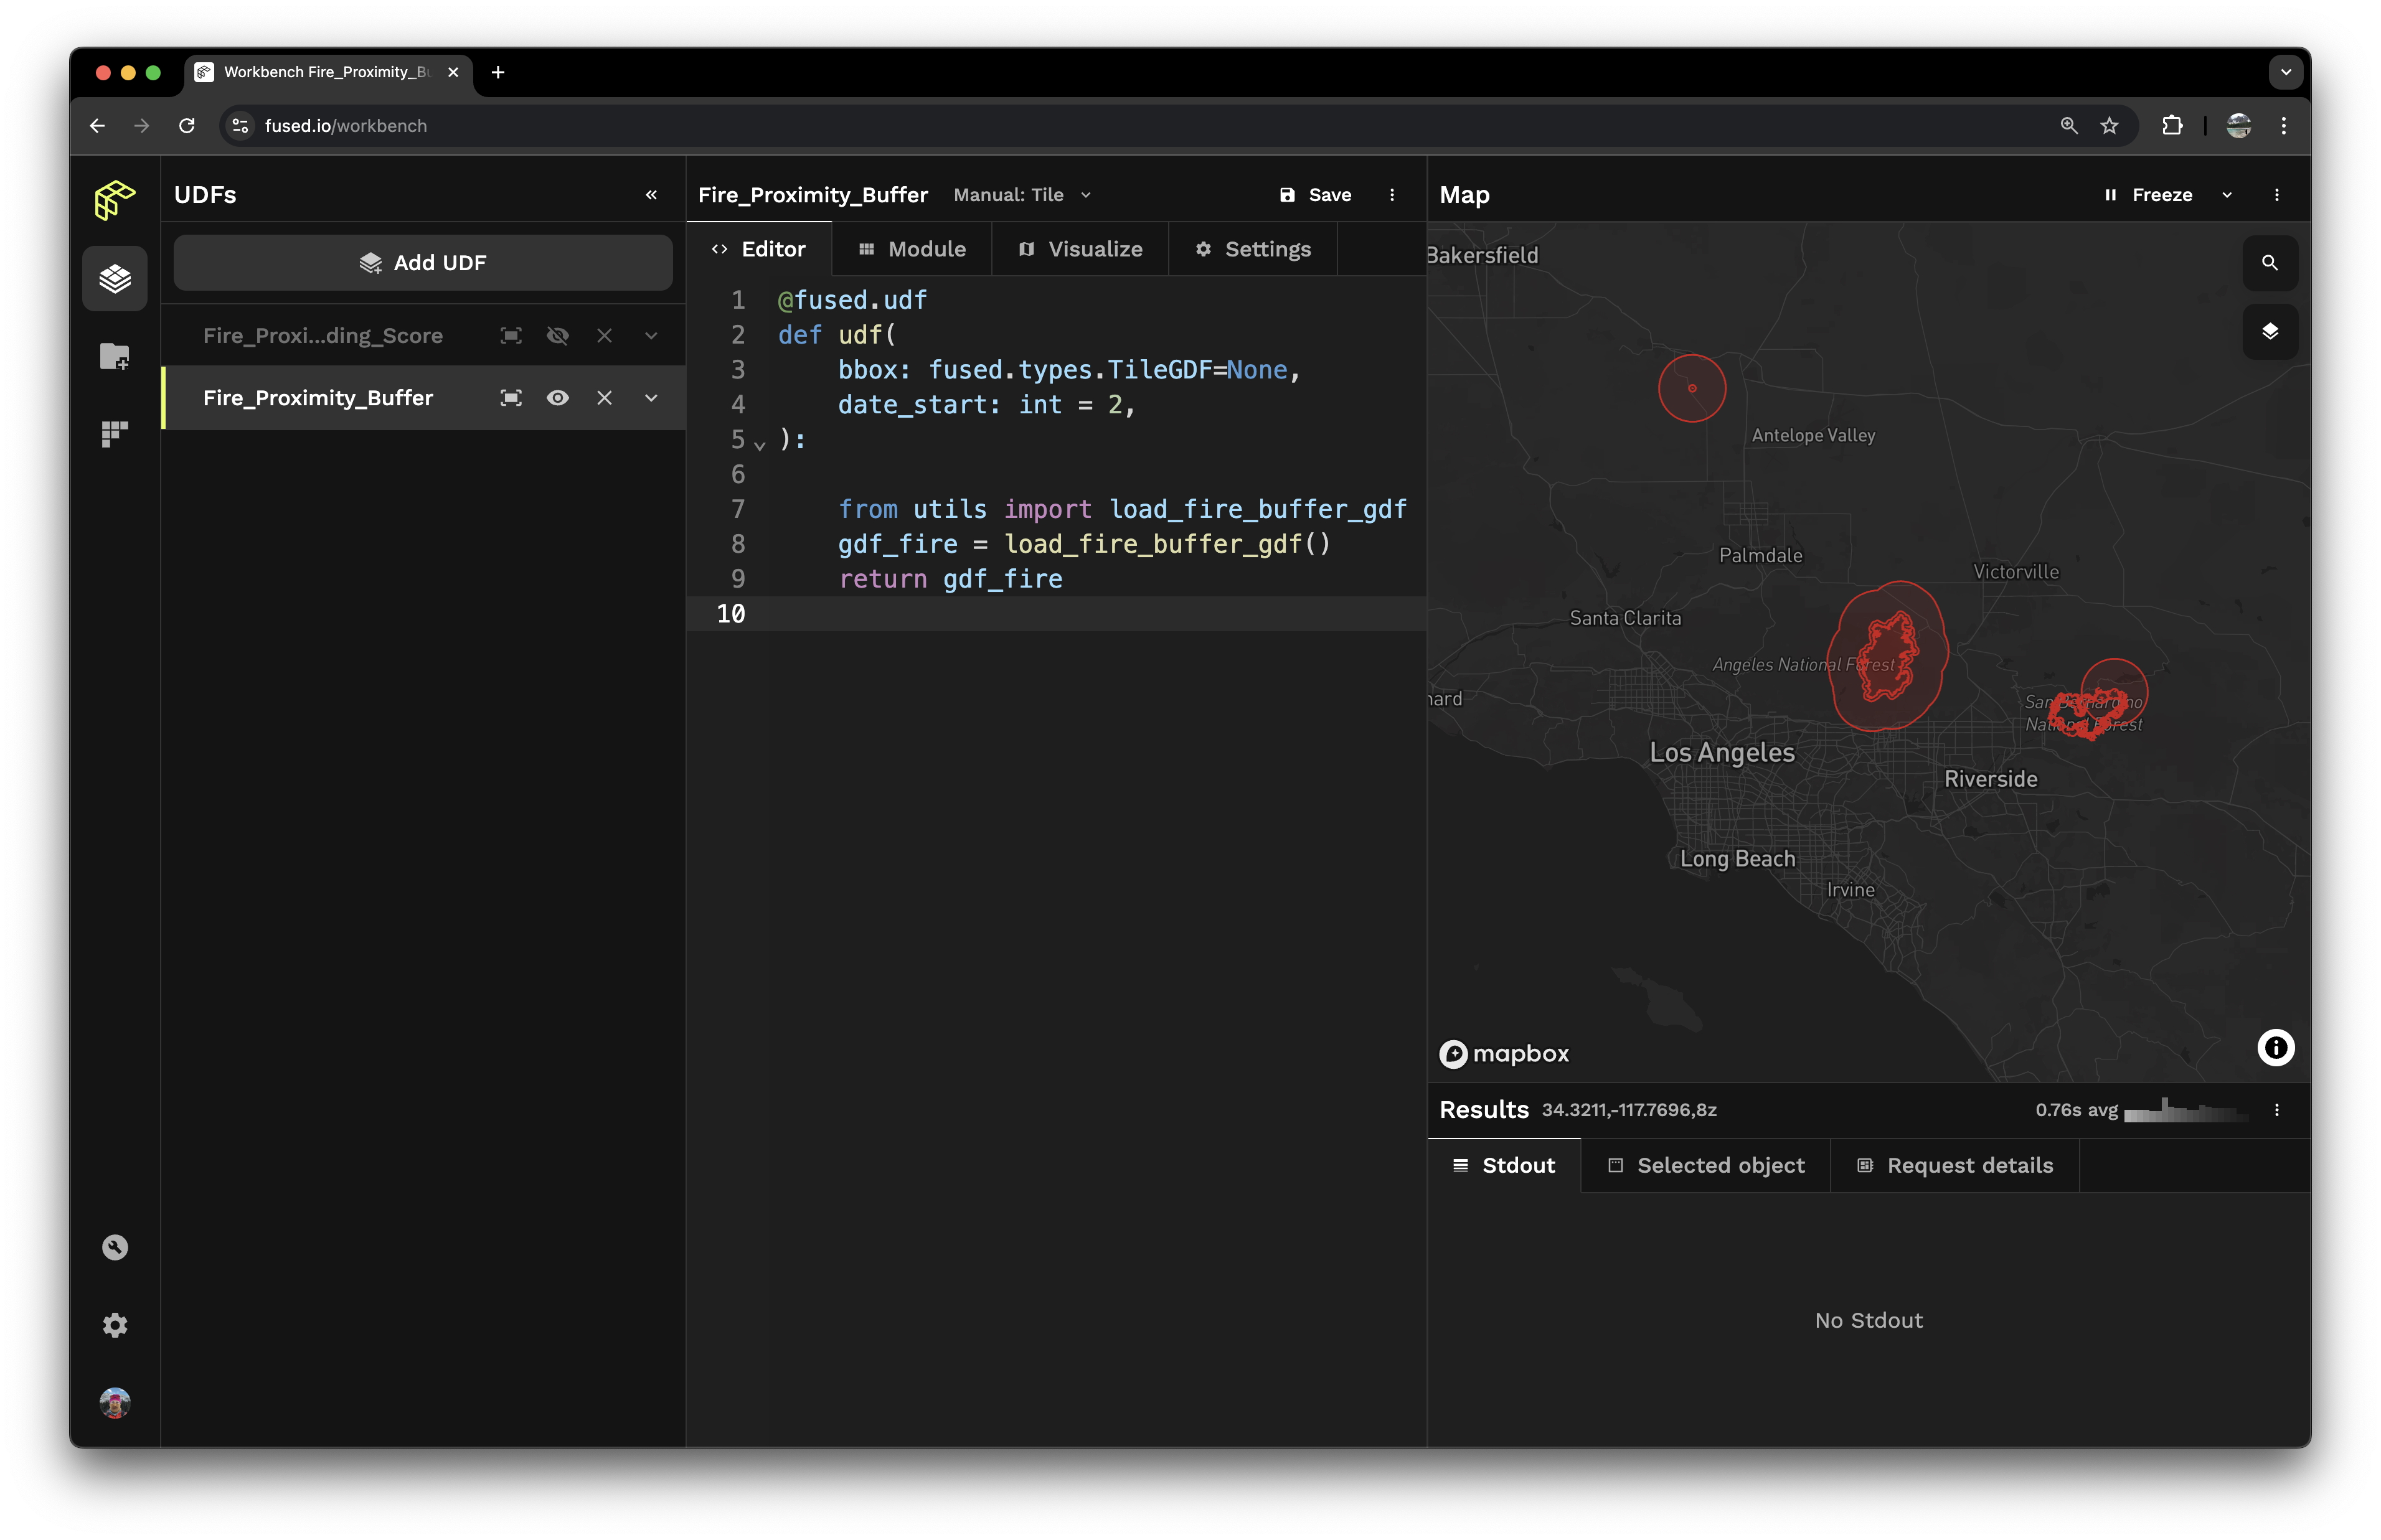
a. Fire Proximity Buffer
First, we create a buffer around the fire perimeter to define the area of interest. This buffer helps us understand the extent of the fire's impact and provides a clear boundary for further analysis.
- In Historic Perimeter: The building/point is within a historic perimeter
- Near Historic Perimeter: The building/point is within 1km of a historic perimeter
- Outside Perimeter: The building/point is within 10km of a historic perimeter

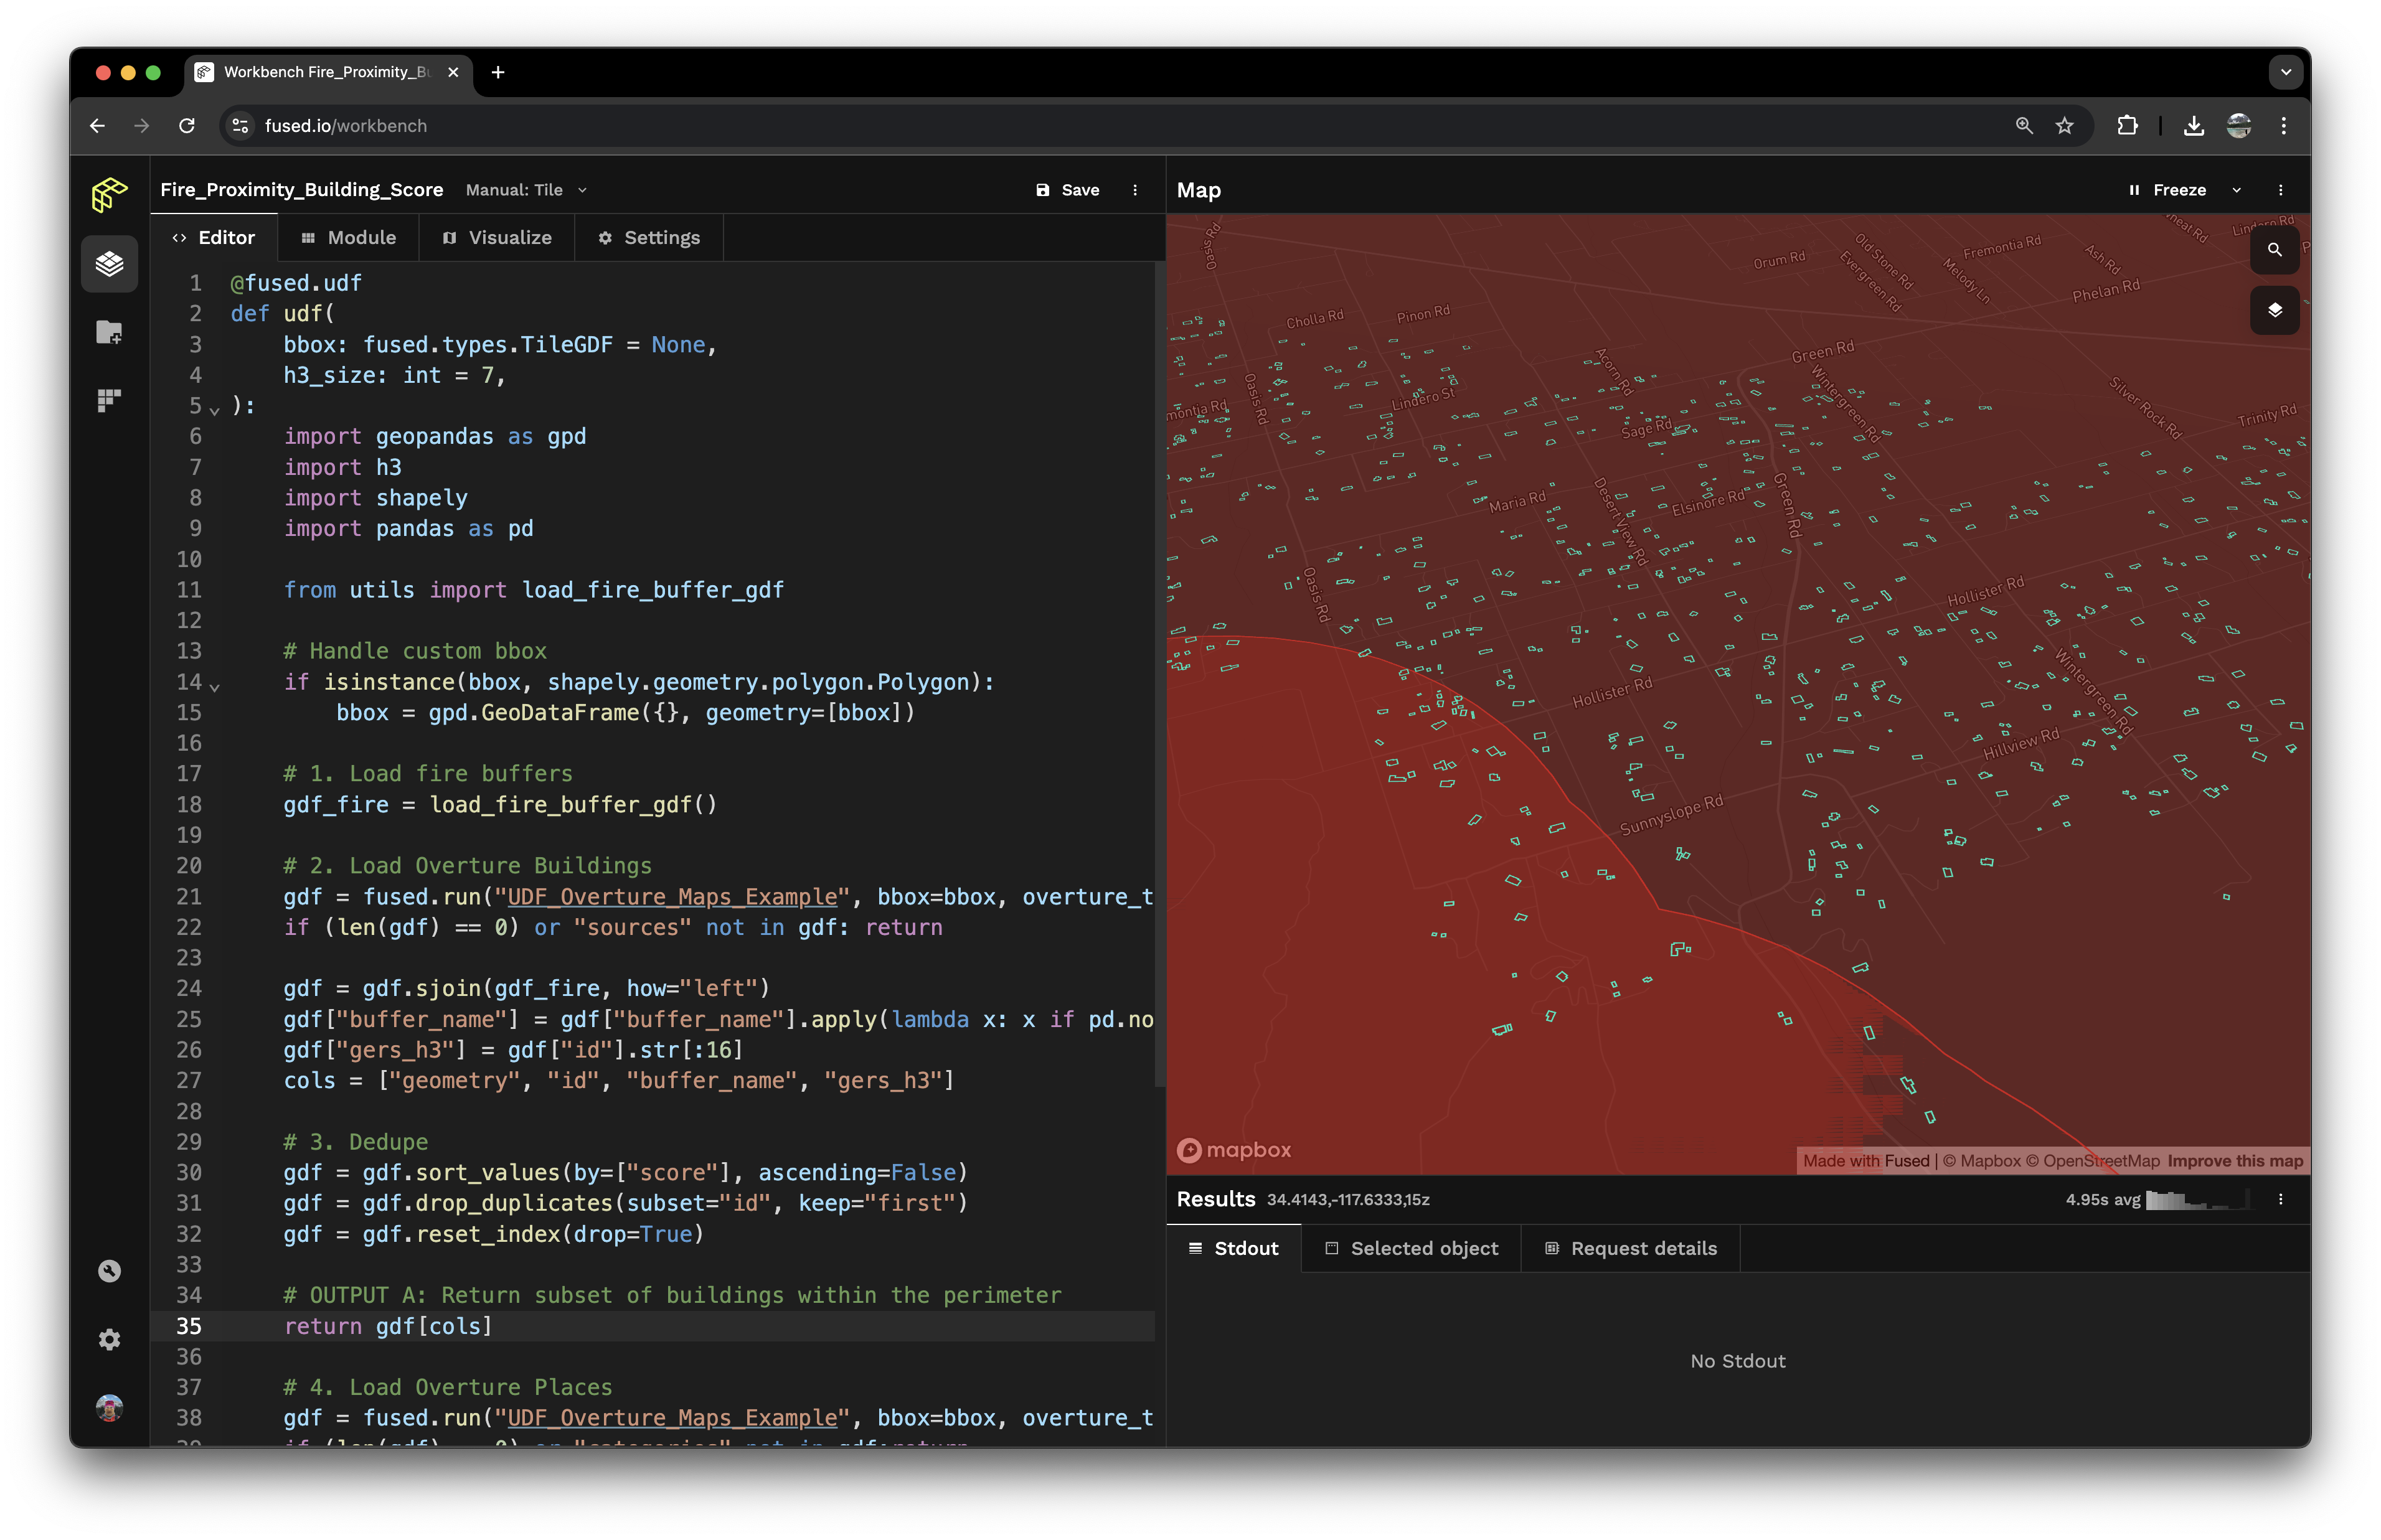
b. Fire Proximity Building Score
Next, we load the Overture Buildings dataset and spatially join it with the fire buffer zones. This workflow categorizes buildings based on their proximity to the fire, helping us assess which structures are most at risk.
- Load the NIFC fire perimeter data
- Create buffer zones around the fire perimeters
- Load Overture Buildings
- Spatially join buildings within the buffer zones to categorize them by proximity to the fire

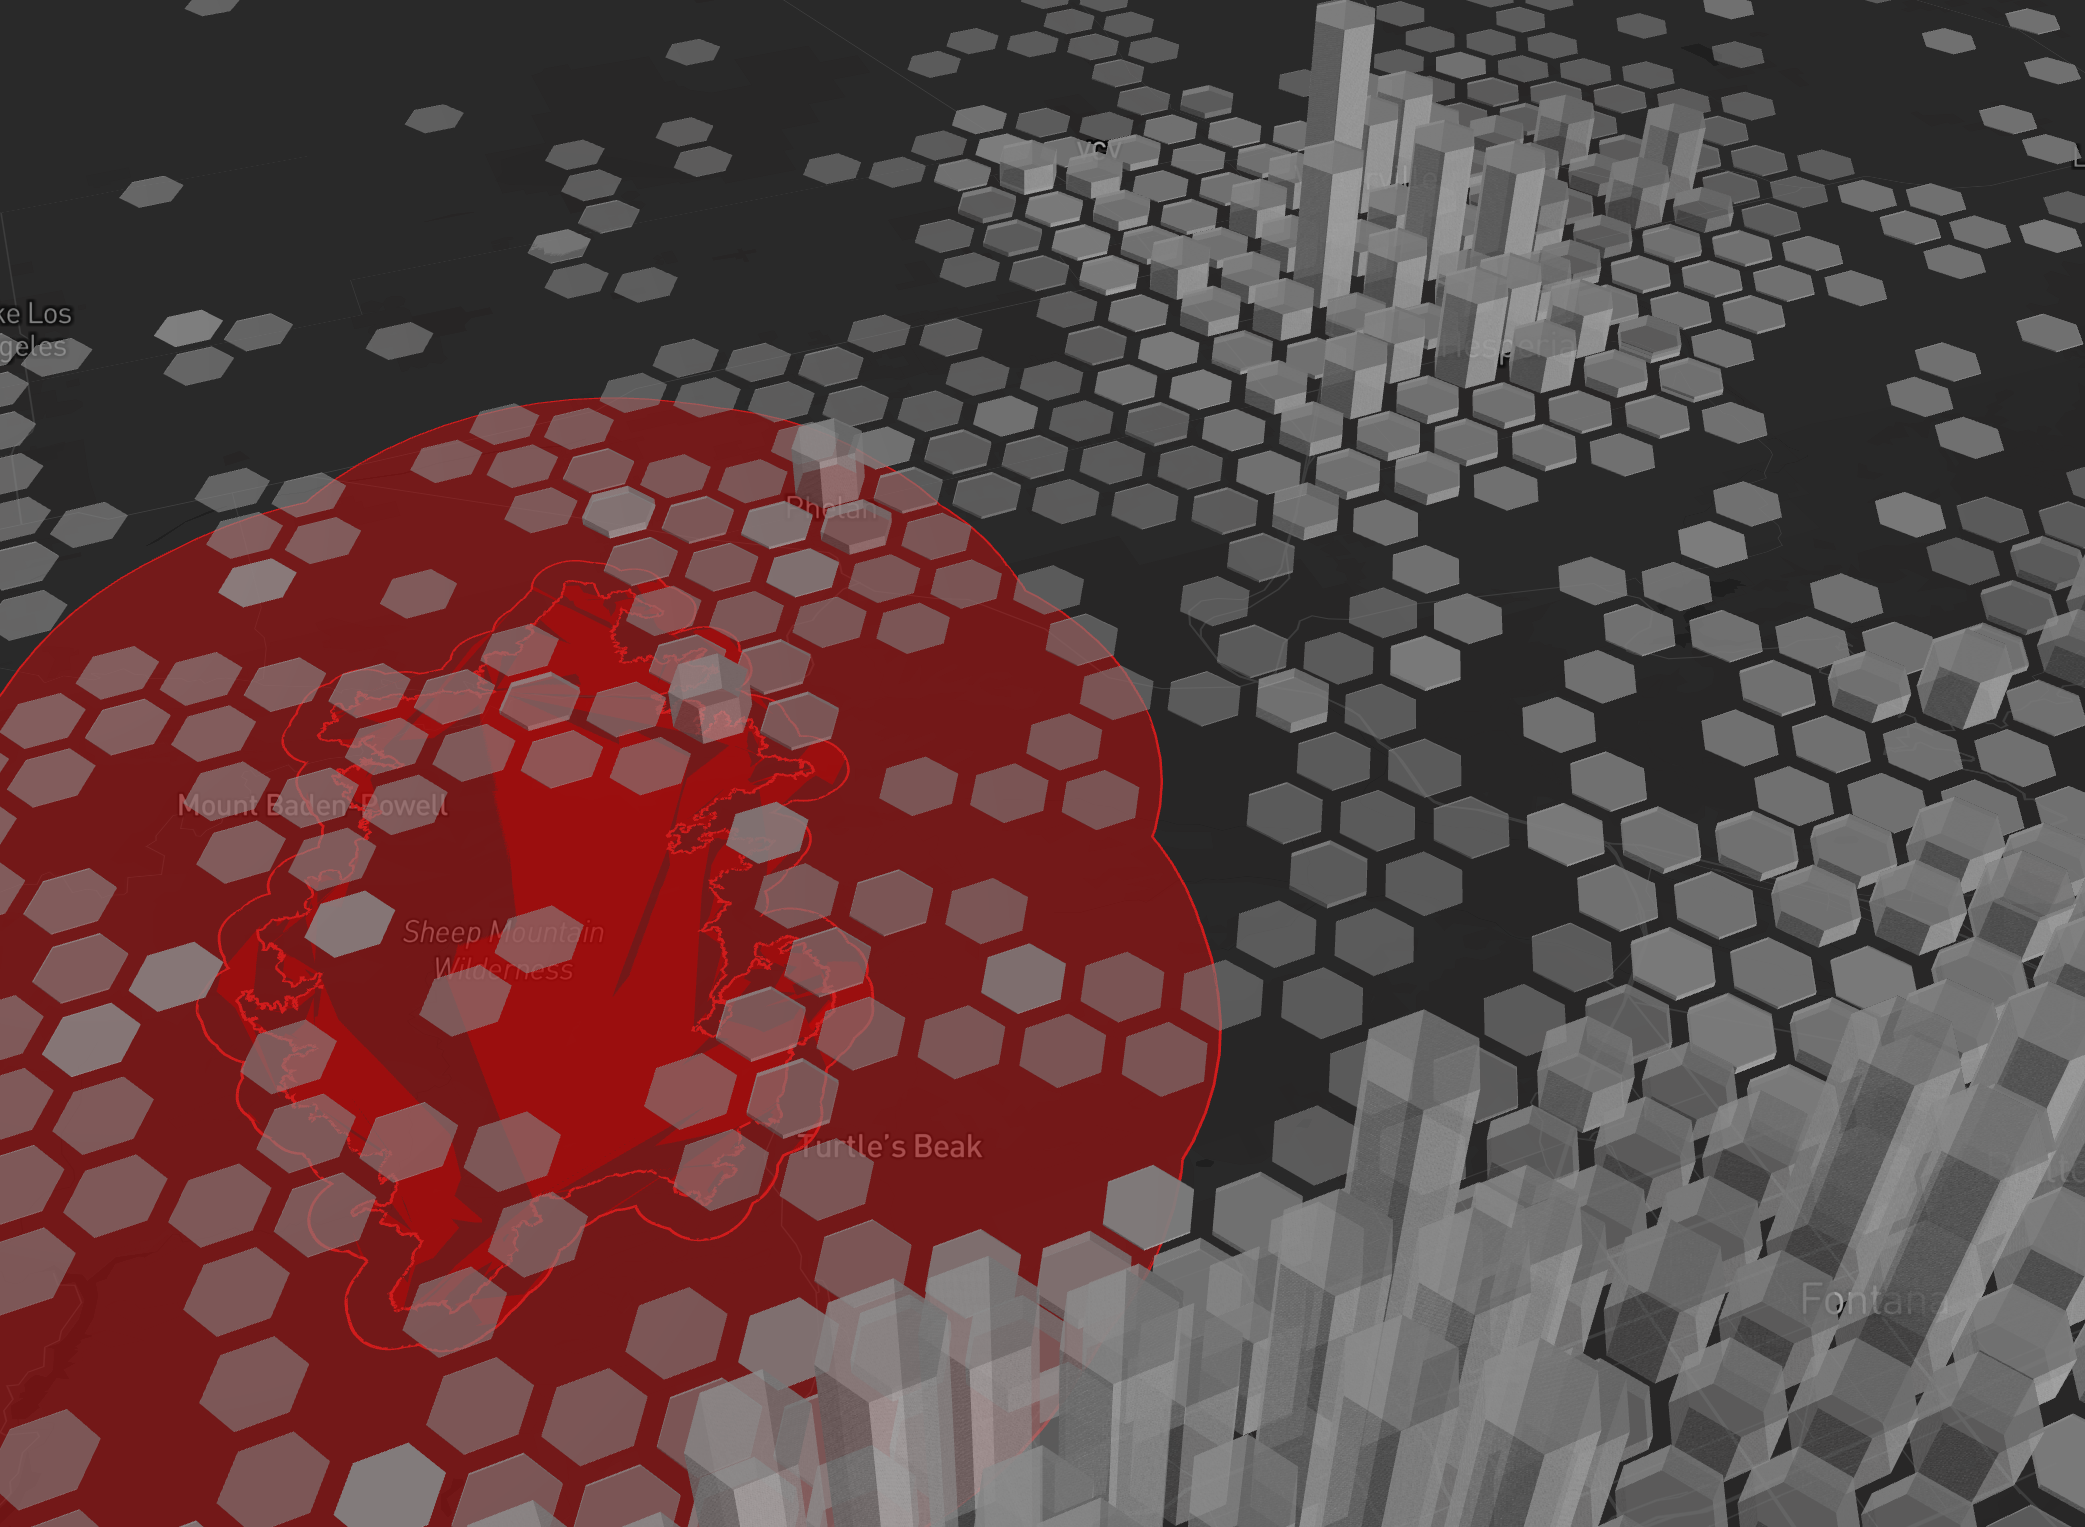
c. Overture Places Rollup by H3
Finally, we perform a spatial aggregation by calculating the H3 index for the centroids of Overture Places within the fire buffer. This allows us to roll up business categories into H3 hexagons, enabling a holistic overview of business distribution in relation to the fire perimeter.
- Load the NIFC fire perimeter data
- Load Overture Places
- Determine the H3 for the centroid of each building
- Normalize the 'categories' column into individual columns
- Roll-up categories by H3, create categories primary set

Conclusion and Next Steps
This kind of analysis helps understand not only the immediate impact but also in planning for future fire preparedness and recovery efforts. In this post, we saw how Overture and Fire-extent data can help us estimate the extent of the damage, from individual buildings to entire neighborhoods.
Organizations looking to integrate these types of perspectives into their workflows could create apps or API services that deliver derivative products, such as GERS lookups to categorize "fire risk" based on buffer proximity.
They could also use Fused HTTPS endpoints from the UDF to return a CSV with the GERS and "Fire Risk" score for buildings within a defined bounding box, as specified by a query parameter. Additionally, they could also use the HTTPS endpoints to automatically enrich the "Fire Risk" column of an arbitrary dataset for any given Building GERS. Users could apply it to any row of their table, with the functionality powered by a "GERS lookup" endpoint using a GERS ID query parameter.

