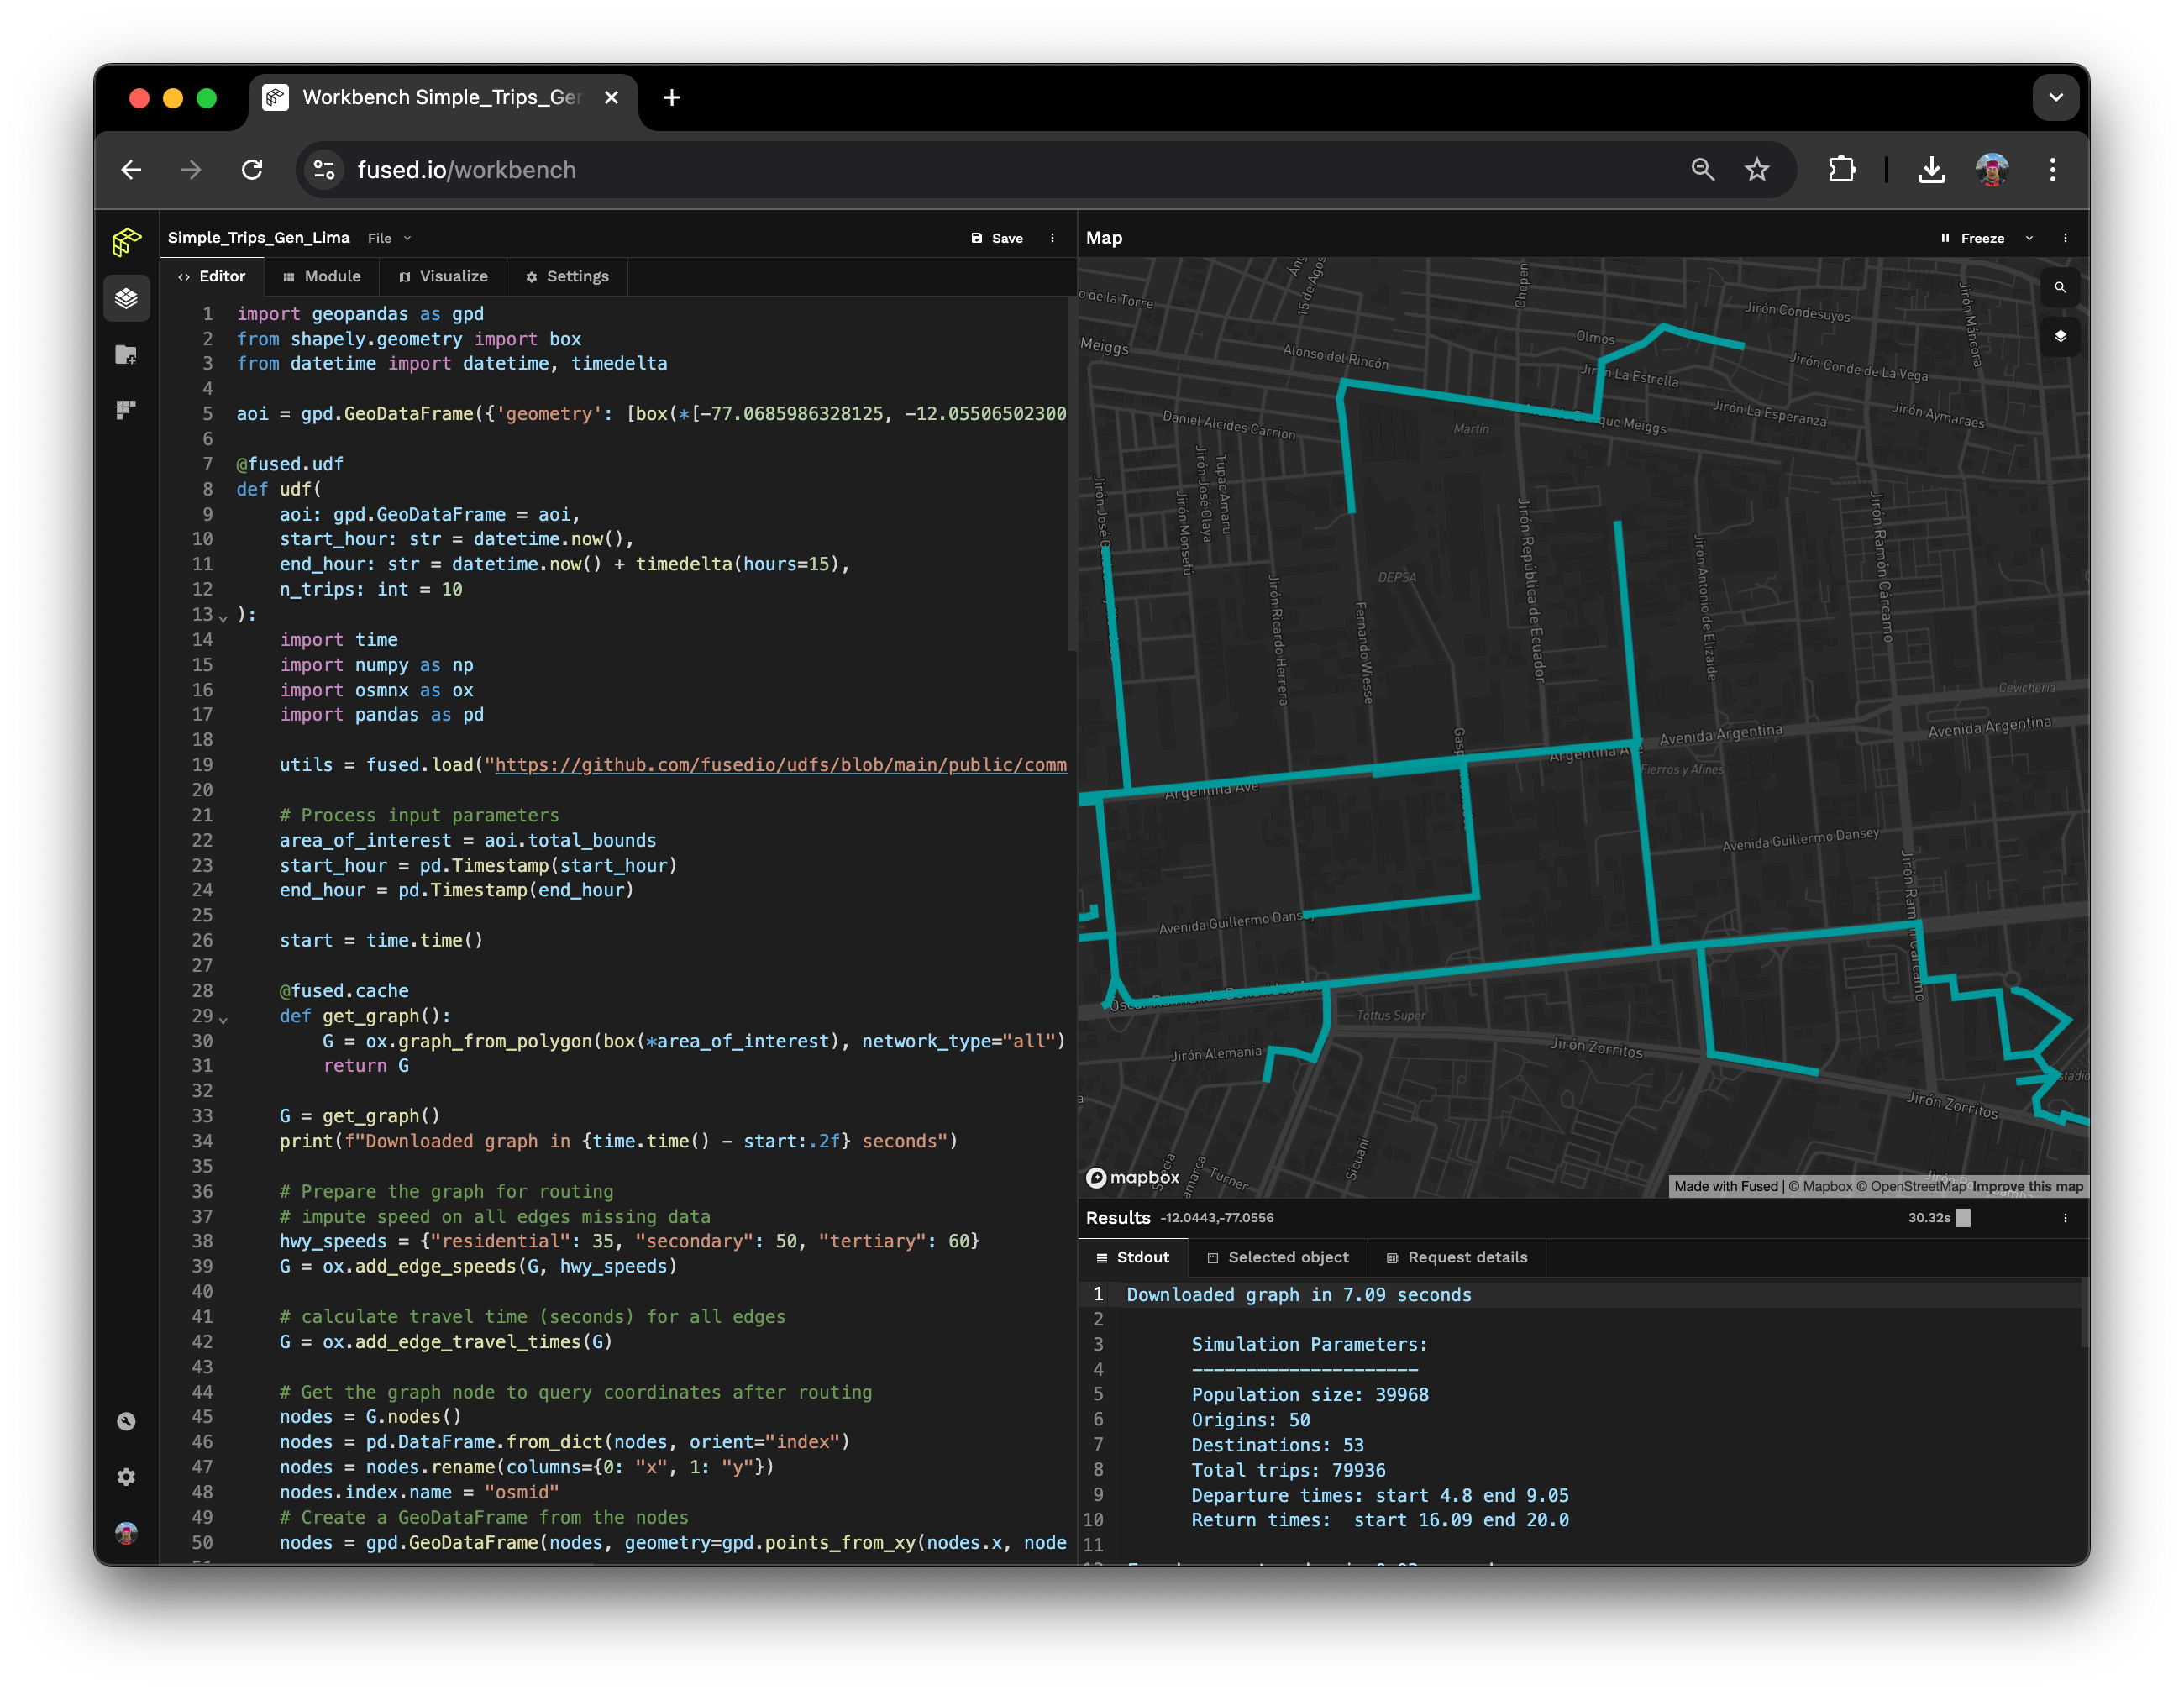
Creating an app to model road mobility networks in Lima, Peru
TL;DR Claudio used Fused to create an app to model road mobility networks in Lima, Peru, using GeoPandas, and OSMnx.
On December 2023, I visited the Institute for Metropolitan Planning (IMP) in Lima. The director had invited me to share some of my geospatial analysis projects from my master's studies and explore potential collaborations. Around that time, Lima's mayor had announced a bold infrastructure initiative: building 60 flyover bridges to ease traffic congestion in one of the most gridlocked cities in Latin America.
When I asked how the city was simulating the impact of new network designs on urban mobility, the answer was: "We are not simulating anything, our budget is constrained, and there is no political will to solve this problem." I couldn't think of anything else after this meeting. I started thinking about how I could create an easy-to-use tool to simulate urban mobility using open-source data, tools with no subscriptions or licenses, and without data privacy concerns.
My first attempt with FastAPI and React came to an unfortunate halt. Fused allowed me to revisit the idea and easily create an API endpoint and lightweight app I could easily share with anyone.
Find Claudio's UDF code and App associated with the blog post here:
Challenges Building With FastAPI & React
I took on IMP's challenge and, with references like Eclipse's Simulation of Urban MObility (SUMO) app as my guide, I rolled up my sleeves and started building a simulation tool. The synergy between GeoPandas and OSMnx allowed me to create a simple trip simulation based on real-world data and mobility behavior assumptions within days.
However, building the simulation was one thing. I also wanted to share the results interactively in a user-friendly format.
Before learning about Fused, I had set up a backend server with FastAPI and hosted a single generate_trips endpoint that would return GeoJSON data. The problem arose when trying to visualize the output. Downloading GeoJSON files and manually uploading them into tools like Kepler.gl was time-consuming and clunky. To address this I built a React application with Deck.gl, leveraging its TripsLayer to fetch and display streaming data from my API. It worked beautifully on localhost, but deployment costs were a blocker as neither I, as a student, nor the IMP had the budget to host the app. After two months of effort, I ended up with a half-finished tool that I couldn't effectively share. It was time to move on. Or so I thought…
How a Fused UDF Simplified Everything
With Fused, all I had to do was write a Python function and my parallelized streaming service was ready to integrate with a Streamlit application via the App Builder. Here's how I redesigned the workflow as a User Defined Function (UDF) using lessons from my previous project:
- Extracting the Road Network: Using OSMnx, I extracted road networks within a defined Area of Interest (AOI).
- Enriching Data: Each road segment was assigned speed and travel time values.
- Defining Population Data: A 1km² grid with population density and zoning data was loaded into a GeoPandas GeoDataFrame.
- Setting Simulation Parameters:
- Population size: Derived from density data.
- Trips per person: Assumed at 2 trips/day (commute to and from work).
- Origins and Destinations: Residential zones were assigned as homes and commercial zones as workplaces.
- Trip Schedules: Normal probability distributions were used for departure (6-8 AM) and return times (5-7 PM).

With these parameters, the simulation sampled "home" and "work" nodes, calculated start times, and determined the shortest paths between origins and destinations. Async UDF calls made the process parallelized and efficient. The final output was a GeoDataFrame with:
- Start Time (Unix timestamp)
- Trip Type ("home" or "work")
- Path (list of coordinates)
- Timestamps (for each coordinate)
Future Plans
This project is far from over. Here are the features I aim to add to make it a valuable tool for urban planners, especially in resource-constrained settings like Lima:
- Larger AOI Support: Handle bigger datasets and simulate more trips.
- Multimodal Routing: Incorporate walking, biking, driving, and public transit options, akin to OSRM profiles.
- Custom Infrastructure: Allow users to model new transit infrastructure within the OSM road network.
- Mobility Metrics: Provide detailed metrics (e.g., travel times, congestion levels) for each simulation.
With these enhancements, this tool could empower city stakeholders to make data-driven decisions on critical urban interventions—whether it's building flyovers or optimizing public transit routes. The ultimate goal? Improving mobility for over 11 million residents in Lima and beyond.
You can try out the public UDF here
