# Fused Documentation - Complete Reference
> Fused is an end-to-end cloud platform for data analytics, built around User Defined Functions (UDFs): Python functions that can be run via HTTPS requests from anywhere, without any install required.
This comprehensive reference contains the complete text of all Fused documentation, including all API methods, examples, tutorials, and guides.
================================================================================
# GUIDE
## Dependencies
Path: guide/advanced-setup/dependencies.mdx
URL: https://docs.fused.io/guide/advanced-setup/dependencies
# Dependencies
To keep things simple, Fused maintains a single runtime image. This means that any UDF you run will be executed with these dependencies by default
## UDF Dependencies
The Python packages are listed below and can also be found in this public `.txt` file.
Get in touch to have a package added to the list of dependencies or to learn about private runtime images for your organization.
## [BETA] Install your own dependencies
The simplest way to add your own library is to run the dedicated Package Management Fused app. This app allows you to create a different environment and add any module you'd like
You need to make sure you have access to Fused Apps to be able to run this.
[Image: Beta package management app]
You'll then need to import the environment path in your UDF:
```python showLineNumbers
@fused.udf
def udf():
sys.path.append(f"/mount/envs/demo_env/lib/python3.11/site-packages/")
# Logic using your dedicated package
return
```
```
# This file was autogenerated by uv via the following command:
# uv export --frozen --no-emit-project --no-editable --no-default-groups --no-hashes --no-annotate --extra udf --extra ai --no-emit-package fused --no-emit-package job2 -o /home/charles/fused_git/fused-docs/static/requirements_fused.txt
absl-py==2.1.0
access==1.1.9
addict==2.4.0
adlfs==2024.7.0
aenum==3.1.15
affine==2.4.0
aioboto3==13.2.0
aiobotocore==2.15.2
aiocache==0.12.3 ; sys_platform == 'linux'
aiodns==4.0.0
aiofiles==24.1.0
aiohappyeyeballs==2.6.1
aiohttp==3.13.3
aiohttp-client-cache==0.11.1
aiohttp-retry==2.9.1
aioitertools==0.11.0
aiopmtiles @ https://fused-asset.s3.us-west-2.amazonaws.com/wheel/aiopmtiles-0.1.0-py3-none-any.whl ; sys_platform == 'linux'
aiosignal==1.4.0
aiosqlite==0.20.0
albumentations==1.4.0
altair==5.4.1
aniso8601==9.0.1
annotated-doc==0.0.4
annotated-types==0.7.0
anthropic==0.102.0
antlr4-python3-runtime==4.9.3
anyio==4.4.0
anywidget==0.9.13
appdirs==1.4.4
appnope==0.1.4 ; sys_platform == 'darwin'
arcgis==2.4.2
argon2-cffi==23.1.0
argon2-cffi-bindings==21.2.0
arm-pyart==1.19.1
arraylake==0.24.1
arrow==1.4.0
asgiref==3.8.1
asn1crypto==1.5.1
asttokens==2.4.1
async-lru==2.3.0
async-retriever==0.15.2
atpublic==5.0
attrs==24.2.0
azure-core==1.30.2
azure-datalake-store==0.0.53
azure-identity==1.17.1
azure-storage-blob==12.22.0
babel==2.18.0
backcall==0.2.0
backoff==2.2.1
backports-tarfile==1.2.0
backports-zstd==1.3.0 ; platform_python_implementation == 'CPython'
baseten-performance-client==0.1.5
bcrypt==4.2.1
beautifulsoup4==4.12.3
bem-sdk==0.17.0
blake3==1.0.8
bleach==6.1.0
blinker==1.8.2
blosc2==2.7.1
bokeh==3.5.2
boto3==1.35.36
botocore==1.35.36
bottleneck==1.6.0
bqplot==0.12.43
branca==0.7.2
brotli==1.2.0 ; platform_python_implementation == 'CPython'
brotlicffi==1.2.0.0 ; platform_python_implementation != 'CPython'
cachelib==0.9.0
cachetools==5.5.0
cads-api-client==1.3.2
cartopy==0.22.0
cattrs==24.1.1
cbor2==6.0.1
cdsapi==0.7.3
cecil==0.0.22
certifi==2024.8.30
cffi==1.17.1
cfgrib==0.9.14.1
cftime==1.6.4
chardet==5.2.0
charset-normalizer==3.3.2
click==8.1.7
click-plugins==1.1.1
cligj==0.7.2
cloudpickle==3.0.0
cmweather==0.3.2
color-operations==0.1.5
colorama==0.4.6 ; sys_platform == 'win32'
colorcet==3.1.0
coloredlogs==15.0.1
colour==0.1.5
comm==0.2.2
contextily==1.6.2
contourpy==1.3.0
crc32c==2.7.1
cryptography==43.0.1
cssselect2==0.7.0
cycler==0.12.1
cython==3.0.11
cytoolz==0.12.3
dask==2024.12.1
dask-expr==1.1.21
databricks-sdk==0.40.0
dataclasses-json==0.6.7
datasets==3.1.0
datashader==0.16.3
dateparser==1.2.0
daymetpy==1.0.0
daytona==0.176.0
daytona-api-client==0.176.0
daytona-api-client-async==0.176.0
daytona-toolbox-api-client==0.176.0
daytona-toolbox-api-client-async==0.176.0
db-dtypes==1.3.0
debugpy==1.8.5
decorator==5.1.1
defusedxml==0.7.1
deprecated==1.3.1
deprecation==2.1.0
dill==0.3.8
distributed==2024.12.1
distro==1.9.0
dnspython==2.6.1
docker==7.1.0
docopt==0.6.2
docstring-parser==0.17.0
donfig==0.8.1.post1
dropbox==12.0.2
duckdb==1.4.4
e2cnn==0.2.3
earthengine-api==1.4.0
eccodes==2.37.0
eerepr==0.0.4
einops==0.8.2
email-validator==2.2.0
esda==2.6.0
et-xmlfile==1.1.0
evaluate==0.4.3
exactextract==0.2.2
executing==2.1.0
fabric==3.2.2
fastapi==0.135.1
fastjsonschema==2.20.0
fastuuid==0.14.0
ffmpy==0.4.0
filelock==3.16.0
findlibs==0.0.5
fiona==1.10.1
flask==3.0.3
flask-caching==2.3.0
flask-cors==5.0.0
flask-restx==1.3.0
flatbuffers==24.3.25
flexcache==0.3
flexparser==0.3.1
folium==0.17.0
fonttools==4.53.1
fpdf2==2.8.1
fqdn==1.5.1
frozenlist==1.4.1
fsspec==2024.9.0
ftfy==6.2.3
future==1.0.0
gcloud==0.18.3
gcsfs==2024.9.0.post1
gdal @ https://fused-asset.s3.us-west-2.amazonaws.com/wheel/GDAL-3.9.3-cp311-cp311-linux_x86_64.whl ; sys_platform == 'linux'
gdown==5.2.0
geemap==0.35.1
geoai-py==0.35.0
geoarrow-c==0.3.0
geoarrow-pyarrow==0.2.0
geoarrow-types==0.3.0
geocoder==1.38.1
geographiclib==2.0
geojson==3.1.0
geojson2vt==1.0.1
geomet==1.1.0
geopandas==1.0.1
geopy==2.4.1
giddy==2.3.5
gitdb==4.0.11
gitpython==3.1.43
google-api-core==2.19.2
google-api-python-client==2.145.0
google-auth==2.34.0
google-auth-httplib2==0.2.0
google-auth-oauthlib==1.2.1
google-cloud-bigquery==3.25.0
google-cloud-bigquery-storage==2.26.0
google-cloud-compute==1.23.0
google-cloud-core==2.4.1
google-cloud-secret-manager==2.24.0
google-cloud-storage==2.18.2
google-crc32c==1.6.0
google-resumable-media==2.7.2
googleapis-common-protos==1.65.0
gradio==3.35.2
gradio-client==0.15.1
greenlet==3.1.0 ; platform_machine == 'AMD64' or platform_machine == 'WIN32' or platform_machine == 'aarch64' or platform_machine == 'amd64' or platform_machine == 'ppc64le' or platform_machine == 'win32' or platform_machine == 'x86_64'
groundingdino-py==0.4.0
grpc-google-iam-v1==0.14.2
grpcio==1.66.1
grpcio-status==1.66.1
grpclib==0.4.9
gtfs-realtime-bindings==1.0.0
gunicorn==23.0.0
h11==0.14.0
h2==4.3.0
h3==4.4.1
h5netcdf==1.3.0
h5py==3.11.0
herbie-data==2024.8.0
hf-xet==1.5.0 ; platform_machine == 'AMD64' or platform_machine == 'aarch64' or platform_machine == 'amd64' or platform_machine == 'arm64' or platform_machine == 'x86_64'
highspy==1.7.1.dev1
hpack==4.1.0
html5lib==1.1
htmltools==0.6.0
httpcore==1.0.5
httplib2==0.22.0
httpx==0.28.1
httpx-ws==0.7.2
hubspot-api-client==12.0.0
huggingface-hub==1.14.0
humanfriendly==10.0
hydra-core==1.3.2
hydrosignatures==0.15.2
hyperframe==6.1.0
ibis-framework==10.1.0
icechunk==1.1.6
idna==3.8
imageio==2.35.1
imageio-ffmpeg==0.4.9
immutabledict==4.2.0
importlib-metadata==8.5.0
importlib-resources==6.4.5
inequality==1.0.1
inquirerpy==0.3.4
invoke==2.2.0
iopath==0.1.10
ipyevents==2.0.2
ipyfilechooser==0.6.0
ipykernel==6.29.5
ipyleaflet==0.19.2
ipython==8.12.0
ipython-genutils==0.2.0
ipytree==0.2.2
ipyvue==1.11.1
ipyvuetify==1.10.0
ipywidgets==7.8.4
isodate==0.6.1
isoduration==20.11.0
itsdangerous==2.2.0
jakteristics==0.6.2
jaraco-classes==3.4.0
jaraco-context==6.0.1
jaraco-functools==4.0.2
jaxa-earth @ https://data.earth.jaxa.jp/api/python/v0.1.3/en/_downloads/5c4ffbb11cde280d906707699d6219d0/jaxa-earth-0.1.3.zip ; sys_platform == 'linux'
jedi==0.19.1
jeepney==0.8.0 ; sys_platform == 'linux'
jellyfish==1.1.2
jinja2==3.1.6
jiter==0.12.0
jmespath==1.0.1
joblib==1.4.2
jplephem==2.22
jpype1==1.5.0
json5==0.13.0
jsonargparse==4.47.0
jsonpointer==3.1.0
jsonschema==4.23.0
jsonschema-specifications==2023.12.1
jupyter-client==8.8.0
jupyter-core==5.7.2
jupyter-events==0.12.0
jupyter-leaflet==0.19.2
jupyter-lsp==2.3.0
jupyter-server==2.17.0
jupyter-server-proxy==4.4.0
jupyter-server-terminals==0.5.4
jupyterlab==4.5.6
jupyterlab-pygments==0.3.0
jupyterlab-server==2.28.0
jupyterlab-widgets==1.1.10
keplergl==0.3.2
keyring==25.3.0
kiwisolver==1.4.7
kornia==0.8.2
kornia-rs==0.1.10
lancedb==0.24.1
lark==0.12.0
laspy==2.5.4
lat-lon-parser==1.3.0
lazy-loader==0.4
leafmap==0.61.0
libcst==1.8.6
libpysal==4.12.1
lightly==1.5.22
lightly-utils==0.0.2
lightning==2.6.1
lightning-utilities==0.15.3
line-profiler==4.2.0
linkify-it-py==2.0.3
linopy==0.5.8
litellm==1.81.0
llvmlite==0.45.1
localtileserver==0.10.3
locket==1.0.0
loguru==0.7.3
lxml==5.3.0
lz4==4.3.3
mahotas @ git+https://github.com/jasonzutty/mahotas@6aa4be01807f9eac476636ac86bf79a09da426b5
mangum==0.17.0
mapbox-vector-tile==2.1.0
mapclassify==2.8.0
maplibre==0.2.7
markdown-it-py==2.2.0
markdown2==2.5.1
markupsafe==2.1.5
marshmallow==3.22.0
matplotlib==3.9.2
matplotlib-inline==0.1.7
maxar-platform==1.0.6
mda-xdrlib==0.2.0
mdit-py-plugins==0.3.3
mdurl==0.1.2
mercantile==1.2.1
mgwr==2.2.1
mistune==3.0.2
mlflow-skinny==2.19.0
mmcv==2.2.0
mmdet==3.3.0
mmengine==0.10.7
mmrotate==1.0.0rc1
modal==1.4.2
momepy==0.8.0
more-itertools==10.5.0
morecantile==5.4.2
movingpandas==0.20.0
mpmath==1.3.0
msal==1.31.0
msal-extensions==1.2.0
msgpack==1.1.0
multidict==6.1.0
multipledispatch==1.0.0
multiprocess==0.70.16
multiurl==0.3.1
mypy-extensions==1.0.0
narwhals==1.7.0
nbclient==0.10.0
nbconvert==7.16.4
nbformat==5.10.4
ndindex==1.8
nest-asyncio==1.6.0
netcdf4==1.7.1.post2
networkx==3.3
nltk==3.9.1
notebook==7.5.5
notebook-shim==0.2.4
notion-client==3.0.0
numba==0.62.1
numcodecs==0.16.1
numexpr==2.10.1
numpy==2.3.4
nvidia-nccl-cu12==2.22.3 ; platform_machine != 'aarch64' and sys_platform == 'linux'
oauth2client==4.1.3
oauthlib==3.2.2
obstore==0.8.2
odc-geo==0.4.8
odc-stac==0.3.10
omegaconf==2.3.0
onnx==1.16.2
onnxruntime==1.19.2
open-radar-data==0.3.1
openai==2.37.0
openai-clip==1.0.1
opencv-python==4.10.0.84
opencv-python-headless==4.8.1.78
openpyxl==3.1.5
opentelemetry-api==1.42.0
opentelemetry-exporter-otlp-proto-common==1.42.0
opentelemetry-exporter-otlp-proto-http==1.42.0
opentelemetry-instrumentation==0.63b0
opentelemetry-instrumentation-aiohttp-client==0.63b0
opentelemetry-proto==1.42.0
opentelemetry-sdk==1.42.0
opentelemetry-semantic-conventions==0.63b0
opentelemetry-util-http==0.63b0
orjson==3.10.7
ortools==9.10.4067
osm2geojson==0.2.5
osmnet==0.1.7
osmnx==1.9.3
osmpythontools==0.3.5
oso-cloud==1.5.1
overpass==0.7.2
overrides==7.7.0
overturemaps==0.18.0
owslib==0.29.3
packaging==24.1
palettable==3.3.3
pandana==0.7
pandas==2.2.3
pandocfilters==1.5.1
param==2.1.1
paramiko==3.5.0
parso==0.8.4
parsy==2.1
partd==1.4.2
pathspec==0.12.1
patool==2.4.0
patsy==0.5.6
pdal @ https://fused-asset.s3.us-west-2.amazonaws.com/wheel/pdal-3.5.3-cp311-cp311-linux_x86_64.whl ; sys_platform == 'linux'
pendulum==3.0.0
pexpect==4.9.0 ; sys_platform != 'win32'
pfzy==0.3.4
pickleshare==0.7.5
pillow==10.4.0
pint==0.24.3
placekey==0.0.33
planet==2.10.0
planetary-computer==1.0.0
platformdirs==4.3.2
plotly==5.24.0
ply==3.8
pmtiles==3.4.1
pointpats==2.5.0
polars==1.31.0
pooch==1.8.2
portalocker==2.10.1
prometheus-client==0.20.0
prometheus-fastapi-instrumentator==6.1.0
prompt-toolkit==3.0.47
propcache==0.4.1
proto-plus==1.24.0
protobuf==5.28.0
psutil==6.0.0
psycopg2-binary==2.9.10
psygnal==0.11.1
ptyprocess==0.7.0 ; os_name != 'nt' or sys_platform != 'win32'
pulp==2.9.0
pure-eval==0.2.3
puremagic==1.27
py-cpuinfo==9.0.0
py3dep==0.15.2
pyarrow==20.0.0
pyarrow-hotfix==0.6
pyasn1==0.6.1
pyasn1-modules==0.4.1
pybdshadow==0.3.5
pycares==5.0.1
pyclipper==1.3.0.post5
pycocotools==2.0.8
pycparser==2.22
pyct==0.5.0
pydantic==2.11.10
pydantic-core==2.33.2
pydantic-settings==2.5.2
pydata-google-auth==1.8.2
pydaymet==0.15.2
pydeck==0.9.1
pydub==0.25.1
pydyf==0.11.0
pyexiftool==0.5.6
pygeofilter==0.2.4
pygeohydro==0.15.2
pygeoif==1.5.0
pygeoogc==0.15.2
pygeoutils==0.15.2
pygments==2.18.0
pygrib==2.1.6
pygtfs==0.1.9
pyjwt==2.9.0
pykalman==0.9.7
pylerc==4.0
pynacl==1.5.0
pynhd==0.15.2
pynldas2==0.15.2
pyogrio==0.11.1
pyomo==6.6.1
pyopenssl==24.2.1
pyparsing==3.1.4
pyperclip==1.9.0
pyphen==0.15.0
pyproj==3.6.1
pypsa==0.28.0
pyreadline3==3.5.4 ; sys_platform == 'win32'
pysal==24.7
pyshp==2.3.1
pysocks==1.7.1
pyspnego==0.11.1
pystac==1.10.1
pystac-client==0.7.7
python-box==7.2.0
python-dateutil==2.9.0.post0
python-docx==1.2.0
python-dotenv==1.0.1
python-json-logger==4.0.0
python-multipart==0.0.29
python-on-whales==0.81.0
pytorch-lightning==2.6.1
pytz==2024.2
pywbt==0.2.4
pywin32==310 ; sys_platform == 'win32'
pywin32-ctypes==0.2.3 ; sys_platform == 'win32'
pywinpty==2.0.15 ; os_name == 'nt' and sys_platform != 'darwin' and sys_platform != 'linux'
pyyaml==6.0.2
pyzmq==26.2.0
quantecon==0.7.2
qudida==0.0.4
questionary==2.1.0 ; sys_platform != 'emscripten'
radops==0.12.0
rarfile==4.2
rasterio==1.3.11
rasterstats==0.19.0
ratelim==0.1.6
ratelimit==2.2.1
referencing==0.35.1
regex==2026.4.4
reportlab==4.2.5
requests==2.32.5
requests-cache==1.2.1
requests-file==2.1.0
requests-oauthlib==2.0.0
requests-toolbelt==1.0.0
retrying==1.3.4
rfc3339-validator==0.1.4
rfc3986-validator==0.1.1
rich==13.8.1
rich-click==1.9.7
rio-cogeo==5.3.4
rio-mbtiles @ https://fused-asset.s3.us-west-2.amazonaws.com/wheel/rio_mbtiles-1.6.0-py3-none-any.whl ; sys_platform == 'linux'
rio-stac==0.8.1
rio-tiler==6.7.0
rioxarray==0.15.7
rouge-score==0.1.2
rpds-py==0.20.0
rpy2==3.5.16
rsa==4.9
rtoml==0.9.0
rtree==1.3.0
ruamel-yaml==0.18.6
ruamel-yaml-clib==0.2.8 ; platform_python_implementation == 'CPython'
ruff==0.15.12
s2geometry @ https://fused-asset.s3.us-west-2.amazonaws.com/wheel/s2geometry-0.9.0-cp311-cp311-linux_x86_64.whl ; sys_platform == 'linux'
s3fs==2024.9.0
s3transfer==0.10.4
safetensors==0.4.5
sam2==0.4.1
scikit-image==0.26.0
scikit-learn==1.8.0
scipy==1.16.3
scooby==0.10.0
seaborn==0.13.2
secretstorage==3.3.3 ; sys_platform == 'linux'
segment-anything-fast==0.1.2
segment-anything-hq==0.3
segment-anything-py==1.0.1
segment-geospatial==0.10.8
segmentation-models-pytorch==0.5.0
segregation==2.5
semantic-version==2.10.0
send2trash==1.8.3
sentence-transformers==5.4.1
sentinelhub==3.11.3
server-thread==0.2.0
setuptools==80.9.0
sgp4==2.23
shap==0.45.1
shapely==2.0.6
shellingham==1.5.4
shiny==1.1.0
simpervisor==1.0.0
simple-salesforce==1.12.6
simplejson==3.19.3
six==1.16.0
skyfield==1.49
slicer==0.0.8
smmap==5.0.1
smoothify==0.2.1
sniffio==1.3.1
snowflake-connector-python==3.12.1
snuggs==1.4.7
sortedcontainers==2.4.0
soupsieve==2.6
spaghetti==1.7.6
spglm==1.1.0
spherely==0.1.0
spint==1.0.7
splot==1.1.7
spopt==0.6.1
spreg==1.6.1
spvcm==0.3.0
sqlalchemy==2.0.34
sqlglot==25.18.0
sqlparse==0.5.3
sspilib==0.3.1 ; sys_platform == 'win32'
stac-geoparquet==0.3.2
stack-data==0.6.3
stackstac==0.5.1
stacrs @ https://fused-asset.s3.us-west-2.amazonaws.com/wheel/stacrs-0.2.0-cp311-cp311-manylinux_2_31_x86_64.whl ; sys_platform == 'linux'
starlette==1.1.0
statsmodels==0.14.2
stone==3.3.1
structlog==24.4.0
suncalc==0.1.3
supermercado==0.2.0 ; sys_platform == 'linux'
supervision==0.6.0
sympy==1.13.2 ; sys_platform != 'darwin' and sys_platform != 'emscripten'
sympy==1.14.0 ; sys_platform == 'darwin' or sys_platform == 'emscripten'
synchronicity==0.12.2
tables==3.10.1
tabula-py==2.9.3
tabulate==0.10.0
tblib==3.0.0
tenacity==9.1.4
termcolor==3.3.0
terminado==0.18.1
terminaltables==3.1.10
threadpoolctl==3.5.0
thriftpy2==0.5.3
tifffile==2024.8.30
tiktoken==0.12.0
tiledb==0.27.1
time-machine==2.16.0 ; implementation_name != 'pypy'
timm==1.0.9
tinycss2==1.4.0
tinyhtml5==2.0.0
tobler==0.11.3
tokenizers==0.22.2
toml==0.10.2
tomli==2.0.1
tomli-w==1.0.0
tomlkit==0.13.2
toolz==0.12.1
topojson==1.9
torch @ https://download.pytorch.org/whl/cpu/torch-2.4.0%2Bcpu-cp311-cp311-linux_x86_64.whl ; sys_platform != 'darwin' and sys_platform != 'emscripten'
torch==2.7.1 ; sys_platform == 'darwin' or sys_platform == 'emscripten'
torchgeo==0.7.2
torchinfo==1.8.0
torchmetrics==1.9.0
torchsr==1.0.4
torchvision @ https://download.pytorch.org/whl/cpu/torchvision-0.19.0%2Bcpu-cp311-cp311-linux_x86_64.whl ; sys_platform != 'darwin' and sys_platform != 'emscripten'
torchvision==0.22.1 ; sys_platform == 'darwin' or sys_platform == 'emscripten'
tornado==6.4.1
tqdm==4.67.1
traitlets==5.14.3
traittypes==0.2.1
transbigdata==0.5.3
transformers==5.8.0
truss==0.18.1
truss-transfer==0.0.42
truststore==0.10.4
typer==0.23.1
types-certifi==2021.10.8.3
types-toml==0.10.8.20260408
typeshed-client==2.9.0
typing-extensions==4.15.0
typing-inspect==0.9.0
typing-inspection==0.4.2
tzdata==2024.1
tzlocal==5.2
uc-micro-py==1.0.3
ujson==5.10.0
ultralytics==8.0.122
uri-template==1.3.0
uritemplate==4.1.1
url-normalize==1.4.3
urllib3==2.6.3
urlpath==1.2.0
us==3.2.0
utm==0.7.0
uvicorn==0.18.3
validators==0.34.0
valor-lite==0.34.0
vega-datasets==0.9.0
vt2geojson==0.2.1
watchfiles==0.19.0
wcwidth==0.2.13
weasyprint==63.0
webcolors==25.10.0
webencodings==0.5.1
websocket-client==1.8.0
websockets==11.0.3
werkzeug==3.0.4
whitebox==2.3.5
whitebox-workflows==1.3.5
whiteboxgui==2.3.0
widgetsnbextension==3.6.9
win32-setctime==1.2.0 ; sys_platform == 'win32'
wrapt==1.16.0
wsproto==1.2.0
xarray==2025.10.1
xarray-datatree==0.0.14
xarray-spatial==0.3.5
xee==0.0.4
xgboost==2.1.1
xmltodict==0.13.0
xradar==0.6.5
xxhash==3.5.0
xyzservices==2024.9.0
yapf==0.40.2
yarl==1.22.0
zarr==3.1.3
zeep==4.2.1
zict==3.0.0
zipp==3.20.1
zopfli==0.2.3.post1
```
================================================================================
## Secrets management
Path: guide/advanced-setup/environment-variables.mdx
URL: https://docs.fused.io/guide/advanced-setup/secrets-management
Fused provides a built-in secrets manager to securely store and access sensitive credentials like API keys, database passwords, and tokens. Both types of secrets require a paid plan. There are two kinds of secrets:
- **Team secrets** (`fused.secrets`) — scoped to your team and accessible to everyone in your team.
- **User secrets** (`fused.user_secrets`) — owned and accessible only by the authenticated user.
## Storing secrets
Open the **Integrations & secrets** modal in Workbench:
- From the **home** sidebar, click **Integrations & secrets** under your user section.
- From inside a **canvas**, open the overflow menu and select **Integrations & secrets**.
The modal is organized into **Personal integrations** and **Team integrations**.
Each integration contains expandable rows for secrets (e.g. Google Drive, Dropbox, Notion).
To manage secrets, first expand the relevant integration row, then click **Add new secret** inside the expanded section.
## Team secrets — `fused.secrets`
Team secrets are scoped to the execution environment (kernel) and shared across your team or organization. Use `fused.secrets` to read, write, and delete them:
```python
@fused.udf
def udf():
api_key = fused.secrets["OPENAI_API_KEY"]
client = openai.OpenAI(api_key=api_key)
...
```
You can also manage team secrets programmatically:
```python
@fused.udf
def udf():
fused.secrets["MY_KEY"] = "value"
del fused.secrets["MY_KEY"]
dir(fused.secrets)
```
## User secrets — `fused.user_secrets`
User secrets are owned by the authenticated user.
User secrets are read-only in the SDK. To create, update, or delete user secrets, use the Workbench UI under **Integrations & secrets**.
```python
@fused.udf
def udf():
val = fused.user_secrets["MY_KEY"]
# or
val = fused.user_secrets.MY_KEY
...
```
To list all user secret keys:
```python
@fused.udf
def udf():
keys = list(fused.user_secrets)
...
```
## How secrets are secured
All secrets are stored in AWS Secrets Manager, which encrypts secret values at rest and in transit.
- **Team secrets** are each protected by a dedicated AWS KMS encryption key. IAM policies restrict access so that only the specific execution environment that owns a secret can decrypt it.
- **User secrets** are encrypted at rest using AWS-managed encryption keys within Secrets Manager.
- Secrets are never written to disk in plaintext or included in logs.
- Access is authenticated and authorized through Fused's API layer — secrets are only decrypted at the moment they are read by your UDF code.
## Security notes
- Team secrets added to Fused are accessible by anyone in your team.
- User secrets are private to the authenticated user.
- Never print or return secret values from UDFs — anyone calling the UDF could otherwise read them. This applies to both `fused.secrets` and `fused.user_secrets`.
- Use secrets instead of `.env` files to keep credentials out of your codebase.
For more on writing UDFs securely, see Security best practices.
================================================================================
## Git Integration
Path: guide/advanced-setup/git-integration.mdx
URL: https://docs.fused.io/guide/advanced-setup/git-integration
Github integration allows you to:
- Commit your code to Fused public & community repositories for anyone to use!
- Saving & Versioning of UDFs
- Collaboration across teams (for Developer, Professional and Enterprise users)
## Connecting your own repositories
Developer, Professional and Enterprise _Integrating private repositories is accessible to organizations with a Fused Developer, Professional & Enterprise subscription (see Plans)._
Fused Github integration plugs directly into your own repositories.
### Configuring Github integration
1. Create a new Github repository. There's no enforced repo structure because Fused scans the entire repo for UDFs, although the Public UDFs repo may serve as guideline.
2. Install the Fused GitHub app for your organization. Navigate to this GitHub URL, click "Configure", and select the GitHub organization that contains the repository.
[Image: install fused github]
3. Scope the app to the target repository. It's recommended to select only the specific repo.
[Image: install fused github 2]
4. Once the above is complete, please reach out to the Fused team to finish setup (`info@fused.io`):
- Provide Fused team with your Github path & name: `some-organization/some-repo`. (Example: `fusedio/udfs`)
5. Confirm the integration is enabled by checking that repo UDFs appear under the "Team UDFs" tab in the UDF Explorer.
You can see all the repositories you have access to in the Versions Tab:
[Image: Github Versions Tab]
## Next Steps
- Version Control — how to version control your UDFs
================================================================================
## Python installation
Path: guide/advanced-setup/local-installation.mdx
URL: https://docs.fused.io/guide/advanced-setup/local-installation
# Python installation
Install and set up the Fused Python SDK on your local machine.
This section is only for local environments outside of Fused. If you're working in Workbench, `fused` is already installed for you.
> The latest version of `fused` is .
Installing `fused` is required if you're running Fused locally or in a development environment. If you're working in Workbench, `fused` is already installed for you.
## Install
**Python Version:** 3.10+
```bash
pip install "fused[all]"
```
1. Set up a Python environment:
```bash
python3 -m venv .venv
source .venv/bin/activate
```
2. Install the `fused` package:
```bash
# Base package only
pip install fused
# For raster data processing
pip install "fused[raster]"
# For vector data processing
pip install "fused[vector]"
# All optional dependencies (recommended)
pip install "fused[all]"
```
## Log out
Log out the current user. This deletes the credentials saved to disk.
```python
fused.api.logout()
```
## Get Bearer token
Get your account's Bearer (Access) token for authenticating API requests.
```python
fused.api.access_token()
```
Do not share your Bearer token. It allows impersonation of your account.
## See also
The same `fused` package also provides a CLI for managing canvases, running UDFs, and more from the terminal. See the CLI Reference.
## Quick test
Verify your installation works:
```python
@fused.udf
def my_udf():
return "Hello from Fused!"
my_udf()
```
================================================================================
## On-Prem Setup
Path: guide/advanced-setup/on-prem-setup.mdx
URL: https://docs.fused.io/guide/advanced-setup/on-prem-setup
# On-Prem Setup
Fused offers an on-premise deployment option for enterprise customers who need to keep data behind their own firewall. An on-prem deployment gives you the full Fused platform — Workbench, the Python SDK, HTTPS endpoints, and serverless UDF execution — running entirely inside your AWS account.
## Benefits
| Benefit | Details |
|---------|---------|
| **Unlimited compute & storage** | Scale EC2 and S3 resources to match your workloads without per-seat or per-run caps. |
| **Data sovereignty** | Data never leaves your VPC. Meet internal compliance, HIPAA, SOC 2, or other regulatory requirements. |
| **Infrastructure integration** | Connect to private databases, internal APIs, and existing data lakes without exposing them to the public internet. |
| **Single sign-on (SSO)** | Authenticate through your existing identity provider (Okta, Azure AD, etc.) for seamless team onboarding. |
| **Network isolation** | Deploy behind your own firewall, VPN, or AWS PrivateLink for end-to-end network control. |
| **Multi-region deployment** | Deploy Fused in multiple regions to achieve global availability and reduce latency. |
| **Multi-tenant deployment** | Deploy Fused to multiple teams within your organization. |
## Requirements
Before provisioning, make sure the following are in place:
1. **Enterprise agreement** — An active enterprise customer agreement with Fused. Contact the Fused team if you don't have one yet.
2. **Dedicated AWS account** — An AWS account with IAM administrator access. We strongly recommend using an account dedicated to Fused so that permissions and billing stay isolated.
3. **Region selection** — Choose the AWS region where your data already lives to minimize latency and cross-region transfer costs.
Your Fused solutions engineer will walk you through the provisioning process and provide the exact requirements for your organization.
## See also
- Amazon S3 integration — connect S3 buckets, including SSE-KMS encrypted buckets
- Python installation — install the Fused SDK locally
- Secrets Management — store credentials securely
- Write UDFs securely — best practices for handling sensitive data
================================================================================
## Service Accounts
Path: guide/advanced-setup/service-accounts.mdx
URL: https://docs.fused.io/guide/advanced-setup/service-accounts
# Service Accounts
A **service account** is a non-interactive credential for machine-to-machine access to Fused. Where your personal login goes through a browser-based sign-in, a service account is a long-lived token that a program presents directly — no browser, no user session. The token authenticates as your team's environment rather than as an individual user.
Use a service account when a system needs to call Fused without a person present:
- **CI/CD pipelines** — run UDFs or invalidate caches as part of a deploy.
- **Backend services** — mint short-lived session tokens so your product can embed team-only UDFs.
- **Cron jobs and other automation** — scheduled tasks that call the Fused API, such as cache invalidation.
- **Headless servers** — any environment where interactive login is impossible.
Service accounts sit alongside the other credentials you may have met:
| Credential | What it is | Typical use |
|---|---|---|
| Personal login | Browser sign-in via Workbench or the Python SDK | Interactive development |
| Canvas shared token (`fc_…`) | Per-canvas token in shared UDF URLs | Calling shared UDF endpoints over HTTPS |
| Session token | Short-lived token minted for a team-only canvas | Embedding team-only UDFs in external apps |
| **Service account token** | Long-lived machine credential for your team's environment | Automation: CI/CD, backends, cron |
## Creating a service account
Create service accounts from the Integrations & Secrets page in Workbench:
1. Open **Integrations & Secrets** from the Workbench sidebar. If you're already inside a canvas, use **Quick Actions** (`Ctrl+K`) and search for "Integrations & secrets".
2. Under **Service accounts**, click **+ Create service account**.
3. Give the service account a name and click **Create**.
Your service account token is shown **only once**, at creation. Copy it to a secure location — a secrets manager or your CI system's secret store. Never share it publicly or commit it to version control.
Name each service account after the system that will use it (for example `ci-deploy` or `prod-embed-backend`). One service account per system means you can revoke any one of them without breaking the others.
## Using a service account with the Python SDK
The Python SDK picks up a service account token from two environment variables, checked before any saved login or interactive sign-in:
```bash
```
With both variables set, every SDK call authenticates as the service account:
```python
# Authenticates via FUSED_AUTH_TOKEN — no interactive login
my_udf = fused.load("team/my_udf")
result = my_udf()
```
This also applies to the `fused` CLI, which uses the same credential chain as the SDK.
A service account authenticates as your team's **environment**, not as a user. Operations that act on behalf of a user — such as creating or pushing canvases (`fused canvas push`) — require a personal login and fail with an authentication error under a service account. Use a service account to run UDFs and call environment-scoped APIs.
In a CI system, store the token as a secret and expose it to the job. For example, in GitHub Actions:
```yaml
jobs:
run-udf:
runs-on: ubuntu-latest
env:
FUSED_AUTH_TOKEN_TYPE: Fused-Service-Token
FUSED_AUTH_TOKEN: $}
steps:
- run: pip install fused
- run: python -c "import fused; print(fused.load('team/my_udf')())"
```
Running these examples requires a real service account token — create one first.
## Using a service account with the REST API
For callers outside Python, pass the token in the `Authorization` header using the `Fused-Service-Token` scheme:
```
Authorization: Fused-Service-Token
```
The service account can then call Fused API endpoints on behalf of your team's environment. Two common flows:
**Minting session tokens** — the embed flow for team-only canvases. Your backend exchanges the service account token for a short-lived session token that is safe to hand to a browser:
```bash
curl -X POST \
-H "Authorization: Fused-Service-Token $FUSED_SERVICE_ACCOUNT_TOKEN" \
-H "Content-Type: application/json" \
-d '' \
"https://www.fused.io/server/v1/session-token/by-access-token/"
```
The `ttl` is in seconds — it defaults to 3600 (1 hour) and can be at most 86400 (24 hours). The response includes the `session_token` and its `expires_at` time. See Securing Shared Tokens for the full embed authentication flow, including a Python version of this request.
**Cache invalidation** — refresh cached UDF results from CI/CD or a cron job, authenticated with the same header. See Cache invalidation for the endpoint and examples.
The same `Authorization` header authenticates the service account to other Fused REST API endpoints as well — any operation available to your team's environment, such as loading UDFs or running them over HTTP. Endpoints that act on behalf of a user (for example creating or updating canvases) require a personal login.
## Managing and revoking service accounts
The **Service accounts** section of Integrations & Secrets lists your team's existing service accounts with their names and creation dates. The token itself is not retrievable after creation — if a token is lost, create a new service account.
To revoke a service account, delete it from the same page.
To rotate a service account, create a new service account, move consumers to the new token, then delete the old one.
Deleting a service account invalidates its token immediately. Any system still using it will start failing with authentication errors.
## Security best practices
- **Store the token as a secret.** Use a secrets manager or your CI system's secret store — never code, docs, or version control. If you need the token inside a UDF, store it with Fused secrets management.
- **One service account per system.** A leaked or decommissioned integration then only requires revoking one token.
- **Never ship the service account token to a client.** Browsers and client apps should only ever receive short-lived session tokens minted by your backend.
- **Treat it as a team-level credential.** A service account authenticates as your team's environment, not as an individual user — anyone holding the token can act with that access.
## See also
- REST API — the HTTP surface behind the Python SDK, and how to authenticate against it
- Securing Shared Tokens — session tokens for team-only canvases and the embed authentication flow
- Cache invalidation — HTTP cache invalidation authenticated with a service account
- Integrations & Secrets — the Workbench page where service accounts are created
- Secrets management — storing tokens and other credentials securely
================================================================================
## Data Formats
Path: guide/data-input-outputs/data-formats-snippets.mdx
URL: https://docs.fused.io/guide/data-input-outputs/data-formats-snippets
# Data Formats Quick Reference
Quick code snippets for reading and writing common data formats in Fused.
---
## Tables
### CSV
```python
# Read
df = pd.read_csv("s3://bucket/data.csv")
# Write
df.to_csv("s3://fused-users/fused/aman/my-data/output.csv", index=False) # change to your own path
```
### Parquet
```python
# Read
df = pd.read_parquet("s3://bucket/data.parquet")
# Write
df.to_parquet("s3://fused-users/fused/aman/my-data/output.parquet") # change to your own path
```
### Excel
```python
# Read
df = pd.read_excel("s3://bucket/data.xlsx")
```
### JSON
```python
# Read
df = pd.read_json("s3://bucket/data.json")
# Write
df.to_json("s3://fused-users/fused/aman/my-data/output.json") # change to your own path
```
---
## Geospatial Tables
### GeoParquet
```python
# Read
gdf = gpd.read_parquet("s3://bucket/data.parquet")
# Write
gdf.to_parquet("s3://fused-users/fused/aman/my-data/output.parquet") # change to your own path
```
### GeoJSON
```python
# Read
gdf = gpd.read_file("https://example.com/data.geojson")
# Write
gdf.to_file("s3://fused-users/fused/aman/my-data/output.geojson", driver="GeoJSON") # change to your own path
```
### Shapefile (zipped)
```python
# Read from URL
gdf = gpd.read_file("https://example.com/data.zip")
# Read from S3
gdf = gpd.read_file("s3://bucket/data.zip")
```
---
## Raster Images
### GeoTIFF / Cloud Optimized GeoTIFF (COG)
```python
# Using Fused common utils
common = fused.load("https://github.com/fusedio/udfs/tree/main/public/common/")
arr = common.read_tiff(tile, "s3://bucket/image.tif")
```
```python
# Using rasterio directly
with rasterio.open("s3://bucket/image.tif") as src:
arr = src.read()
```
### PNG/JPEG
```python
from PIL import Image
from io import BytesIO
response = requests.get("https://example.com/image.png")
img = Image.open(BytesIO(response.content))
```
---
## Cloud Storage Paths
| Provider | Format | Example |
|----------|--------|---------|
| AWS S3 | `s3://` | `s3://bucket-name/path/file.parquet` |
| Google Cloud | `gs://` or `gcs://` | `gs://bucket-name/path/file.parquet` |
| Azure | `az://` | `az://container/path/file.parquet` |
| HTTP(S) | `https://` | `https://example.com/file.csv` |
---
## STAC Catalogs
```python
# Connect to STAC catalog
catalog = pystac_client.Client.open("https://earth-search.aws.element84.com/v1")
# Search for items
items = catalog.search(
collections=["sentinel-2-l2a"],
bbox=[-122.5, 37.5, -122.0, 38.0],
datetime="2023-01-01/2023-12-31"
).item_collection()
# Load with odc.stac
ds = odc.stac.load(items, bands=["red", "green", "blue"])
```
---
## DuckDB Queries
```python
common = fused.load("https://github.com/fusedio/udfs/tree/main/public/common/")
con = common.duckdb_connect()
# Query S3 directly
df = con.sql("""
SELECT * FROM read_parquet('s3://bucket/data.parquet')
WHERE value > 100
LIMIT 1000
""").df()
```
---
## Recommended Formats
| Data Type | Recommended Format | Why |
|-----------|-------------------|-----|
| Tables | **Parquet** | Columnar, compressed, fast |
| Geospatial tables | **GeoParquet** | Spatial indexing, cloud-native |
| Raster images | **Cloud Optimized GeoTIFF** | Tiled, overviews, partial reads |
| Large datasets | **Partitioned GeoParquet** | Use `fused.ingest()` |
For large datasets (>1GB), use `fused.ingest()` to create optimized, partitioned files.
================================================================================
## Audit Logs
Path: guide/data-input-outputs/export-api/audit-logs.mdx
URL: https://docs.fused.io/guide/data-input-outputs/export-api/audit-logs
# `fused.api.log` -- Audit Logs
`fused.api.log()` retrieves audit logs for UDF executions. Every time a UDF runs, the system records metadata about the execution including which UDF ran, who ran it, how long it took, and any stdout/stderr output.
## Function Signature
```python
# doctest: skip
fused.api.log(
id: str | None = None,
*,
udf_id: str | None = None,
udf_name: str | None = None,
shared_token: str | None = None,
exec_env: bool = False,
distinct: bool = False,
distinct_type: Literal["names", "ids"] | None = None,
start_timestamp: str | None = None,
end_timestamp: str | None = None,
limit: int = 100,
scan_forward: bool = True,
page_token: str | None = None,
max_records_to_scan: int = 1000,
) -> dict[str, Any]
```
## Parameters
### Filters
Only **one** of `id`, `udf_id`, `udf_name`, or `shared_token` may be specified. If none are provided, logs for the authenticated user are returned.
| Parameter | Type | Default | Description |
|---|---|---|---|
| `id` | `str \| None` | `None` | Fetch a single audit log record by its unique ID. When set, all other filters are ignored. |
| `udf_id` | `str \| None` | `None` | Filter logs by the UDF's unique ID (UUID). |
| `udf_name` | `str \| None` | `None` | Filter logs by UDF slug/name. |
| `shared_token` | `str \| None` | `None` | Filter logs by shared token (for UDFs accessed via shared links). |
| `exec_env` | `bool` | `False` | If `True`, scope logs to the authenticated user's execution environment rather than their user email. Useful for team/org-level queries. |
### Distinct Queries
| Parameter | Type | Default | Description |
|---|---|---|---|
| `distinct` | `bool` | `False` | If `True`, return one record per unique UDF (deduplicated), keeping the most recent execution for each. Requires `distinct_type`. |
| `distinct_type` | `"names" \| "ids" \| None` | `None` | When `distinct=True`: `"names"` deduplicates by `udf_name`, `"ids"` deduplicates by `udf_id`. |
### Time Range
| Parameter | Type | Default | Description |
|---|---|---|---|
| `start_timestamp` | `str \| None` | `None` | Inclusive start of the time range (ISO 8601 format, e.g. `"2025-04-01T00:00:00+00:00"`). |
| `end_timestamp` | `str \| None` | `None` | Inclusive end of the time range (ISO 8601 format). |
### Pagination & Ordering
| Parameter | Type | Default | Description |
|---|---|---|---|
| `limit` | `int` | `100` | Maximum records per page (max 300). Used for regular (non-distinct) queries. |
| `scan_forward` | `bool` | `True` | `True` = oldest first, `False` = newest first. |
| `page_token` | `str \| None` | `None` | Pagination token from a previous response's `next_page_token`. |
| `max_records_to_scan` | `int` | `1000` | Maximum raw records the server scans before deduplicating (max 5000). Only used for distinct queries. |
## Return Value
All calls return a dictionary with this structure:
```python
```
> **Note:** Distinct queries always return `next_page_token: None` -- the server handles internal pagination and returns the full deduplicated result in one response.
## Audit Log Record Fields
Each record in `items` is a dictionary with these fields:
| Field | Type | Description |
|---|---|---|
| `id` | `str` | Unique record ID (UUID). |
| `timestamp` | `str` | ISO 8601 timestamp of the execution. |
| `exec_env_id` | `str` | Execution environment ID. |
| `user_id` | `str` | User ID who triggered the execution. |
| `user_email` | `str` | User email who triggered the execution. |
| `udf_id` | `str` | UDF unique ID. |
| `udf_name` | `str` | UDF slug/name. |
| `execution_engine` | `str` | Engine used (e.g. `"realtime"`). |
| `execution_time` | `float` | Execution duration in seconds. `None` if the execution didn't complete. |
| `cache` | `bool` | `True` if result was served from cache, `False` if not. |
| `stdout` | `str` | Captured standard output from the UDF execution. |
| `stderr` | `str` | Captured standard error from the UDF execution. Non-empty typically indicates a failure. |
| `udf_data` | `str` | The UDF code/payload that was executed. |
| `shared_token` | `str` | Shared token, if the UDF was accessed via a shared link. |
| `client_ip` | `str` | IP address of the caller. |
All fields except `id` and `timestamp` may be absent or `None` depending on the execution context.
## Query Modes
### 1. All Logs for Authenticated User
Returns logs associated with your user email.
```python
result = fused.api.log()
```
### 2. Logs Scoped to Execution Environment
Returns logs for all users in your execution environment (team/org level).
```python
result = fused.api.log(exec_env=True)
```
### 3. Lookup by Record ID
Fetch a single record directly.
```python
result = fused.api.log(id="")
```
### 4. Filter by UDF ID
```python
result = fused.api.log(udf_id="")
```
### 5. Filter by UDF Name
```python
result = fused.api.log(udf_name="my_udf")
```
### 6. Filter by Shared Token
```python
result = fused.api.log(shared_token="")
```
### 7. Distinct UDF Names
One record per unique UDF name, most recent execution kept.
```python
result = fused.api.log(distinct=True, distinct_type="names")
```
### 8. Distinct UDF IDs
One record per unique UDF ID, most recent execution kept.
```python
result = fused.api.log(distinct=True, distinct_type="ids")
```
### 9. Distinct Queries Scoped to Execution Environment
Combine `exec_env=True` with distinct queries.
```python
result = fused.api.log(distinct=True, distinct_type="names", exec_env=True)
result = fused.api.log(distinct=True, distinct_type="ids", exec_env=True)
```
## Pagination
Regular (non-distinct) queries support pagination via `next_page_token`:
```python
all_items = []
page_token = None
while True:
result = fused.api.log(limit=300, scan_forward=False, page_token=page_token)
all_items.extend(result["items"])
page_token = result.get("next_page_token")
if not page_token:
break
```
## Recipes
### Recently Used UDFs (Last 7 Days)
```python
from datetime import datetime, timedelta, timezone
all_names =
now = datetime.now(timezone.utc)
for days_ago in range(7):
window_start = (now - timedelta(days=days_ago + 1)).isoformat()
window_end = (now - timedelta(days=days_ago)).isoformat()
result = fused.api.log(
distinct=True,
distinct_type="names",
start_timestamp=window_start,
end_timestamp=window_end,
max_records_to_scan=5000,
)
for record in result.get("items", []):
name = record.get("udf_name")
if name and (
name not in all_names
or record.get("timestamp", "") > all_names[name].get("timestamp", "")
):
all_names[name] = record
df = pd.DataFrame(list(all_names.values()))
```
### Failing UDFs (Last 7 Days)
```python
from datetime import datetime, timedelta, timezone
all_items = []
now = datetime.now(timezone.utc)
for days_ago in range(7):
window_start = (now - timedelta(days=days_ago + 1)).isoformat()
window_end = (now - timedelta(days=days_ago)).isoformat()
page_token = None
while True:
result = fused.api.log(
start_timestamp=window_start,
end_timestamp=window_end,
limit=300,
scan_forward=False,
page_token=page_token,
)
all_items.extend(result.get("items", []))
page_token = result.get("next_page_token")
if not page_token or len(all_items) >= 5000:
break
df = pd.DataFrame(all_items)
df["has_error"] = df["stderr"].fillna("").str.strip().astype(bool)
df["incomplete"] = df["execution_time"].isna()
failing = df[df["has_error"] | df["incomplete"]]
summary = (
failing.groupby("udf_name")
.agg(
failure_count=("id", "count"),
last_failure=("timestamp", "max"),
sample_error=("stderr", "first"),
)
.sort_values("failure_count", ascending=False)
.reset_index()
)
```
## Limits & Caveats
| Constraint | Value |
|---|---|
| Max `limit` per page | 300 |
| Max `max_records_to_scan` | 5000 |
| Distinct query pagination | Not supported (single response) |
| `stderr` population | Only from UDF-level Python errors; infrastructure failures (timeouts, Lambda crashes) may not populate `stderr` |
| `execution_time` = `None` | Indicates the execution record was never updated (possible crash/timeout) |
| Large `stdout`/`stderr`/`udf_data` | Transparently stored in S3 and resolved server-side when >= 100 KB |
================================================================================
## Download
Path: guide/data-input-outputs/export-api/download.mdx
URL: https://docs.fused.io/guide/data-input-outputs/export-api/download
# Download
Download remote files to the local system to make them available to UDFs across runs. Files are written to a disk shared across all UDFs in an organization.
## `fused.download`
Download any file to: `/mount/tmp/` which any other UDF can then access.
```python showLineNumbers
@fused.udf
def udf(url='https://www2.census.gov/geo/tiger/TIGER_RD18/STATE/11_DISTRICT_OF_COLUMBIA/11/tl_rd22_11_bg.zip'):
out_path = fused.download(url=url, file_path='out.zip')
print(out_path)
```
The `download` function sets a lock to ensure the download happens only once, in case the UDF is called concurrently.
================================================================================
## Geospatial Export
Path: guide/data-input-outputs/export-api/geospatial.mdx
URL: https://docs.fused.io/guide/data-input-outputs/export-api/geospatial-export
# Geospatial Export
Integrate Fused UDFs with popular mapping and visualization tools. See UDFs as API for more details.
## DeckGL
DeckGL is a highly performant framework to create interactive map visualizations that handle large datasets.
This guide shows how to load data from Fused into DeckGL maps created from a single standalone HTML page.
### Setup
1. Create a UDF, share your canvas to get a canvas token, call your UDF through the HTTPS endpoint.
2. Create an `.html` file following this template. This code creates a DeckGL map then introduces a layer that renders data from the specified Fused endpoint.
```html
```
### H3HexagonLayer
Create an `H3HexagonLayer`.
```js
new H3HexagonLayer(),
```
### Vector Tile Layer
Vector Tile layers are created by placing a `GeoJsonLayer` sublayer within a `TileLayer`. Use the following snippet to introduce a vector layer.
The layer in the sample map comes from Overture Buildings UDF.
```js
new TileLayer(//?=geojson",
maxZoom: 19,
minZoom: 0,
renderSubLayers: (props) => = props.tile;
return new GeoJsonLayer(props, );
},
});
```
### Raster Tile Layer
Raster Tile layers are created by placing a `BitmapLayer` sublayer within a `TileLayer`. Use the following snippet to introduce a raster layer. The sample layer below was created from the NAIP Tile UDF.
```js
new TileLayer(//?=png",
maxZoom: 19,
minZoom: 0,
renderSubLayers: (props) => = props.tile;
return new BitmapLayer(props, );
},
pickable: true,
});
```
Learn more about DeckGL
## Felt
Felt is a collaborative mapping platform for creating interactive maps. Load Fused data directly via URLs.
### Raster Tiles
1. Create a UDF that returns raster tiles
2. Share your canvas and use your canvas token and UDF name:
```bash
https://udf.ai/fc_/my_udf/run/tiles///?=png
```
3. In Felt, click "Upload from URL" and paste the URL
### Vector Data
1. Create a UDF that returns vector data
2. Share your canvas and use your canvas token and UDF name; add UDF parameters as query params:
```bash
https://udf.ai/fc_/my_udf.csv?param1=value1
```
3. In Felt, click "Upload from URL" and paste the URL
Learn more about Felt
//?=png",
tile_size=512,
zoom_offset=-1,
)
m.add_layer(tile_layer)
m
```
### Vector Tiles
```python
m = ipyleaflet.Map(center=(37.7749, -122.4194), zoom=17)
# Add vector tile layer
vector_layer = ipyleaflet.VectorTileLayer(
url="https://udf.ai/fc_/my_udf/run/tiles///?=mvt"
)
m.add_layer(vector_layer)
m
```
Learn more about Leaflet */}
## Mapbox
Mapbox GL JS creates interactive web maps. Load Fused data using tile sources.
### Basic Setup
- Generate a Mapbox token
```html
```
### Vector Tiles
Fused MVT tiles always use `udf` as the `source-layer` name. This is required for Mapbox GL JS, MapLibre, and react-map-gl.
```html
```
### Raster Tiles
```html
```
Learn more about Mapbox GL JS
## QGIS
QGIS is an open source desktop GIS platform. Load Fused data as raster tiles, vector tiles, or vector files.
### Raster Tiles
1. Create a UDF that returns raster tiles
2. Share your canvas and use your canvas token and UDF name:
```bash
https://udf.ai/fc_/my_udf/run/tiles///?=png
```
3. In QGIS: Right-click "XYZ Tiles" → "New Connection"
4. Paste the URL and configure the layer
### Vector Tiles
1. Create a UDF that returns vector tiles
2. Share your canvas and use your canvas token and UDF name:
```bash
https://udf.ai/fc_/my_udf/run/tiles///?=mvt
```
3. In QGIS: Right-click "Vector Tiles" → "New Connection"
4. Paste the URL and configure the layer
### Vector Files
1. Create a UDF that returns vector data
2. Share your canvas and use your canvas token and UDF name:
```bash
https://udf.ai/fc_/my_udf.geojson
```
3. In QGIS: Layer → Add Layer → Add Vector Layer
4. Paste the URL as the data source
Learn more about QGIS
## Related
- Generate HTTPS endpoints for your UDFs
- Check the Fused catalog for ready-to-use UDFs
================================================================================
## File system paths reference
Path: guide/data-input-outputs/export-api/log-file-paths.mdx
URL: https://docs.fused.io/guide/data-input-outputs/export-api/log-file-paths
Fused exposes two file systems to UDFs: a **mounted disk** at `/mount/` and a private **S3 home directory** at `s3://fused-users///`. Both are scoped at the organization level.
This page maps every directory under each location so you know where things live and what they contain.
---
## `/mount/` — mounted disk
Everything written here is shared across all UDFs in your environment and persists between executions. The `fused-system/` subdirectory is managed by the Fused runtime — do not write to it directly.
```
/mount/
├── fused-system/
│ ├── cached_data/
│ │ └── /
│ └── logs/
│ └── /
│ └── /
│ └── /
│ └── /
│ ├── metadata.json
│ ├── udf.json
│ ├── stdout.log
│ └── stderr.log
```
### `cached_data/`
Output cache for `@fused.cache`. Each subdirectory corresponds to a UDF by name; entries within are keyed by a hash of the function arguments.
```
/mount/fused-system/cached_data/
└── /
└── data_
```
### `logs/`
Per-request execution logs for UDF runs. One directory per request, organized by date and time.
```
/mount/fused-system/logs/
└── /
└── /
└── /
└── /
├── metadata.json ← user_email, udf_name, collection_name, execution_time_seconds
├── udf.json ← UDF code at time of execution (key: "code")
├── stdout.log ← captured stdout
└── stderr.log ← captured stderr; non-empty means an error occurred
```
List all execution directories for a date:
```python showLineNumbers
@fused.udf
def udf(datestr: str = "2026-05-12"):
dirs = glob.glob(f"/mount/fused-system/logs//*/*/*")
df = pd.DataFrame()
df["hhmm"] = df["file_path"].apply(lambda x: x.split("/")[5])
df["user"] = df["file_path"].apply(lambda x: x.split("/")[6])
df["request_id"] = df["file_path"].apply(lambda x: x.split("/")[7])
return df
```
Read the files for a specific request (replace the path with one from the listing above):
```python showLineNumbers
# Replace with an actual path from the listing above
path = "/mount/fused-system/logs/2026-05-12/1430/user@example.com/abc123"
with open(f"/metadata.json") as f:
meta = json.load(f)
with open(f"/stderr.log") as f:
stderr = f.read()
print(meta["udf_name"], meta["execution_time_seconds"])
print(stderr or "no errors")
```
---
## `s3://fused-users//` — S3 home
Your organization's S3 space. Use the File Explorer to browse it and confirm the exact paths for your account.
```
s3://fused-users//
├── /
├── fused-system/
│ ├── checkpoints/
│ │ └── /
│ │ └── /
│ │ ├── .json
│ │ └── .json
│ ├── fused-cache/
│ │ └── /
│ │ └── /
│ │ └── output/
│ │ └── /
│ ├── history/
│ │ └── /
│ │ └── /
│ │ └── /
│ │ └── .json
│ ├── integrations/
│ │ └── slack.json
│ ├── job-configs/
│ │ └── /
│ │ └── /
│ │ └── file.json
│ └── logs/
│ └── /
│ └── /
│ └── /
│ └── /
```
### `s3://fused-users///`
Your personal home directory for persistent storage. This is where you write output datasets, GeoTIFFs, and any files that need to be accessed outside of Fused. See Storage options for details.
```python showLineNumbers
@fused.udf(cache_max_age="0s")
def udf():
val = fused.api.list("s3://fused-users///")
return pd.DataFrame(val, columns=["path"])
```
### `s3://fused-users//fused-system/`
Organization-wide system data managed by Fused. Contents are described below.
### `checkpoints/`
Canvas checkpoint snapshots created when you save a checkpoint in Workbench. Each canvas has its own directory under the user's email, containing timestamped JSON snapshots.
```
s3://fused-users//fused-system/checkpoints/
└── /
└── /
├── .json ← saved checkpoints, named by the user
└── .json ← auto-timestamped snapshots
```
See Canvas Checkpoints for how to create and restore them.
### `fused-cache/`
S3-backed output cache for `@fused.cache`. Stores results keyed by a hash of the function arguments, persisted per user and per UDF.
```
s3://fused-users//fused-system/fused-cache/
└── /
└── /
└── output/
└── /
```
### `history/`
Code history for every UDF in the organization. Each UDF is identified by its UUID; within that, every save is stored as a timestamped JSON snapshot grouped by day.
```
s3://fused-users//fused-system/history/
└── /
└── /
└── /
└── .json ← full UDF code snapshot at that point in time
```
### `integrations/`
Integration configuration files. For example, `slack.json` holds the Slack webhook configuration set up via Integrations & Secrets.
### `job-configs/`
Configuration files for batch jobs, stored by submission date and job UUID. Each job writes a `file.json` with its execution parameters.
```
s3://fused-users//fused-system/job-configs/
└── /
└── /
└── file.json
```
### `logs/`
S3 mirror of the execution logs written to `/mount/fused-system/logs/`. Organized by the same date and time hierarchy, with one directory per request.
```
s3://fused-users//fused-system/logs/
└── /
└── /
└── /
└── /
├── metadata.json
├── udf.json
├── stdout.log
└── stderr.log
```
List available dates:
```python showLineNumbers
fused.api.list("s3://fused-users//fused-system/logs/")
```
---
## See also
- Storage options — when to use mount vs. S3 home
- Audit Logs (`fused.api.log`) — query execution logs via the API
- Debugging playbook — techniques for diagnosing failing UDFs
- File Explorer — browse your S3 home directory in Workbench
================================================================================
## REST API
Path: guide/data-input-outputs/export-api/rest-api.mdx
URL: https://docs.fused.io/guide/data-input-outputs/export-api/rest-api
# REST API
Everything the Fused Python SDK does happens over a REST API. That means you don't need Python to work with Fused — any language or tool that can make an HTTP request can call your UDFs and automate the platform.
This page explains the two API surfaces and how to authenticate against each. For the endpoints themselves — paths, parameters, and responses — see the REST API reference.
There are two distinct API surfaces, with different base URLs and different authentication:
| Surface | Base URL | What it's for | Authentication |
|---|---|---|---|
| **UDF endpoints** | `https://udf.ai` | Calling shared UDFs and getting data back | Canvas token in the path; session token for team-only canvases |
| **Platform API** | `https://www.fused.io/server/v1` | Everything else: session tokens, cache, the operations behind the SDK | `Authorization` header (bearer or service account) |
## UDF endpoints
Every UDF on a shared canvas is an HTTP endpoint. The canvas token (`fc_…`) goes in the path, the UDF name and output format follow, and UDF parameters are query parameters:
```
https://udf.ai/fc_/.json?param=value
```
- UDFs as API — URL structure, output formats (`.json`, `.csv`, `.parquet`, `.png`, tiles, …), and parameters
- Tokens & endpoints — sharing a canvas and getting its token
Access depends on how the canvas is shared. A **public** canvas needs no authentication (optionally gated by a canvas passcode). A **team-only** canvas requires a short-lived session token passed as the `fused_session_token` query parameter — see Securing Shared Tokens.
## Platform API
The platform API at `https://www.fused.io/server/v1` is what the Python SDK and Workbench call under the hood. Use it directly when your caller isn't Python — a backend in another language, a CI/CD job, or a plain `curl`.
Requests authenticate with an `Authorization` header, in one of two forms:
```
Authorization: Bearer
Authorization: Fused-Service-Token
```
- **Bearer token** — a personal access token that acts as *you*. Get one from an authenticated SDK session with `fused.api.access_token()`. Personal tokens expire with your session, so they suit interactive use and short-lived scripts.
- **Service account token** — a long-lived machine credential that acts as your *team's environment*, made for automation. See Service Accounts for creating one and using it.
Some operations are user-scoped and accept only a personal bearer token — creating or updating canvases, for example. A service account covers environment-scoped operations such as running UDFs, minting session tokens, and invalidating caches.
The REST API reference documents which credentials each endpoint accepts, alongside its parameters and responses.
## See also
- REST API reference — every documented endpoint, with its scope, parameters, and responses
- UDFs as API — calling UDFs over HTTPS in every output format
- Securing Shared Tokens — public vs team-only access, session tokens
- Service Accounts — machine credentials for the platform API
- Audit Logs — tracking UDF executions
================================================================================
## Securing Shared Tokens
Path: guide/data-input-outputs/export-api/securing-shared-tokens.mdx
URL: https://docs.fused.io/guide/data-input-outputs/export-api/securing-shared-tokens
# Securing Shared Tokens
Fused shared tokens can be set to either **public** or **team-only** access. You should set the token access depending on your use case, and the sensitivity of the data you are sharing.
Shared tokens are set on the canvas level. Every UDF on the canvas will inherit the access level of the canvas.
## Scoping access with canvases
Access is managed **per canvas** (team vs public and share links). Canvas passcode is an extra gate that exists only for **publicly shared** canvases. Everyone who can open a canvas sees the same UDFs on it and the same rules for calling them over HTTPS.
If you only want to expose **some** UDFs—or a **different** audience—use a **separate canvas**: keep public or broadly shared work on one canvas, and move UDFs that need tighter access to another canvas with **team-only** sharing.
## Public Access
Public access means that the token is accessible by anyone. This is useful if you want to share your data publicly without requiring authentication.
If you set the token to public access, anyone can access the token and use it to call the UDFs on the canvas, so you should only set a token to public access if you are sharing non-sensitive data.
## Team Access
Team access means the canvas and its UDF endpoints are available only to members of your team (unless you add a separate, time-limited session token for a specific use case). Use this when the data should not be callable by anonymous HTTPS clients using the canvas token alone.
For team-only canvases, you can generate a **session token** when you need a time-limited credential — for example to embed a UDF URL in an external page or application.
Session tokens are short-lived tokens that need to be explicitly generated. By default, a shared token that is set to team access will not have a session token. In this case, the shared token will be available to team members only.
Add the session token as a `fused_session_token` query parameter on the **UDF HTTPS URL** (same host and path as a normal canvas call, for example `https://udf.ai/fc_/.json`). Because session tokens are short-lived, they are safe to use in embedded links.
## Setting the Access Level
To set the access level of a shared token, click the Share button in the top right corner of the canvas.
Then, select the access level you want to set for the token.
[Image: Share modal]
## Session Tokens
This diagram shows the authentication flow for a team-only shared token with a session token, embedded in an external application.
1. An authenticated user requests a page from an external application that embeds a team-only shared token.
2. The external application’s backend calls the Fused API to **mint a session token**, authenticated with a Fused Service Account.
3. Fused verifies the service account and returns a temporary session token.
4. External application generates the embedded UDF URL with the session token and passes it to the user's browser.
5. User's browser requests the UDF shared token link with the session token.
## Creating a Fused Service Account
A Fused Service Account can be used to generate a session token. You can create one from the Integrations & Secrets page in the Fused Workbench.
1. Open **Integrations & Secrets** from the Workbench sidebar. If you're already inside a canvas, use **Quick Actions** (`Ctrl+K`) and search for "Integrations & secrets".
2. Under **Service accounts**, click **+ Create service account**.
3. Give the service account a name and click **Create**.
Your service account token will be shown only once, so make sure to copy it to a secure location. Never share your service account token publicly or commit it to version control.
## Generating a Session Token
### From Workbench
Team-scoped canvases require a session token for external access. When you click the **Share** button, Workbench automatically generates a session token for each UDF you want to share — just choose an expiration duration. You can generate multiple session tokens with different expiration times, and each token will expire independently.
Session tokens are created for the **whole canvas**. Any session token created can be used to access any other UDF & Widget in the same canvas.
The generated URL will look like:
```
https://www.fused.io/share//?fused_session_token=
```
 ### From your backend (service account)
To mint session tokens programmatically from **your own backend** (for example for embeds in a product), use a Fused Service Account and the HTTP API below.
```python showLineNumbers
# Your canvas token
canvas_token = "fc_abcdef1234567890"
# Get the service account token from the environment variable or other secure source
fused_service_account_token = os.getenv("FUSED_SERVICE_ACCOUNT_TOKEN")
# Pass the service account token to the Fused server in the Authorization header
headers = ",
"Content-Type": "application/json",
}
# Set the TTL for the session token
payload =
# Make the request to the Fused server
req = requests.post(f"https://www.fused.io/server/v1/session-token/by-access-token/", headers=headers, json=payload)
# Extract the session token from the response
session_token = req.json()["session_token"]
```
The session token will be valid for the duration of the TTL you set.
## Using a Session Token
Once you have a session token, append `fused_session_token` to the UDF URL like any other query parameter. The path must still include the **canvas token** and **UDF name** (see Tokens & endpoints).
```python showLineNumbers
# Canvas token, UDF name, and session token (from the minting step above)
canvas_token = "fc_abcdef1234567890"
udf_name = "my_udf"
session_token = "835b249b-d3ac-4a2d-8f7c-43d0805464c9:1744065600:abcdefghijklmnopqrstuvwxyz1234567890"
# Example: JSON output — add other params with &
udf_url = f"https://udf.ai//.json?fused_session_token="
```
Use that URL in iframes, map tile layers, or `fetch` from the browser.
## Token lifecycle
A canvas token (`fc_…`) is created the first time you share a canvas, and stays the same for the life of that canvas unless you explicitly rotate it (see below). The token can appear in two forms — a random `fc_…` string, or a name-based `fc_/` reference — depending on how the canvas was first shared. Both behave identically; treat the token as an opaque string and don't parse or construct it.
Knowing which actions keep a token valid versus issue a new one matters when you distribute a token (an embed, a backend integration, an MCP endpoint) and update the canvas over time.
**These keep the same token** — already-distributed links keep working:
- Re-sharing a canvas (`fused canvas share`, or sharing again from the Workbench Share modal) — the existing token is reused.
- Updating canvas content — pushing new UDFs (`fused canvas push`) or editing in Workbench.
**These issue a new token** — the previous one stops working:
- Rotating the token (`fused canvas share --new-token`, or **Generate new token** in the Share modal). The old token is invalidated immediately.
- Deleting and recreating a canvas — even under the same name, a recreated canvas is a new canvas with no token until you share it again, and it receives a *different* token.
When a token has been rotated or its canvas was recreated, calls using the old token fail: minting a session token returns a `404` from `POST https://www.fused.io/server/v1/session-token/by-access-token/`, and calls to the UDF HTTPS endpoints (e.g. `https://udf.ai//.json`) start failing as well.
If you hit this, fetch the canvas's current token — re-run `fused canvas share`, which prints it, or copy it from the Workbench Share modal — and update your consumers with the new value.
If a release pipeline copies one canvas to another (for example dev → prod), **update the destination canvas in place** — push to the existing canvas rather than deleting and recreating it, and don't run `share --new-token` as part of the release. That keeps the distributed token stable. A canvas token cannot be recovered once invalidated, so if you do recreate a canvas you must re-share it and distribute the new token to every consumer.
## See also
- Write UDFs securely — SQL, parameters, secrets, and experimental canvas passcodes (publicly shared canvases only)
- Tokens & endpoints
- Canvas — Share modal
================================================================================
## Tokens & endpoints
Path: guide/data-input-outputs/export-api/tokens-endpoints.mdx
URL: https://docs.fused.io/guide/data-input-outputs/export-api/tokens-endpoints
# Turn your data into an API
1. In Workbench create a new UDF that returns data, for example:
```python
@fused.udf
def udf():
path = "s3://fused-sample/demo_data/housing/housing_2024.csv"
housing = pd.read_csv(path)
housing['price_per_area'] = round(housing['price'] / housing['area'], 2)
return housing[['price', 'price_per_area']]
```
2. Share your canvas to get a canvas token
3. Select the UDF, click the three dots → **Open in…** → **Share link**
[Image: Three dots menu: Open in… → Share link]
Optionally, edit the URL for your preferred format, `.json`, `.csv`, etc. (see Calling UDFs as API):
```bash
https://udf.ai/fc_YOUR_CANVAS_TOKEN/my_udf.json
https://udf.ai/fc_YOUR_CANVAS_TOKEN/my_udf.csv
```
---
## HTTPS Requests
You can call saved UDFs via HTTPS. Sharing is at the **canvas** level: one token per canvas, UDFs referred to by name.
### Canvas token
After you share your canvas, you get a **canvas token** (e.g. `fc_**********`). The share link you copy contains this token — it’s the `fc_...` segment. Every UDF on that canvas is then available at:
```
https://udf.ai/fc_/.
```
Use the UDF name as it appears on the UDF card in Workbench.
Example:
```
https://udf.ai/fc_AbcDef123/my_udf.parquet
https://udf.ai/fc_AbcDef123/my_udf.json
```
View and manage legacy shared tokens here.
If you rename a UDF in Workbench, the old URL (with the previous name) stops working. Update any clients or bookmarks that use that URL.
### Legacy: per-UDF token (fsh_)
Per-UDF shared tokens (`fsh_***`) are still supported but legacy. They look like `fsh_**********h4t` and map one token to one UDF:
```
https://udf.ai/fsh_YOUR_TOKEN.parquet
```
Existing `fsh_` tokens continue to work. For new sharing, use the canvas token flow above.
### Passing Parameters
You can pass parameters to your UDF via the URL by adding query parameters (`¶m=value`) to the URL.
For example a UDF that takes `lat` and `lon` as parameters:
```python showLineNumbers
@fused.udf
def udf(lat, lon):
return pd.DataFrame()
```
Could be called with:
```
https://udf.ai/fc_YOUR_CANVAS_TOKEN/my_udf?lat=37.7749&lon=-121.4194
```
See Calling UDFs as API for more details.
### Tiling
You can integrate your UDF as a vector or raster tile server by adding `tiles` path parameter, followed by templated `///` path parameters.
You need to make sure:
- Your UDF is set to Tile mode
- You properly pass `///` instead of default value
- Depending on your server type, you might need to add the `format` parameter
```
https://udf.ai/fc_YOUR_CANVAS_TOKEN/my_udf/run/tiles///?=png
```
### Private Token
Calling UDFs with Bearer authentication requires an account's private token.
```bash
curl -XGET "https://udf.ai/fc_YOUR_CANVAS_TOKEN/my_udf.png" -H "Authorization: Bearer $ACCESS_TOKEN"
```
Do not share your Bearer token with anyone. These allow to impersonate your account and should be treated as such.
### Serialization Format
See the full list of supported formats in Calling UDFs as API Output Formats.
---
## Calling UDFs without Python SDK
You can run a UDF directly via HTTP request without needing Python when making the call.
### 1. Get your Bearer token
First retrieve your bearer token (this requires Python once):
```python showLineNumbers
from fused._auth import AUTHORIZATION
AUTHORIZATION.credentials.access_token
```
Returns something like: `'eyJ4K9pL2Mx...'`
### 2. Find your client ID
**Basic Tier (no environment):** Use `basic-tier` as your client_id.
**With environment:** In Workbench, go to "Preferences" and note the "Kernel" name displayed.
[Image: Finding your kernel name in Workbench]
### 3. Make the POST request
```bash
curl -X 'POST' \
'https://www.fused.io/server/v1/realtime//api/v1/run/udf' \
-H 'accept: application/json' \
-H 'Authorization: Bearer ' \
-H 'Content-Type: application/json' \
-d ',\"metadata\":,\"code\":\"@fused.udf\\ndef udf(name: str = \\\"world\\\"):\\n import pandas as pd\\n return pd.DataFrame()\\n\",\"headers\":[]}}","dtype_in":"json","format":"geojson,png","cache":true}'
```
Substitute the client ID from step 2 for `` — `basic-tier` on the basic tier, or your kernel name if you have an environment.
---
## Caching Responses
If a UDF's cache is enabled, its endpoints cache outputs for each combination of code and parameters. The first call runs and caches the UDF, and subsequent calls return cached data.
Control cache behavior with the `cache_max_age` parameter:
```
https://udf.ai/fc_YOUR_CANVAS_TOKEN/my_udf.json?cache_max_age=1d
```
See Caching for more details.
================================================================================
## Canvas as MCP Server
Path: guide/data-input-outputs/import-connection/ai-data-connection.mdx
URL: https://docs.fused.io/guide/data-input-outputs/import-connection/ai-data-connection
# Canvas as MCP Server
Every Fused Canvas can be turned into an MCP server in one click — giving AI tools like Claude Code, the Claude desktop app, and claude.ai direct access to your UDFs as callable tools. You can also embed an AI chat interface directly on the canvas using the `ai-chat` widget.
### From your backend (service account)
To mint session tokens programmatically from **your own backend** (for example for embeds in a product), use a Fused Service Account and the HTTP API below.
```python showLineNumbers
# Your canvas token
canvas_token = "fc_abcdef1234567890"
# Get the service account token from the environment variable or other secure source
fused_service_account_token = os.getenv("FUSED_SERVICE_ACCOUNT_TOKEN")
# Pass the service account token to the Fused server in the Authorization header
headers = ",
"Content-Type": "application/json",
}
# Set the TTL for the session token
payload =
# Make the request to the Fused server
req = requests.post(f"https://www.fused.io/server/v1/session-token/by-access-token/", headers=headers, json=payload)
# Extract the session token from the response
session_token = req.json()["session_token"]
```
The session token will be valid for the duration of the TTL you set.
## Using a Session Token
Once you have a session token, append `fused_session_token` to the UDF URL like any other query parameter. The path must still include the **canvas token** and **UDF name** (see Tokens & endpoints).
```python showLineNumbers
# Canvas token, UDF name, and session token (from the minting step above)
canvas_token = "fc_abcdef1234567890"
udf_name = "my_udf"
session_token = "835b249b-d3ac-4a2d-8f7c-43d0805464c9:1744065600:abcdefghijklmnopqrstuvwxyz1234567890"
# Example: JSON output — add other params with &
udf_url = f"https://udf.ai//.json?fused_session_token="
```
Use that URL in iframes, map tile layers, or `fetch` from the browser.
## Token lifecycle
A canvas token (`fc_…`) is created the first time you share a canvas, and stays the same for the life of that canvas unless you explicitly rotate it (see below). The token can appear in two forms — a random `fc_…` string, or a name-based `fc_/` reference — depending on how the canvas was first shared. Both behave identically; treat the token as an opaque string and don't parse or construct it.
Knowing which actions keep a token valid versus issue a new one matters when you distribute a token (an embed, a backend integration, an MCP endpoint) and update the canvas over time.
**These keep the same token** — already-distributed links keep working:
- Re-sharing a canvas (`fused canvas share`, or sharing again from the Workbench Share modal) — the existing token is reused.
- Updating canvas content — pushing new UDFs (`fused canvas push`) or editing in Workbench.
**These issue a new token** — the previous one stops working:
- Rotating the token (`fused canvas share --new-token`, or **Generate new token** in the Share modal). The old token is invalidated immediately.
- Deleting and recreating a canvas — even under the same name, a recreated canvas is a new canvas with no token until you share it again, and it receives a *different* token.
When a token has been rotated or its canvas was recreated, calls using the old token fail: minting a session token returns a `404` from `POST https://www.fused.io/server/v1/session-token/by-access-token/`, and calls to the UDF HTTPS endpoints (e.g. `https://udf.ai//.json`) start failing as well.
If you hit this, fetch the canvas's current token — re-run `fused canvas share`, which prints it, or copy it from the Workbench Share modal — and update your consumers with the new value.
If a release pipeline copies one canvas to another (for example dev → prod), **update the destination canvas in place** — push to the existing canvas rather than deleting and recreating it, and don't run `share --new-token` as part of the release. That keeps the distributed token stable. A canvas token cannot be recovered once invalidated, so if you do recreate a canvas you must re-share it and distribute the new token to every consumer.
## See also
- Write UDFs securely — SQL, parameters, secrets, and experimental canvas passcodes (publicly shared canvases only)
- Tokens & endpoints
- Canvas — Share modal
================================================================================
## Tokens & endpoints
Path: guide/data-input-outputs/export-api/tokens-endpoints.mdx
URL: https://docs.fused.io/guide/data-input-outputs/export-api/tokens-endpoints
# Turn your data into an API
1. In Workbench create a new UDF that returns data, for example:
```python
@fused.udf
def udf():
path = "s3://fused-sample/demo_data/housing/housing_2024.csv"
housing = pd.read_csv(path)
housing['price_per_area'] = round(housing['price'] / housing['area'], 2)
return housing[['price', 'price_per_area']]
```
2. Share your canvas to get a canvas token
3. Select the UDF, click the three dots → **Open in…** → **Share link**
[Image: Three dots menu: Open in… → Share link]
Optionally, edit the URL for your preferred format, `.json`, `.csv`, etc. (see Calling UDFs as API):
```bash
https://udf.ai/fc_YOUR_CANVAS_TOKEN/my_udf.json
https://udf.ai/fc_YOUR_CANVAS_TOKEN/my_udf.csv
```
---
## HTTPS Requests
You can call saved UDFs via HTTPS. Sharing is at the **canvas** level: one token per canvas, UDFs referred to by name.
### Canvas token
After you share your canvas, you get a **canvas token** (e.g. `fc_**********`). The share link you copy contains this token — it’s the `fc_...` segment. Every UDF on that canvas is then available at:
```
https://udf.ai/fc_/.
```
Use the UDF name as it appears on the UDF card in Workbench.
Example:
```
https://udf.ai/fc_AbcDef123/my_udf.parquet
https://udf.ai/fc_AbcDef123/my_udf.json
```
View and manage legacy shared tokens here.
If you rename a UDF in Workbench, the old URL (with the previous name) stops working. Update any clients or bookmarks that use that URL.
### Legacy: per-UDF token (fsh_)
Per-UDF shared tokens (`fsh_***`) are still supported but legacy. They look like `fsh_**********h4t` and map one token to one UDF:
```
https://udf.ai/fsh_YOUR_TOKEN.parquet
```
Existing `fsh_` tokens continue to work. For new sharing, use the canvas token flow above.
### Passing Parameters
You can pass parameters to your UDF via the URL by adding query parameters (`¶m=value`) to the URL.
For example a UDF that takes `lat` and `lon` as parameters:
```python showLineNumbers
@fused.udf
def udf(lat, lon):
return pd.DataFrame()
```
Could be called with:
```
https://udf.ai/fc_YOUR_CANVAS_TOKEN/my_udf?lat=37.7749&lon=-121.4194
```
See Calling UDFs as API for more details.
### Tiling
You can integrate your UDF as a vector or raster tile server by adding `tiles` path parameter, followed by templated `///` path parameters.
You need to make sure:
- Your UDF is set to Tile mode
- You properly pass `///` instead of default value
- Depending on your server type, you might need to add the `format` parameter
```
https://udf.ai/fc_YOUR_CANVAS_TOKEN/my_udf/run/tiles///?=png
```
### Private Token
Calling UDFs with Bearer authentication requires an account's private token.
```bash
curl -XGET "https://udf.ai/fc_YOUR_CANVAS_TOKEN/my_udf.png" -H "Authorization: Bearer $ACCESS_TOKEN"
```
Do not share your Bearer token with anyone. These allow to impersonate your account and should be treated as such.
### Serialization Format
See the full list of supported formats in Calling UDFs as API Output Formats.
---
## Calling UDFs without Python SDK
You can run a UDF directly via HTTP request without needing Python when making the call.
### 1. Get your Bearer token
First retrieve your bearer token (this requires Python once):
```python showLineNumbers
from fused._auth import AUTHORIZATION
AUTHORIZATION.credentials.access_token
```
Returns something like: `'eyJ4K9pL2Mx...'`
### 2. Find your client ID
**Basic Tier (no environment):** Use `basic-tier` as your client_id.
**With environment:** In Workbench, go to "Preferences" and note the "Kernel" name displayed.
[Image: Finding your kernel name in Workbench]
### 3. Make the POST request
```bash
curl -X 'POST' \
'https://www.fused.io/server/v1/realtime//api/v1/run/udf' \
-H 'accept: application/json' \
-H 'Authorization: Bearer ' \
-H 'Content-Type: application/json' \
-d ',\"metadata\":,\"code\":\"@fused.udf\\ndef udf(name: str = \\\"world\\\"):\\n import pandas as pd\\n return pd.DataFrame()\\n\",\"headers\":[]}}","dtype_in":"json","format":"geojson,png","cache":true}'
```
Substitute the client ID from step 2 for `` — `basic-tier` on the basic tier, or your kernel name if you have an environment.
---
## Caching Responses
If a UDF's cache is enabled, its endpoints cache outputs for each combination of code and parameters. The first call runs and caches the UDF, and subsequent calls return cached data.
Control cache behavior with the `cache_max_age` parameter:
```
https://udf.ai/fc_YOUR_CANVAS_TOKEN/my_udf.json?cache_max_age=1d
```
See Caching for more details.
================================================================================
## Canvas as MCP Server
Path: guide/data-input-outputs/import-connection/ai-data-connection.mdx
URL: https://docs.fused.io/guide/data-input-outputs/import-connection/ai-data-connection
# Canvas as MCP Server
Every Fused Canvas can be turned into an MCP server in one click — giving AI tools like Claude Code, the Claude desktop app, and claude.ai direct access to your UDFs as callable tools. You can also embed an AI chat interface directly on the canvas using the `ai-chat` widget.
 ## Connect your canvas to Claude Code via MCP
### Step 1: Copy the MCP command from your canvas
Open your canvas in Workbench, click **Share**, then **Copy MCP**. This copies a ready-to-run terminal command:
```bash
claude mcp add --transport http fused-your-canvas-name \
"https://udf.ai/fc_YOUR_CANVAS_TOKEN.mcp"
```
The command uses `--transport http` so Claude can authenticate with your canvas immediately.
The connecting_ai_agents_mcp canvas is already set up as a public example — run the command below to connect it and follow the steps:
```bash
claude mcp add --transport http fused-connecting_ai_agents_mcp \
"https://udf.ai/fc_5jBXLhLiXluY9yCtcHbOTV.mcp"
```
### Step 2: Run the command in your terminal
Paste and run the command. Claude Code adds the MCP server to its config and responds with:
```
Added MCP server fused-your-canvas-name
```
### Step 3: Ask Claude about your data
Claude can now discover and call all visible UDFs on your canvas as tools. Try:
> "What UDFs do you have available?"
> "Run [your-udf-name] with [param]=value"
Only UDFs that are **visible** on the canvas are exposed through the MCP endpoint. Hide internal or helper UDFs in Workbench to keep the tool list focused on what agents should call directly.
Use the visibility toggle on each UDF node in Workbench to control what Claude sees. Hidden UDFs still run when called by other UDFs — they just won't appear as MCP tools.
### Works with any MCP-compatible client
The same MCP URL works with Cursor, VS Code (with MCP extensions), and any other tool that supports the Model Context Protocol — not just Claude Code.
---
## Connect to Claude Desktop App
The same connector flow works in both the **Claude desktop app** and at **claude.ai**. Once connected, Claude can call your canvas UDFs as tools directly from the chat.
### Personal accounts (Free, Pro, Max)
1. Open Claude and click **Customize** in the sidebar, then select **Connectors**
2. Click **+** → **Add custom connector**
3. Give the connector a name (e.g. "Fused - My Canvas") and paste your canvas MCP URL (open your canvas in Workbench, click **Share** → **Copy MCP** to get it)
4. Click **Add**
## Connect your canvas to Claude Code via MCP
### Step 1: Copy the MCP command from your canvas
Open your canvas in Workbench, click **Share**, then **Copy MCP**. This copies a ready-to-run terminal command:
```bash
claude mcp add --transport http fused-your-canvas-name \
"https://udf.ai/fc_YOUR_CANVAS_TOKEN.mcp"
```
The command uses `--transport http` so Claude can authenticate with your canvas immediately.
The connecting_ai_agents_mcp canvas is already set up as a public example — run the command below to connect it and follow the steps:
```bash
claude mcp add --transport http fused-connecting_ai_agents_mcp \
"https://udf.ai/fc_5jBXLhLiXluY9yCtcHbOTV.mcp"
```
### Step 2: Run the command in your terminal
Paste and run the command. Claude Code adds the MCP server to its config and responds with:
```
Added MCP server fused-your-canvas-name
```
### Step 3: Ask Claude about your data
Claude can now discover and call all visible UDFs on your canvas as tools. Try:
> "What UDFs do you have available?"
> "Run [your-udf-name] with [param]=value"
Only UDFs that are **visible** on the canvas are exposed through the MCP endpoint. Hide internal or helper UDFs in Workbench to keep the tool list focused on what agents should call directly.
Use the visibility toggle on each UDF node in Workbench to control what Claude sees. Hidden UDFs still run when called by other UDFs — they just won't appear as MCP tools.
### Works with any MCP-compatible client
The same MCP URL works with Cursor, VS Code (with MCP extensions), and any other tool that supports the Model Context Protocol — not just Claude Code.
---
## Connect to Claude Desktop App
The same connector flow works in both the **Claude desktop app** and at **claude.ai**. Once connected, Claude can call your canvas UDFs as tools directly from the chat.
### Personal accounts (Free, Pro, Max)
1. Open Claude and click **Customize** in the sidebar, then select **Connectors**
2. Click **+** → **Add custom connector**
3. Give the connector a name (e.g. "Fused - My Canvas") and paste your canvas MCP URL (open your canvas in Workbench, click **Share** → **Copy MCP** to get it)
4. Click **Add**
 Claude can now call your canvas UDFs directly from the chat:
 Only **visible** UDFs on your canvas are exposed as tools. Widget nodes and UDFs marked as hidden are not accessible. Use the visibility toggle in Workbench to control what Claude sees.
### Team & Enterprise accounts
Individual members cannot add custom connectors — only **Owners (admins)** can configure them org-wide.
**Owner setup:**
1. Go to **Organization settings → Connectors** and add the MCP URL there
**Member setup** (once the Owner has added the connector):
1. Go to **Customize → Connectors**
2. Find the connector (tagged **Custom**) and click **Connect** to authenticate individually
If you're on a Team or Enterprise plan and the connector hasn't been set up yet, ask your workspace admin to add it under **Organization settings → Connectors** first.
---
## Add an AI chat widget to your canvas
The `ai-chat` widget embeds a persistent chat interface directly on your canvas. It has access to all UDFs connected to the widget node and can answer questions, stream responses, and return structured data — no separate AI tool required.
Open the connecting_ai_agents_mcp canvas to see the `ai-chat` widget connected to a live UDF.
Only **visible** UDFs on your canvas are exposed as tools. Widget nodes and UDFs marked as hidden are not accessible. Use the visibility toggle in Workbench to control what Claude sees.
### Team & Enterprise accounts
Individual members cannot add custom connectors — only **Owners (admins)** can configure them org-wide.
**Owner setup:**
1. Go to **Organization settings → Connectors** and add the MCP URL there
**Member setup** (once the Owner has added the connector):
1. Go to **Customize → Connectors**
2. Find the connector (tagged **Custom**) and click **Connect** to authenticate individually
If you're on a Team or Enterprise plan and the connector hasn't been set up yet, ask your workspace admin to add it under **Organization settings → Connectors** first.
---
## Add an AI chat widget to your canvas
The `ai-chat` widget embeds a persistent chat interface directly on your canvas. It has access to all UDFs connected to the widget node and can answer questions, stream responses, and return structured data — no separate AI tool required.
Open the connecting_ai_agents_mcp canvas to see the `ai-chat` widget connected to a live UDF.
 The `ai-chat` widget requires you to be logged in to fused.io. Unauthenticated viewers will see a login prompt.
### How to add it
1. Click the **Widget** icon in the canvas toolbar to add a new widget node
2. In the widget JSON editor, click **Presets** and select **ai-chat**
3. Connect the UDF nodes you want the chat to query by drawing edges from them to the widget node
The preset inserts this widget JSON:
```json
}
```
All props are optional. You can add a `systemPromptExtra` string to give the AI extra instructions specific to your data:
```json
}
```
For full widget documentation including all available props and how to compose widgets, see Widgets.
---
## See also
- Widgets — full reference for all widget types including `ai-chat`
- Building for Agents — how to design UDFs that work well as MCP tools
- Overture Maps MCP Agent — a complete example of a canvas exposed as an MCP server
- Tokens & endpoints — managing canvas access and session tokens
- Write UDFs securely — security considerations for agent-facing UDFs
================================================================================
## Cloud storage
Path: guide/data-input-outputs/import-connection/cloud-storage.mdx
URL: https://docs.fused.io/guide/data-input-outputs/import-connection/cloud-storage
# Cloud storage
Fused supports multiple cloud storage options for reading and writing data.
## Supported storage paths
| Provider | Format | Example |
|----------|--------|---------|
| Fused home directory | `s3://` | `s3://fused-users/fused/aman/my-data/file.parquet` |
| Fused public assets | `s3://` | `s3://fused-asset/path/file.parquet` |
| Source Cooperative | `s3://` | `s3://us-west-2.opendata.source.coop/path/file.parquet` |
| Google Cloud | `gs://` or `gcs://` | `gs://bucket-name/path/file.parquet` |
| HTTP(S) | `https://` | `https://example.com/file.csv` |
For details on using your Fused home directory and the `/mnt/cache` disk, see Storage options.
## Connect your own bucket
Connect S3 or GCS buckets to access their files interactively from within the File Explorer UI and programmatically from within UDFs.
Contact Fused to set an S3 or GCS bucket on the File Explorer for all users in your organization. Alternatively, set a bucket as a "favorite" so it appears in the File Explorer for your account only.
### Amazon S3
Set the policy below on your bucket, replacing `YOUR_BUCKET_NAME` with its name. Fused will provide `YOUR_ENV_NAME`.
Alternatively, use this Fused app to automatically structure the policy for you.
The bucket must enable the following CORS settings to allow uploading files from Fused:
#### Encrypted S3 Buckets
If your bucket uses server-side encryption with AWS KMS (SSE-KMS), additional KMS and bucket policy configuration is required. See Amazon S3 integration for full step-by-step instructions.
### Google Cloud Storage (GCS)
To connect a Google Cloud Storage bucket to your Fused environment:
**1. Create a Service Account in GCS**
Set up a Google Cloud service account with permissions to read, write, and list from the GCS bucket. See the Google Cloud documentation for instructions to:
- Create a Service Account
- Set permissions for the Service Account
**2. Download the JSON Key File**
Download the JSON Key file associated with the Service Account. This file contains credentials that Fused will use to access the GCS bucket.
**3. Set the JSON Key as a Secret**
Set the JSON Key as a secret in the secrets management UI. The secret must be named `gcs_fused`.
You then need to write these credentials to a JSON file and pass them to Google:
```python
@fused.udf
def udf():
from google.cloud import storage
# get GCP secrets
with open("/tmp/gcs_key.json", "w") as f:
f.write(fused.secrets["gcs_fused"])
os.environ["GOOGLE_APPLICATION_CREDENTIALS"] = "/tmp/gcs_key.json"
# your code here
```
## Read & write examples
### Reading from S3
```python
@fused.udf
def udf():
path = "s3://fused-sample/demo_data/housing_2024.csv"
return pd.read_csv(path)
```
### Writing to S3
```python
df.to_parquet("s3://my-bucket/data.parquet")
```
### Writing to GCS
```python
df.to_parquet("gcs://my-bucket/data.parquet")
```
### Download to Fused mount
```python
@fused.udf
def udf(url='https://www2.census.gov/geo/tiger/TIGER_RD18/STATE/11_DISTRICT_OF_COLUMBIA/11/tl_rd22_11_bg.zip'):
out_path = fused.download(url=url, file_path='out.zip')
return str(out_path)
```
Files will be written to `/mnt/cache/`, where any other UDF can then access them.
## Downloading large remote files
For datasets from external sources like Zenodo or Humanitarian Data Exchange that take longer than 120s to download, run as a batch job:
```python showLineNumbers
@fused.udf(
engine='c2-standard-4', # Small instance - download uses little resources
disk_size_gb=999 # Large disk for the file
)
def udf():
url = "https://zenodo.org/records/4395621/files/my_large_file.zip"
s3_path = f"s3://fused-asset/data/my-files/"
# Skip if already downloaded
if s3fs.S3FileSystem().exists(s3_path):
return f'File exists: '
# Download with progress
temp_path = tempfile.NamedTemporaryFile(delete=False).name
resp = requests.get(url, stream=True)
resp.raise_for_status()
with open(temp_path, 'wb') as f:
for chunk in resp.iter_content(chunk_size=8192):
f.write(chunk)
# Upload to S3
s3fs.S3FileSystem().put(temp_path, s3_path)
return f"Uploaded to: "
```
Once downloaded, use the Reading Data guide for extracting compressed files (ZIP/RAR).
## `/mnt/cache` disk
`/mnt/cache` is the path to a mounted disk to store files shared between UDFs. This is where `@fused.cache` and `fused.download` write data. It's ideal for files that UDFs need to read with low-latency, downloaded files, the output of cached functions, access keys, `.env`, and ML model weights.
UDFs may interact with the disk as with a local file system:
```python showLineNumbers
# Write to mount
df.to_parquet("/mnt/cache/data.parquet")
# List files
@fused.udf
def udf():
for each in os.listdir('/mnt/cache/'):
print(each)
```
If you encounter `Error: No such file or directory: '/mnt/cache/'`, contact the Fused team to enable it for your environment.
================================================================================
## Databases
Path: guide/data-input-outputs/import-connection/databases.mdx
URL: https://docs.fused.io/guide/data-input-outputs/import-connection/databases
# Databases
Connect Fused to external databases. See the dedicated integration guides:
- Snowflake
- BigQuery
================================================================================
## Google Earth Engine
Path: guide/data-input-outputs/import-connection/geospatial/gee.mdx
URL: https://docs.fused.io/guide/data-input-outputs/import-connection/geospatial/gee
# Google Earth Engine
Fused interfaces Google Earth Engine with the Python `earthengine-api` library. This example shows how to load data from GEE datasets into Fused UDFs and read it with xarray.
### 1. Authenticate with a Google Service Account
Create a UDF to set your Google Service Account credentials in your Fused runtime disk in a file in the `/mnt/cache` directory.
```python showLineNumbers
@fused.udf
def udf():
# Google Key as JSON
data =
# Define the target path for the new GEE credentials file
key_path = '/mnt/cache/gee_creds.json'
# Write the loaded JSON data to the new file
with open(key_path, 'w') as file:
json.dump(data, file)
```
### 2. Load data from Google Earth Engine
Create a UDF to load data from a GEE ImageCollection and open it with xarray. Authenticate by passing the key file path to `ee.ServiceAccountCredentials`.
```python showLineNumbers
@fused.udf
def udf(bounds: fused.types.TileGDF=None, n=10):
common = fused.load("https://github.com/fusedio/udfs/tree/fbf5682/public/common/")
# Authenticate GEE
key_path = '/mnt/cache/gee_creds.json'
credentials = ee.ServiceAccountCredentials("fused-account@fused-gee.iam.gserviceaccount.com", key_path)
ee.Initialize(opt_url="https://earthengine-highvolume.googleapis.com", credentials=credentials)
# Generate GEE bounding box for spatial filter
geom = ee.Geometry.Rectangle(*bounds.total_bounds)
scale = 1 / 2 ** max(0, bounds.z[0]) # A larger scale will increase your resolution per z but slow down the loading
# Load data from a GEE ImageCollection
ic = ee.ImageCollection("MODIS/061/MOD13A2").filter(
ee.Filter.date("2023-01-01", "2023-06-01")
)
# Open with xarray (the `xee` package must be present for engine="ee" to work)
ds = xarray.open_dataset(ic, engine="ee", geometry=geom, scale=scale).isel(time=0)
# Transform image color with a utility function
arr = common.arr_to_plasma(ds["NDVI"].values.squeeze().T, min_max=(0, 8000))
return arr
```
================================================================================
## STAC Catalogs
Path: guide/data-input-outputs/import-connection/geospatial/stac.mdx
URL: https://docs.fused.io/guide/data-input-outputs/import-connection/geospatial/stac
# STAC Catalogs
Access STAC (SpatioTemporal Asset Catalog) catalogs with pystac and odc.stac.
## Earth on AWS
```python showLineNumbers
@fused.udf
def udf(
bounds: fused.types.Bounds = [-77.083, 38.804, -76.969, 38.983],
):
odc.stac.configure_s3_access(aws_unsigned=True)
catalog = pystac_client.Client.open("https://earth-search.aws.element84.com/v1")
# Loading Elevation model
items = catalog.search(
collections=["cop-dem-glo-30"],
bbox=bounds
).item_collection()
xarray_dataset = odc.stac.load(
items,
crs="EPSG:3857",
bands=["data"],
resolution=150,
bbox=bounds,
).astype(int)
return xarray_dataset["data"], bounds
```
## Microsoft Planetary Computer
```python showLineNumbers
@fused.udf
def udf(
bounds: fused.types.Bounds = [-122.463,37.755,-122.376,37.803],
):
catalog = pystac_client.Client.open(
"https://planetarycomputer.microsoft.com/api/stac/v1",
modifier=planetary_computer.sign_inplace,
)
# Loading Elevation model
items = catalog.search(collections=["cop-dem-glo-30"],bbox=bounds).item_collection()
xarray_dataset = odc.stac.load(
items,
crs="EPSG:3857",
bands=["data"],
resolution=150,
bbox=bounds,
).astype(int)
return xarray_dataset["data"], bounds
```
================================================================================
## Local files
Path: guide/data-input-outputs/import-connection/local-files.mdx
URL: https://docs.fused.io/guide/data-input-outputs/import-connection/local-files
# Local files
Quickly bring any local data into Fused.
## Drag & drop
Drop files directly into the File Explorer:
[Image: Drag and drop files directly into Workbench]
## Upload with Python
Install `fused`, authenticate & run:
```python
fused.api.upload("my_local_file.csv", "s3://fused-users/fused/aman/my_data/file.csv") # change to your own path
```
Your Fused home directory is the private S3 path attached to your account.
## Optimize data loading
**For files < 1GB:** Use function caching to speed up loading:
```python
@fused.udf
def udf():
path = "s3://fused-sample/demo_data/housing_2024.csv"
@fused.cache
def load_data():
return pd.read_csv(path)
return load_data()
```
This is especially useful for slow formats (CSV, Excel, etc.).
**For files > 1GB:** Use Geospatial Ingestion to create cloud-optimized, partitioned files:
```python
job = fused.ingest(
input="https://www2.census.gov/geo/tiger/TIGER_RD18/LAYER/TRACT/tl_rd22_11_tract.zip",
output="s3://fused-users/fused/aman/census/dc_tract/", # change to your own path
)
job.run_batch()
```
================================================================================
## Using AI inside a UDF
Path: guide/data-input-outputs/import-connection/using-ai-inside-udf.mdx
URL: https://docs.fused.io/guide/data-input-outputs/import-connection/using-ai-inside-udf
You can call large language models directly from inside a UDF with `job2.ai`. No API keys or token management — Fused handles authentication through your account.
Every call to `ai.run()` counts against your AI token quota. Track your usage on the Profile page in Workbench.
## Talk to AI from a UDF
```python
@fused.udf
def udf():
from job2 import ai
from job2.ai import AiModel
response = ai.run(
prompt="Summarize the key benefits of vector databases.",
system_prompt="You are a concise technical writer. Answer in 1 sentence",
model=AiModel.GPT_OSS_120B,
)
return response.text
```
Vector databases enable fast similarity search on high‑dimensional embeddings, scale efficiently with billions of vectors, support real‑time updates and hybrid filtering, and integrate seamlessly with AI/ML pipelines for semantic retrieval and recommendation tasks.
`job2` is available in the Fused runtime — no installation required. The default model is `AiModel.GPT_OSS_120B`, an open-source model suitable for most tasks. Pass a `system_prompt` to shape persona and constraints. `ai.run()` also supports OpenAI-style tool calling, where `tools` and `tool_handler` use the same mechanism that powers user-defined tools in AI Chat.
Wrap `ai.run()` in a `@fused.cache`-decorated helper during development so identical prompts don't re-spend tokens on every run.
================================================================================
## Widgets
Path: guide/data-input-outputs/import-connection/widgets.mdx
URL: https://docs.fused.io/guide/data-input-outputs/import-connection/widgets
# Widgets
```python
@fused.udf
def udf(selected_option: str = "orders"):
from datetime import datetime, timedelta
np.random.seed(42)
end_date = datetime.now()
dates = [end_date - timedelta(days=i) for i in range(29, -1, -1)]
df = pd.DataFrame()
col = selected_option if selected_option in ("orders", "revenue") else "orders"
return df[["date", col]].rename(columns=)
```
```json
,
"children": [
},
}",
"barColor": "#E8FF59",
"showGrid": true,
"showValues": true,
"beginAtZero": true
}
}
]
}
```
```python
@fused.udf
def udf():
path = "s3://fused-sample/demo_data/airbnb_listings_sf.parquet"
@fused.cache
def load_data(file_path):
return pd.read_parquet(file_path)
df = load_data(path)
return df
```
```json
} GROUP BY neighbourhood_cleansed ORDER BY value DESC LIMIT 10",
"title": "Top 10 Most Expensive Neighbourhoods"
}
},
"showEditor": true,
"editorCollapsed": false,
"aiBuilderMode": true,
"aiPanel": "right"
}
}
```
*When you share a widget URL, Fused automatically appends all canvas parameters as query parameters so the shared view can be reproduced exactly.* Try it out →
## Map widgets
```python
@fused.udf
def udf():
path = "s3://fused-sample/demo_data/airbnb_listings_sf.parquet"
df = pd.read_parquet(path).dropna(subset=["latitude", "longitude", "price_in_dollar"])
gdf = gpd.GeoDataFrame(
df, geometry=gpd.points_from_xy(df["longitude"], df["latitude"]), crs="EPSG:4326"
)
grouped = gdf.groupby("neighbourhood_cleansed")
return gpd.GeoDataFrame(
,
crs="EPSG:4326",
)
```
```python
@fused.udf
def udf(bounds: fused.types.Bounds = [-122.446, 37.756, -122.430, 37.770]):
table_path = "s3://fused-asset/infra/building_msft_us"
common = fused.load("https://github.com/fusedio/udfs/tree/fbf5682/public/common/")
return common.table_to_tile(bounds, table=table_path)
```
```python
@fused.udf
def udf(
bounds: fused.types.Bounds = [-122.6, 37.2, -121.7, 38.0],
path: str = "s3://fused-asset/demos/seismic_data/v2023_1_pga_475_rock_3min.tif",
):
common = fused.load("https://github.com/fusedio/udfs/tree/fbf5682/public/common/")
tile = common.get_tiles(bounds, zoom=common.estimate_zoom(bounds))
arr = common.read_tiff(tile, input_tiff_path=path)
return common.arr_to_plasma(arr.filled(0), min_max=(0, 1.5))
```
```python
@fused.udf
def udf():
path = "s3://fused-sample/demo_data/airbnb_listings_sf.parquet"
df = pd.read_parquet(path).dropna(subset=["latitude", "longitude", "price_in_dollar"])
return df[["name", "latitude", "longitude", "price_in_dollar", "room_type"]]
```
## Multi-Component Widgets
A single widget node can hold multiple widgets — sliders, charts, tables, text, maps — stacked or laid out together. You wrap them in a `div` with `children`.
Use a `div` as the root container type and list each widget inside its `children` array — the structure is just a wrapper with standard CSS for layout.
```json
,
"children": [
},
},
}
]
}
```
- `type: "div"` — a container, not a visual widget. It just groups children.
- `props.style` — standard CSS. Use `flex-direction: column` for a vertical stack, `row` for side-by-side.
- `children` — an ordered array of widget definitions ``. Each child is a full widget. For the full list of supported widgets, see the Widget API reference.
You can nest a `div` inside another `div` for more complex layouts.
### Combining input & output components
Multiple components can also work together inside a single widget:
- An input component (like a slider) publishes a value through `param`
- An output component (like a chart) can read that value with `$param`
This lets you build interactive widgets with both inputs and outputs in a single widget.
### Example
When the slider changes, every widget using `$param` (here `$top_n`) updates instantly — the bar chart and SQL table re-render in sync with the slider value. Try it out →
```python
@fused.udf
def udf():
path = "s3://fused-sample/demo_data/airbnb_listings_sf.parquet"
@fused.cache
def load_data(file_path):
return pd.read_parquet(file_path)
df = load_data(path)
return df
```
```json
,
"children": [
},
} GROUP BY neighbourhood_cleansed ORDER BY value DESC LIMIT $top_n",
"barColor": "#E8FF59",
"barOpacity": 1,
"barRadius": 4,
"hoverColor": "#ffffff",
"showGrid": true,
"rotateLabels": true,
"horizontal": false,
"showValues": true,
"xAxisFontSize": 11,
"yAxisFontSize": 11,
"beginAtZero": true,
"animationMs": 300
}
},
} WHERE neighbourhood_cleansed IN (SELECT neighbourhood_cleansed FROM } GROUP BY neighbourhood_cleansed ORDER BY AVG(price_in_dollar) DESC LIMIT $top_n) GROUP BY neighbourhood_cleansed ORDER BY Avg_Price DESC"
}
}
]
}
```
[Image: Multi-widget slider updating chart and table]
================================================================================
## Geospatial Ingestion
Path: guide/data-input-outputs/read-write/geospatial/ingestion.mdx
URL: https://docs.fused.io/guide/data-input-outputs/read-write/geospatial/ingestion
# Geospatial Data Ingestion
_This page gives you tools to make your data fast to read so your UDFs are more responsive._
## Why Ingestion?
The whole purpose of Fused is to speed up data science pipelines. To make this happen we need data to be responsive, regardless of size. The ideal solution is to have all data sitting in RAM right next to compute, but in real-world applications:
- Datasets (especially geospatial data) can be in the Tb or Pb range which rarely fit in storage, let alone RAM
- Compute needs to be scaled up and down depending on workloads
One solution is **Cloud Optimized formats**: Data lives in the cloud but also leverages file formats that are fast to access. Just putting a `.zip` file that needs to be uncompressed at every read on an S3 bucket is still very slow. Ingested data should be:
- **On the cloud** so dataset size doesn't matter (AWS S3, Google Cloud Storage, etc.)
- **Partitioned** (broken down into smaller pieces that are fast to retrieve so we can load only sections of the dataset we need)
This makes it fast to read for any UDF, so developing in Map Builder & running UDFs is a lot faster & responsive!
### When is ingestion needed?
You don't _always_ need to ingest your file into a cloud, geo-partitioned format:
- Small files (< 100Mb) that are fast to open (already in `.parquet`) that you only read once
**Example of data you should ingest:** 1Gb `.zip` of shapefile
- `.zip` means you need to unzip your file each time you open it. This slows down working with the data _every time_.
- shapefile contains multiple files, it isn't the fastest to read
**Example of data you don't need to ingest:** 50Mb `.parquet`
- Even if the data isn't geo-partitioned, loading this data should be fast enough
---
## Ingest Geospatial Table Data
If you only need to store a file in cloud storage, use `fused.api.upload()` or drag and drop it in Workbench. If you want fast spatial reads on large geospatial data, use `fused.ingest()`.
| Topic | `fused.api.upload` | `fused.ingest` |
|---|---|---|
| What it does | Uploads a file to S3 as-is | Converts data into partitioned GeoParquet for fast spatial reads |
| Execution | Runs immediately | Starts a batch job with `run_batch()` |
| Output | One uploaded file | A folder of `.parquet` files plus a `_sample` spatial index |
| Storage | `s3://` bucket | `s3://` bucket |
| Transforms data? | No, stores the file as-is | Yes, partitions data, writes indexes, and can explode geometries |
| Spatial indexing? | No | Yes, via the `_sample` file |
To run an ingestion job on vector data we need:
1. **Input data** - This could be CSV files, a `.zip` containing shapefiles or any other non-partitioned data
2. **A cloud directory** - Where we save ingested data and later access it through UDFs
Our ingestion process:
1. Uploads the `input`
2. Creates geo-partitions of the input data
This is defined with `fused.ingest()`:
```python showLineNumbers
# Run this locally - not in Workbench
job = fused.ingest(
input="https://www2.census.gov/geo/tiger/TIGER_RD18/LAYER/TRACT/tl_rd22_11_tract.zip",
output="s3://fused-users/fused/aman/census/dc_tract/", # change to your own path
)
```
Ingestion jobs often take more than a few seconds and require a lot of RAM, making this a large run. Use `run_batch()` so your ingestion job can take as long as needed.
```python showLineNumbers
# doctest: skip
# Run this locally - not in Workbench
job_id = job.run_batch()
```
Refer to the dedicated documentation page for `fused.ingest()` for more details on all parameters
## Reading Ingested Data
Ingested tables can easily be read with the Fused utility function `table_to_tile`, which spatially filters the dataset and reads only the chunks within a specified polygon.
```python showLineNumbers
@fused.udf
def udf(
bounds: fused.types.Bounds = None,
table="s3://fused-asset/infra/building_msft_us/"
):
common = fused.load("https://github.com/fusedio/udfs/tree/fbf5682/public/common/")
return common.table_to_tile(bounds, table)
```
### The `_sample` File
When `fused.ingest()` runs, it creates a folder of partitioned Parquet files alongside a small file called `_sample`:
```
s3://fused-asset/infra/building_msft_us/
├── 0.parquet
├── 1.parquet
├── 2.parquet
├── ...
└── _sample ← spatial index
```
Each numbered Parquet file can contain multiple **row groups** (chunks). `_sample` is the spatial index that maps every chunk to its geographic extent so readers can skip irrelevant files entirely.
---
### Reading `_sample`
You can read the spatial index to inspect chunk bounding boxes:
```python showLineNumbers
df = fused.get_chunks_metadata("s3://fused-asset/infra/building_msft_us/")
```
This returns a GeoDataFrame with one row per chunk, including `file_id`, `chunk_id`, bounding box coordinates, and a `geometry` column.
In File Explorer, double-clicking a `_sample` file automatically generates a ready-to-run UDF that reads the ingested table.
---
### Reading Ingested Metadata
`fused.get_chunks_metadata()` reads the spatial index of an ingested table and returns one row per chunk, each with its bounding box and a `file_id` / `chunk_id` pair. You can spatially filter those rows by an area of interest to find exactly which chunks you need, then read only those — skipping the rest of the dataset entirely.
The example below uses Overture Maps buildings to show how to read only a subset of data for a small area. Try it on Fused Canvas →
**Step 1 — Read the chunk index**
```python showLineNumbers
@fused.udf
def udf(
release: str = "2025-05-21-0",
theme: str = "buildings",
type: str = "building",
part: str = "0",
):
path = f"s3://us-west-2.opendata.source.coop/fused/overture//theme=/type=/part=/"
return fused.get_chunks_metadata(path)
```
`file_id` and `chunk_id` are the coordinates you pass to `fused.get_chunk_from_table()` to read a specific chunk — everything else is metadata to help you filter.
**Step 2 — Filter by AOI**
Pass a bounding box and intersect it with the chunk geometries to find which `file_id` / `chunk_id` pairs overlap your area of interest.
```python showLineNumbers
@fused.udf
def udf(
bounds: fused.types.Bounds = [-122.42, 37.77, -122.40, 37.79],
release: str = "2025-05-21-0",
theme: str = "buildings",
type: str = "building",
part: str = "0",
):
from shapely.geometry import box
path = f"s3://us-west-2.opendata.source.coop/fused/overture//theme=/type=/part=/"
chunks_meta = fused.get_chunks_metadata(path)
aoi = box(*bounds)
return chunks_meta[chunks_meta.intersects(aoi)]
```
---
## Common Ingestion Patterns
### Ingest a table from a URL
Ingests a table from a URL and writes it to your Fused home directory in S3.
```python showLineNumbers
job_id = fused.ingest(
input="https://www2.census.gov/geo/tiger/TIGER_RD18/LAYER/TRACT/tl_rd22_11_tract.zip",
output="s3://fused-users/fused/max/census/dc_tract/", # <- replace with your own path,
).run_batch()
```
### Ingest multiple files
```python showLineNumbers
job_id = fused.ingest(
input=["s3://my-bucket/file1.parquet", "s3://my-bucket/file2.parquet"],
output="s3://fused-users/fused/max/census/dc_tract/", # <- replace with your own path,
).run_batch()
```
To ingest multiple local files, first upload them to S3 with fused.api.upload then specify an array of their S3 paths as the input to ingest.
### Row-based ingestion
Standard ingestion is row-based, where the user sets the maximum number of rows per chunk and file.
```python showLineNumbers
job_id = fused.ingest(
input="https://www2.census.gov/geo/tiger/TIGER_RD18/LAYER/TRACT/tl_rd22_11_tract.zip",
explode_geometries=True,
partitioning_method="rows",
partitioning_maximum_per_file=100,
partitioning_maximum_per_chunk=10,
).run_batch()
```
### Area-based ingestion
Fused also supports area-based ingestion, where the number of rows in each partition is determined by the sum of their area.
```python showLineNumbers
job_id = fused.ingest(
input="https://www2.census.gov/geo/tiger/TIGER_RD18/LAYER/TRACT/tl_rd22_11_tract.zip",
output="s3://fused-users/fused/max/census/dc_tract_area/", # <- replace with your own path,
explode_geometries=True,
partitioning_method="area",
partitioning_maximum_per_file=None,
partitioning_maximum_per_chunk=None,
).run_batch()
```
### Ingest GeoDataFrame
Ingest a GeoDataFrame directly.
```python showLineNumbers
job_id = fused.ingest(
input=gdf,
output="s3://sample-bucket/file.parquet",
).run_batch()
```
### Ingest Shapefile
We recommend you `.zip` your shapefile and ingest it as a single file:
```python showLineNumbers
job_id = fused.ingest(
input="s3://my_bucket/my_shapefile.zip",
output="s3://sample-bucket/file.parquet",
).run_batch()
```
### Write bbox columns for faster spatial filtering
Optionally, you can ask for writing a `bbox` covering column as part of the
resulting GeoParquet files:
```python showLineNumbers
job_id = fused.ingest(
input="https://www2.census.gov/geo/tiger/TIGER_RD18/LAYER/TRACT/tl_rd22_11_tract.zip",
output="s3://fused-users/fused/max/census/dc_tract/", # <- replace with your own path,,
write_covering_bbox=True,
).run_batch()
```
This makes the files bigger, but can result in faster loading with a spatial filter
when using tools such as GeoPandas or DuckDB:
```python showLineNumbers
@fused.udf
def udf(bounds: fused.types.Bounds = [-77.12, 38.79, -76.91, 38.99]):
gdf = geopandas.read_parquet("s3://fused-users/fused/max/census/dc_tract/", bbox=bounds)
return gdf
```
## Ingest to your own S3 bucket
`fused.ingest` supports writing output to any S3 bucket as long as you have appropriate permissions:
1. Open the `S3 Policy` tab in the profile page of Workbench and enter your S3 bucket name. This returns a JSON object.
2. Copy this IAM policy and paste it in your AWS S3 Policy tab.
3. Write the output to your S3 bucket using the `output` parameter:
```python showLineNumbers
# Assuming s3://my-bucket/ is your own managed S3 bucket
job_id = fused.ingest(
input="s3://my-bucket/file.parquet",
output="s3://my-bucket/ingested/",
).run_batch()
```
## Troubleshooting
If you encounter the following error message, please contact the Fused team to request an increase:
```text
Error: `Quota limit: Number of running instances`
```
================================================================================
## Reading geospatial
Path: guide/data-input-outputs/read-write/geospatial/reading.mdx
URL: https://docs.fused.io/guide/data-input-outputs/read-write/geospatial/geospatial-reading
# Reading geospatial
Common examples for reading geospatial data in Fused.
## Python Packages
### `geopandas`
```python
@fused.udf
def udf():
path = "s3://fused-sample/demo_data/subway_stations.geojson"
return gpd.read_file(path)
```
### `shapely`
```python
@fused.udf
def udf():
from shapely.geometry import Point, Polygon
# Create geometries with shapely
points = [Point(-122.4, 37.8), Point(-122.3, 37.7)]
polygon = Polygon([(-122.5, 37.7), (-122.3, 37.7), (-122.3, 37.9), (-122.5, 37.9)])
gdf = gpd.GeoDataFrame(
,
geometry=points + [polygon],
crs=4326
)
return gdf
```
### `rioxarray`
```python
@fused.udf
def udf():
path = "s3://fused-sample/demo_data/elevation.tif"
# Read raster data with rioxarray
raster = rxr.open_rasterio(path)
# Convert to DataFrame for display
df = raster.to_dataframe().reset_index()
return df.head(1000)
```
### `xarray`
```python
@fused.udf
def udf():
# Download NetCDF data to mount disk for proper reading
path = fused.download('s3://fused-sample/demo_data/2025_01_01_ERA5_surface.nc','2025_01_01_ERA5_surface.nc')
ds = xr.open_dataset(path)
# Convert to DataFrame
df = ds.to_dataframe().reset_index()
return df.head(1000)
```
## Vector Formats
### GeoJSON (.geojson, .json)
```python
@fused.udf
def udf():
path = "s3://fused-sample/demo_data/table/US_states.geojson"
return gpd.read_file(path)
```
### Shapefile (.shp + .shx, .dbf, .prj)
```python
@fused.udf
def udf():
path = "s3://fused-sample/demo_data/table/US_states_shapefile.shp"
return gpd.read_file(path)
```
### GeoPackage (.gpkg)
```python
@fused.udf
def udf():
path = "s3://fused-sample/demo_data/table/US_states_geopackage.gpkg"
return gpd.read_file(path)
```
### KML/KMZ (.kml, .kmz)
```python
@fused.udf
def udf():
path = "s3://fused-sample/demo_data/table/US_states.kml"
return gpd.read_file(path)
```
### GeoParquet (.parquet)
```python
@fused.udf
def udf():
path = "s3://fused-sample/demo_data/buildings.parquet"
return gpd.read_parquet(path)
```
### Large Geoparquet (.parquet with subset)
Why not just use `gpd.read_parquet()`?
- `gpd.read_parquet()` loads the ENTIRE file into memory before you can `.head()`
- For large files (100MB+) this causes Out of Memory errors in a realtime UDF run
**Solution:** Use DuckDB to push LIMIT down to the read level so only
n_rows are ever loaded into memory, then convert geometry from WKB to
proper Shapely objects via DuckDB's spatial extension (ST_AsText).
```python
@fused.udf
def udf(
n_rows: int = 1000,
):
path = "s3://us-west-2.opendata.source.coop/cholmes/overture/geoparquet-country-quad-2/CZ.parquet"
common = fused.load("https://github.com/fusedio/udfs/tree/9bad664/public/common/")
@fused.cache
def load_large_geoparquet(p, limit):
con = common.duckdb_connect()
# In this example, bucket is in us-west-2; set region so S3 requests don't use default us-east-1
con.sql("SET s3_region='us-west-2';")
# 1. Detect the geometry column (DuckDB reads it as BLOB/GEOMETRY)
col_info = con.execute(
"""
SELECT column_name FROM (
DESCRIBE SELECT * FROM read_parquet(?)
) WHERE column_type IN ('GEOMETRY', 'BLOB', 'WKB_GEOMETRY')
""",
[p],
).fetchall()
geom_col = col_info[0][0] if col_info else "geometry"
geom_sql = geom_col.replace('"', '""')
# 2. Read only `limit` rows and convert geometry BLOB -> WKT text
# LIMIT is pushed down so only `limit` rows are ever in memory
df = con.execute(
f'SELECT *, ST_AsText("") AS __wkt FROM read_parquet(?) LIMIT ?',
[p, limit],
).df()
# 3. Parse WKT into Shapely geometry objects and build GeoDataFrame
df[geom_col] = gpd.GeoSeries.from_wkt(df["__wkt"])
df = df.drop(columns=["__wkt"])
return gpd.GeoDataFrame(df, geometry=geom_col, crs=4326)
gdf = load_large_geoparquet(path, n_rows)
print(gdf.T)
return gdf
```
### CSV with coordinates (.csv)
```python
@fused.udf
def udf():
from shapely.geometry import Point
# Read CSV
df = pd.read_csv("s3://fused-sample/demo_data/table/subway_stations.csv")
# Convert to GeoDataFrame
gdf = gpd.GeoDataFrame(
df,
geometry=gpd.points_from_xy(df.longitude, df.latitude),
crs=4326
)
return gdf
```
### Excel with coordinates (.xlsx)
```python
@fused.udf
def udf():
from shapely.geometry import Point
path = "s3://fused-sample/demo_data/table/subway_stations.xlsx"
# Read Excel file
df = pd.read_excel(path)
# Convert to GeoDataFrame if coordinates exist
if 'longitude' in df.columns and 'latitude' in df.columns:
gdf = gpd.GeoDataFrame(
df,
geometry=gpd.points_from_xy(df.longitude, df.latitude),
crs=4326
)
return gdf
return df
```
## Raster Formats
### GeoTIFF (.tif, .tiff)
```python
@fused.udf
def udf():
path = "s3://fused-sample/demo_data/satellite_imagery/wildfires.tiff"
with rasterio.open(path) as src:
data = src.read()
bounds = src.bounds
return data, bounds
```
### NetCDF (.nc)
```python
@fused.udf
def udf():
# Download to mount disk for proper NetCDF reading
path = fused.download('s3://fused-sample/demo_data/climate_data.nc', 'climate_data.nc')
# Open NetCDF dataset
ds = xr.open_dataset(path)
return ds.to_dataframe().reset_index().head(1000)
```
For working with STAC catalogs (Earth on AWS, Microsoft Planetary Computer), see STAC.
================================================================================
## Writing geospatial
Path: guide/data-input-outputs/read-write/geospatial/writing.mdx
URL: https://docs.fused.io/guide/data-input-outputs/read-write/geospatial/geospatial-writing
# Writing geospatial
When working with geospatial data in Fused we recommend saving files in these formats:
- **Vector data**: GeoParquet
- **Raster data**: Cloud Optimized GeoTIFF (COG)
## Vector: GeoParquet
```python
@fused.udf
def udf():
path = "s3://fused-sample/demo_data/subway_stations.geojson"
gdf = gpd.read_file(path)
# Process data...
output_path = "s3://fused-users/fused/aman/subway_stations.parquet" # change to your own path
gdf.to_parquet(output_path)
return f"File saved to "
```
## Raster: Cloud Optimized GeoTIFF (COG)
```python
@fused.udf
def udf():
path = "s3://fused-sample/demo_data/satellite_imagery/wildfires.tiff"
# Read the raster data
with rasterio.open(path) as src:
data = src.read()
profile = src.profile
# Process the data
processed_data = np.where(data > np.percentile(data, 80), 255, 0).astype(np.uint8)
# Update profile for writing
profile.update()
# Write to Fused's shared disk (accessible to all UDFs in org)
username = fused.api.whoami()['handle']
output_path = f"/mnt/cache/wildfires_processed_.tif"
with rasterio.open(output_path, 'w', **profile) as dst:
dst.write(processed_data)
return f"File saved to shared disk at "
```
## Large Datasets: `fused.ingest()`
For large geospatial datasets, use `fused.ingest()` to create optimized, geo-partitioned files. This enables efficient spatial queries on datasets of any size.
```python
# Ingest Washington DC Census data
job = fused.ingest(
input="https://www2.census.gov/geo/tiger/TIGER_RD18/LAYER/TRACT/tl_rd22_11_tract.zip",
output="s3://fused-users/fused/aman/data/census/partitioned/", # change to your own path
)
job.run_batch()
```
You can tail logs to see how the job is progressing:
```python
fused.api.job_tail_logs("your-job-id")
```
Learn more about geospatial data ingestion.
================================================================================
## Reading files
Path: guide/data-input-outputs/read-write/reading.mdx
URL: https://docs.fused.io/guide/data-input-outputs/read-write/reading
# Reading files
Common examples for reading tabular data in Fused.
For geospatial formats (GeoJSON, Shapefile, GeoTIFF, etc.), see Reading Geospatial Data.
## CSV
```python
@fused.udf
def udf():
path = "s3://fused-sample/demo_data/housing_2024.csv"
return pd.read_csv(path)
```
## Parquet
```python
@fused.udf
def udf():
path = "s3://fused-sample/demo_data/housing_2024.parquet"
return pd.read_parquet(path)
```
## JSON
```python
@fused.udf
def udf():
path = "s3://fused-sample/demo_data/config.json"
return pd.read_json(path)
```
## Excel
```python
@fused.udf
def udf():
path = "s3://fused-sample/demo_data/report.xlsx"
return pd.read_excel(path)
```
## DuckDB (SQL Queries)
Query files directly with SQL using DuckDB:
```python
@fused.udf
def udf():
path = "s3://fused-sample/demo_data/housing_2024.parquet"
conn = duckdb.connect()
result = conn.execute(
"""
SELECT *
FROM read_parquet(?)
WHERE latitude IS NOT NULL
LIMIT 1000
""",
[path],
).df()
return result
```
Using Fused's common utilities for authenticated S3 access:
```python
@fused.udf
def udf():
common = fused.load("https://github.com/fusedio/udfs/tree/main/public/common/")
con = common.duckdb_connect()
df = con.sql("""
SELECT * FROM read_parquet('s3://bucket/data.parquet')
WHERE value > 100
LIMIT 1000
""").df()
return df
```
## Compressed Files (ZIP/RAR)
### ZIP Files
**List files in archive:**
```python
@fused.cache
def get_zip_file_info(url):
s3 = s3fs.S3FileSystem()
with s3.open(url, "rb") as f:
with zipfile.ZipFile(f) as zip_ref:
file_info = []
for filename in zip_ref.namelist():
info = zip_ref.getinfo(filename)
file_info.append()
return pd.DataFrame(file_info)
```
**Extract specific files:**
```python
@fused.cache
def extract_file_from_zip(url, filename, output_path):
s3 = s3fs.S3FileSystem()
with tempfile.NamedTemporaryFile(mode="wb", delete=False, suffix=os.path.splitext(filename)[1]) as output_file:
temp_path = output_file.name
CHUNK_SIZE = 100 * 1024 * 1024 # 100MB chunks
with s3.open(url, "rb") as f:
with zipfile.ZipFile(f) as zip_ref:
with zip_ref.open(filename) as file:
while chunk := file.read(CHUNK_SIZE):
output_file.write(chunk)
s3.put(temp_path, output_path)
return output_path
```
### RAR Files
**List files in archive:**
```python
@fused.cache
def get_rar_file_info(url):
s3 = s3fs.S3FileSystem()
with s3.open(url, "rb") as f:
with rarfile.RarFile(f) as rar_ref:
file_info = []
for filename in rar_ref.namelist():
info = rar_ref.getinfo(filename)
file_info.append()
return pd.DataFrame(file_info)
```
**Extract specific files:**
```python
@fused.cache
def extract_file_from_rar(url, filename, output_path):
s3 = s3fs.S3FileSystem()
with tempfile.NamedTemporaryFile(mode="wb", delete=False, suffix=os.path.splitext(filename)[1]) as output_file:
temp_path = output_file.name
CHUNK_SIZE = 100 * 1024 * 1024 # 100MB chunks
with s3.open(url, "rb") as f:
with rarfile.RarFile(f) as rar_ref:
with rar_ref.open(filename) as file:
while chunk := file.read(CHUNK_SIZE):
output_file.write(chunk)
s3.put(temp_path, output_path)
return output_path
```
Use `.map()` to extract multiple files in parallel.
## Recommended Formats
| Data Type | Recommended Format | Why |
|-----------|-------------------|-----|
| Tables | **Parquet** | Columnar, compressed, fast |
| Large tables | **Partitioned Parquet** | Efficient queries on subsets |
For large datasets (>1GB), consider partitioning your data or using geospatial ingestion for spatial data.
================================================================================
## Writing files
Path: guide/data-input-outputs/read-write/writing.mdx
URL: https://docs.fused.io/guide/data-input-outputs/read-write/writing
# Writing files
Common examples for writing tabular data in Fused.
For geospatial formats (GeoParquet, GeoTIFF, etc.), see Writing Geospatial Data.
## CSV
```python
@fused.udf
def udf():
df = pd.DataFrame()
df.to_csv("s3://fused-users/fused/aman/my-data/output.csv", index=False) # change to your own path
return "Saved!"
```
## Parquet
Parquet is the recommended format for tabular data - it's columnar, compressed, and fast.
```python
@fused.udf
def udf():
path = "s3://fused-sample/demo_data/housing_2024.csv"
df = pd.read_csv(path)
df['price_per_area'] = round(df['price'] / df['area'], 2)
output_path = "s3://fused-users/fused/aman/housing_processed.parquet" # change to your own path
df.to_parquet(output_path)
return f"File saved to "
```
## JSON
```python
@fused.udf
def udf():
df = pd.DataFrame()
df.to_json("s3://fused-users/fused/aman/my-data/output.json") # change to your own path
return "Saved!"
```
## Where to Save Files
| Storage | Path Format | Best For |
|---------|-------------|----------|
| Fused home directory | `s3://fused-users/fused/aman/path/file.parquet` | Persistent storage, sharing |
| Mounted disk | `/mnt/cache/file.parquet` | Temporary files, caching |
| Your own S3 | `s3://bucket/file.parquet` | Enterprise integration |
See Cloud Storage for details on connecting your own buckets.
================================================================================
## First UDF & basics
Path: guide/getting-started/first-udf-basics.mdx
URL: https://docs.fused.io/guide/getting-started/first-udf-basics
# First UDF & basics
## Fused
Fused makes it easy to run Python at scale. You write Python code, and Fused handles execution, scaling, and API generation automatically.
If it runs locally, it runs on Fused — at scale.
It decouples *what you write* from *how it runs* and *where it goes*.
## UDFs
UDFs (User Defined Functions) are Python functions with a `@fused.udf` decorator that return data. Each UDF becomes its own API endpoint with a unique URL.
Try it in Workbench:
```python
@fused.udf
def udf(name: str = "Fused"):
return pd.DataFrame(!']})
```
A UDF needs:
- The `@fused.udf` decorator
- A function (called `udf`)
- Parameters with **type hints** and **default values**
UDFs can return tables (`DataFrame`, `GeoDataFrame`), arrays (`numpy`, `xarray`), or simple Python objects. Learn more about writing UDFs.
## Data
Bring your own data into Fused:
- **Drag & drop** — Drop local files directly into Workbench
- **Cloud storage** — Read from S3, GCS, or Azure (public or connect your own bucket)
- **Databases** — Read from Snowflake, BigQuery, or other databases
- **APIs** — Fetch from any HTTP endpoint
```python
@fused.udf
def udf():
return pd.read_csv("s3://your-bucket/your-data.csv")
```
Need credentials for private data? See secrets management.
## Formats
Share your canvas to get a canvas token; then each UDF is available by name.
[Image: UDF API URL structure: domain, canvas token, UDF name, extension, query params]
Every UDF is a dynamic file system. Same UDF, multiple output formats. Change the URL extension to get JSON, CSV, Parquet, PNG, TIFF, or MVT; no code changes needed!
```
https://udf.ai/fc_/my_udf.json
https://udf.ai/fc_/my_udf.csv
https://udf.ai/fc_/my_udf.parquet
```
Pass parameters via URL to change outputs dynamically:
```
https://udf.ai/fc_/my_udf.json?name=World
```
Learn more about Calling UDFs as API.
## Caching
First request runs your code. Subsequent requests (same code, same parameters) return cached results in under a second. UDFs are cached for 14 days by default.
Try it yourself:
```python
@fused.udf
def udf():
time.sleep(5)
return
```
Run once → 5 seconds. Run again → ~1 second (cached).
Set any cache duration you need, including `0` to force a fresh run every time:
```python
@fused.udf(cache_max_age="0s")
def udf():
time.sleep(5)
return
```
Learn more about caching.
## Pipelines
UDFs can call other UDFs to build data pipelines. Each stays standalone with its own endpoint.
```python
# UDF 1: load_cities
@fused.udf
def udf(continent: str = "Europe"):
cities = pd.DataFrame()
return cities[cities.continent == continent]
```
```python
# UDF 2: big_cities
@fused.udf
def udf(continent: str = "Europe", min_pop: int = 3):
load_cities = fused.load('load_cities')
cities = load_cities(continent=continent)
return cities[cities.population >= min_pop]
```
Here, `fused.load("load_cities")` loads the saved UDF named `load_cities`. It returns a callable UDF object, so `load_cities(continent=continent)` calls the `load_citites` UDF and runs it.
You could also run `load_cities(continent=continent, engine='local')` locally inside the current UDF. This can help limit the number of UDF instances you run at the same time, especially for small functions.
`big_cities` calls `load_cities` and passes through the `continent` param. Both UDFs have their own API endpoint — call either one directly:
```
https://udf.ai/fc_/my_udf.json?continent=Asia&min_pop=5
```
Organise UDFs visually in Canvas — connect them, build workflows, create dashboards.
================================================================================
## Using AI
Path: guide/getting-started/using-ai.mdx
URL: https://docs.fused.io/guide/getting-started/using-ai
# Using AI
Fused supports multiple ways to leverage AI when building and working with UDFs.
## Claude Code & AI Coding Tools (Recommended)
The recommended approach for building with AI is to use AI coding tools like **Claude Code** directly through the CLI with Fused SKILLs. This gives you a powerful, full-featured development experience where AI can read, write, and iterate on your UDFs locally.
See the full guide: AI Coding Tools (Claude Code & others)
This approach is recommended for:
- Building and iterating on UDFs
- Complex multi-file or multi-step tasks
- Full project context and code generation
- Using Claude Code via the CLI with Fused SKILLs
## AI Chat in Workbench
Fused Workbench also includes a built-in AI Chat interface. This is still available and works well for smaller, quick tasks directly in the browser.
AI Chat is recommended for:
- Quick questions about a UDF
- Small edits or fixes
- Exploring Fused capabilities inline
For most development workflows, we recommend using AI coding tools like Claude Code through the CLI for the best experience.
================================================================================
## Workbench intro
Path: guide/getting-started/workbench-intro.mdx
URL: https://docs.fused.io/guide/getting-started/workbench-intro
# Workbench intro
Workbench is Fused's browser based IDE.
[Image: Workbench Preview]
It allows you to:
- Write Python UDFs directly in the browser with built-in dependencies — no local setup needed. For custom packages, see Dependencies.
- Build workflows and shareable dashboards in Canvas
- Browse cloud storage and preview files in File Explorer
## Canvas
Freeform canvas where each UDF is a draggable card. Connect UDFs with the (+) icon to build workflows, annotate with text elements, and create interactive dashboards shareable via link.
[Image: Canvas Preview]
_An example of a workflow in Canvas: Change the crop type to see the changes in the dataframe and map. Try it out →_
**Good for:**
- Chaining UDFs together into repeatable workflows
- Annotating work with text elements next to code
- Creating interactive dashboards shareable with a link
Learn more about Canvas →
## File Explorer
Browse public or private cloud storage buckets. Preview large files directly in the browser, then double-click to open in a UDF and start working.
[Image: File Explorer]
**Good for:**
- Browsing files across different buckets (S3, GCS)
- Previewing large files without writing code
- Quickly opening files in a UDF template
Learn more about File Explorer →
## Map View
A GIS-style layer view for advanced geospatial exploration. Toggle UDFs on/off like layers in QGIS/ArcGIS, with automatic tiling for large datasets based on the viewport.
[Image: UDF Builder]
**Good for:**
- Advanced exploration of large geospatial datasets
- Working across multiple layers (each UDF is a layer)
- Automatic viewport-based tiling for performance
Learn more about Map View →
## Next Steps
- Write your first UDF - Learn everything about UDFs
- Using AI to build - AI is built right at the core of Fused
- Geospatial processing - Learn how to leverage Fused for heavy geospatial workflows
================================================================================
## Aggregations
Path: guide/h3-analytics/aggregations.mdx
URL: https://docs.fused.io/guide/h3-analytics/aggregations
# Aggregate
After ingesting a dataset to H3 hexagons it's possible to visualize it in Fused but we can also directly work with the data.
This page shows how to aggregate data at different resolutions or create derivative layers.
[Image: Aggregating H3 Data]
Example aggregating elevation data across the US at different H3 resolutions:
```python showLineNumbers
@fused.udf
def udf(
bounds: fused.types.Bounds = [-74.556, 40.400, -73.374, 41.029], # Default to full NYC
):
path = "s3://fused-asset/hex/copernicus-dem-90m/"
hex_reader = fused.load("https://github.com/fusedio/udfs/tree/9780aef/community/joris/Read_H3_dataset/")
df = hex_reader.read_h3_dataset(path, bounds, res=None) # res=None lets the hex_reader determine the resolution based on the current bounds
return df
```
You can already use the h3_reader.read_h3_dataset and specify:
- `res` at a specific resolution
- `value` to filter on a specific value (especially for categorical data)
This reader uses DuckDB under the hood to read the data meaning you can write additional queries _after_ reading the data as shown in creating derivative layers.
## Aggregate at lower resolutions
H3 hexagons allow for aggregation at different resolutions. The ingestion process already creates overviews at different H3 resolutions - see Resolution Guide for details.
### Numerical data
Example numerical values:
- Temperature
- Elevation
- Income
- Population
Aggregating means:
- Summing values (i.e. how many people live in a H3 cell in total)
- Taking mean / max / min / stddev (i.e. what is the average temperature in a H3 cell)
Example: Aggregating elevation across the US at different H3 levels
```python showLineNumbers
@fused.udf
def udf(
bounds: fused.types.Bounds = [-74.556, 40.400, -73.374, 41.029], # Default to full NYC
res: int = 4, # Default to H3 resolution 4
):
path = "s3://fused-asset/hex/copernicus-dem-90m/"
hex_reader = fused.load("https://github.com/fusedio/udfs/tree/9780aef/community/joris/Read_H3_dataset/")
df = hex_reader.read_h3_dataset(
path,
bounds,
res=res
)
return df
```
### Categorical data
Example categorical data:
- Land Use
- Crop Type
- Zone
Aggregating means:
- Counting values (i.e. how many different crop types are there in a H3 cell)
- Taking mode (i.e. what is the most common crop type in a H3 cell)
Example: Aggregating Corn yields across the US at different H3 levels
```python showLineNumbers
@fused.udf
def udf(
bounds: fused.types.Bounds = [-127.54220803198237,10.667151173068717,-66.93703570835524,55.22298640160706],
res: int = None, # if left to None, hex_reader will determine resolution itself
data_value: int = 1, # 1=Corn in CDL for this example
year: int = 2024,
):
path = f"s3://fused-asset/hex/cdls_v8/year=/"
common = fused.load("https://github.com/fusedio/udfs/tree/b6786d6/public/common/")
hex_reader = fused.load("https://github.com/fusedio/udfs/tree/9780aef/community/joris/Read_H3_dataset/")
# Read all hexagons where the CDL value matches the requested data class (e.g. Corn)
df = hex_reader.read_h3_dataset(path, bounds, res=res, value=data_value)
print(df.T)
if 'pct' not in df.columns:
# Dynamically compute the % of each hex covered by the specified crop type
data_res = h3.get_resolution(df["hex"].iloc[0])
print(f"")
con = common.duckdb_connect()
df = con.execute(
"""
SELECT
hex,
SUM(area) AS total_area,
ANY_VALUE(data) AS data,
h3_get_hexagon_area_avg(?, 'm^2') AS hex_area,
(SUM(area) / h3_get_hexagon_area_avg(?, 'm^2')) * 100 AS pct
FROM df
WHERE data = ?
GROUP BY hex
""",
[data_res, data_res, data_value],
).df()
print(df.shape)
if df.shape[0] > 0:
return df
else:
return None
```
```python showLineNumbers
@fused.udf
def udf(
bounds: fused.types.Bounds = [-74.556, 40.400, -73.374, 41.029], # Default to full NYC
):
path = "s3://fused-asset/hex/copernicus-dem-90m/"
hex_reader = fused.load("https://github.com/fusedio/udfs/tree/9780aef/community/joris/Read_H3_dataset/")
df = hex_reader.read_h3_dataset(path, bounds, res=None)
# Slope calculation using h3_grid_ring
common = fused.load("https://github.com/fusedio/udfs/tree/b6786d6/public/common/")
con = common.duckdb_connect()
qr = """
WITH hex_neighbors AS (
SELECT
h1.hex AS hex,
h1.data_avg AS elevation,
UNNEST(h3_grid_ring(h1.hex, 1)) AS neighbor_hex
FROM df h1 -- Notice that DuckDB allows you to directly call the dataframe by its name
),
neighbor_data AS (
SELECT
n.hex,
n.elevation,
n.neighbor_hex,
df2.data_avg AS neighbor_elevation,
h3_get_hexagon_edge_length_avg(h3_get_resolution(n.hex), 'm') AS edge_length_m
FROM hex_neighbors n
JOIN df df2 ON n.neighbor_hex = df2.hex
),
calculations AS (
SELECT
hex,
elevation,
DEGREES(ATAN(ABS(elevation - neighbor_elevation) / edge_length_m)) AS slope_deg
FROM neighbor_data
),
slope_aggregated AS (
SELECT
hex,
elevation,
AVG(slope_deg) * 100 AS avg_slope_deg,
MAX(slope_deg) * 100 AS max_slope_deg
FROM calculations
GROUP BY hex, elevation
)
SELECT
s.hex,
ROUND(s.elevation, 2) AS elevation,
ROUND(s.avg_slope_deg, 2) AS avg_slope_deg,
ROUND(s.max_slope_deg, 2) AS max_slope_deg
FROM slope_aggregated s;
"""
processed_df = con.execute(qr).df()
print(processed_df.describe())
return processed_df
```
================================================================================
## Converting to H3
Path: guide/h3-analytics/converting.mdx
URL: https://docs.fused.io/guide/h3-analytics/converting
# Converting Data to H3
This page covers different methods to convert your data into H3 hexagons.
Try the examples on this page in Canvas →
---
## File to H3
Turning a single small dataset into a grid of H3 hexagons.
### Point Count to Hex
The following example uses a simple CSV of 311 calls in the New York City area, showing a heatmap of calls per hex 9 cell:
```python showLineNumbers
@fused.udf
def udf(
res: int = 9
):
noise_311_link = "https://gist.githubusercontent.com/kashuk/670a350ea1f9fc543c3f6916ab392f62/raw/4c5ced45cc94d5b00e3699dd211ad7125ee6c4d3/NYC311_noise.csv"
# Load common utilities (includes duckdb helper)
common = fused.load("https://github.com/fusedio/udfs/tree/b6786d6/public/common/")
con = common.duckdb_connect()
df = con.execute(
"""
SELECT
h3_latlng_to_cell(lat, lng, ?) AS hex,
COUNT(*) AS cnt
FROM read_csv_auto(?)
WHERE lat IS NOT NULL AND lng IS NOT NULL
GROUP BY 1
""",
[res, noise_311_link],
).df()
# Visualize as a heatmap of call counts per hex
map_utils = fused.load("https://github.com/fusedio/udfs/tree/3ada22d/community/milind/map_utils")
layers = [
,
"filled": True,
"extruded": False,
"stroked": False,
"opacity": 0.7,
}
},
},
]
return map_utils.deckgl_layers(layers=layers, basemap="dark")
```
Link to UDF in Fused Catalog
```python showLineNumbers
@fused.udf
def udf(
bounds: fused.types.Bounds = [-125.0, 24.0, -66.9, 49.0],
min_hex_cell_res: int= 11, # Increase this if working with high res local data
max_hex_cell_res: int= 4,
):
common = fused.load("https://github.com/fusedio/udfs/tree/b6786d6/public/common/")
path = "s3://fused-asset/demos/catchment_analysis/simplified_acs_bg_ca_2022.parquet"
# Dynamic H3 resolution
def dynamic_h3_res(b):
z = common.estimate_zoom(b)
return max(min(int(2 + z / 1.5),min_hex_cell_res), max_hex_cell_res)
parent_res = max(dynamic_h3_res(bounds) - 1, 0)
# Load and clip data
gdf = gpd.read_parquet(path)
tile = common.get_tiles(bounds, clip=True)
gdf = gdf.to_crs(4326).clip(tile)
# Early exit if empty
if len(gdf) == 0:
return pd.DataFrame(columns=["hex", "POP", "pct"])
# Hexify
con = common.duckdb_connect()
df_hex = common.gdf_to_hex(gdf, res=parent_res, add_latlng_cols=None)
con.register("df_hex", df_hex)
# Aggregate to parent hexagons and calculate percentages
# In this case we're aggregating by sum
query = """
WITH agg AS (
SELECT
h3_cell_to_parent(hex, ?) AS hex,
SUM(POP) AS POP
FROM df_hex
GROUP BY hex
)
SELECT
hex,
POP,
POP * 100.0 / SUM(POP) OVER () AS pct
FROM agg
ORDER BY POP DESC
"""
return con.execute(query, [parent_res]).df()
```
Link to UDF in Fused Catalog
```python showLineNumbers
@fused.udf
def udf(bounds: fused.types.Bounds = [-73.983, 40.763, -73.969, 40.773]):
common = fused.load("https://github.com/fusedio/udfs/tree/b6786d6/public/common/")
tile = common.get_tiles(bounds, clip=True)
x, y, z = tile.iloc[0][["x", "y", "z"]]
url = f"https://s3.amazonaws.com/elevation-tiles-prod/geotiff///.tif"
res_offset = 0
h3_size = max(min(int(3 + z / 1.5), 12) - res_offset, 2)
con = common.duckdb_connect()
da_tiff = rioxarray.open_rasterio(url).squeeze(drop=True).rio.reproject("EPSG:4326")
df_tiff = da_tiff.to_dataframe("data").reset_index()[["y", "x", "data"]]
df = con.execute(
"""
SELECT
h3_latlng_to_cell(y, x, ?) AS hex,
AVG(data) AS elevation
FROM df_tiff
GROUP BY 1
""",
[h3_size],
).df()
df = df[df["elevation"] > 0]
map_utils = fused.load("https://github.com/fusedio/udfs/tree/3ada22d/community/milind/map_utils")
layers = [
,
"filled": True,
"extruded": False,
"stroked": False,
"opacity": 0.7,
}
},
},
]
return map_utils.deckgl_layers(layers=layers, basemap="dark")
```
```python showLineNumbers
@fused.udf
def udf(
bounds: fused.types.Bounds = [-73.983, 40.763, -73.969, 40.773],
res: int = None,
):
# Cropland Data Layer ingested with "cnt" metric
path = "s3://fused-asset/hex/cdls_v8/year=2024/"
utils = fused.load("https://github.com/fusedio/udfs/tree/9780aef/community/joris/Read_H3_dataset")
df = utils.read_h3_dataset(path, bounds, res=res)
return df
```
```
hex data cnt cnt_total
0 626740321835323391 122 12 14
1 626740321835323391 123 1 14
2 626740321835323391 121 1 14
```
Each H3 cell can have multiple rows (one per category).
```python showLineNumbers
@fused.udf
def udf(
bounds: fused.types.Bounds = [-73.983, 40.763, -73.969, 40.773],
res: int = None,
):
path = "s3://fused-asset/hex/nyc_dem/"
utils = fused.load("https://github.com/fusedio/udfs/tree/9780aef/community/joris/Read_H3_dataset")
df = utils.read_h3_dataset(path, bounds, res=res)
return df
```
```
hex data_avg
0 617733122581069823 78.822576
1 617733122610954239 78.225562
```
Use `map_utils.deckgl_layers` to render the hexagons on a standalone map:
```python showLineNumbers
@fused.udf
def udf(
bounds: fused.types.Bounds = [-74.556, 40.400, -73.374, 41.029],
res: int = 9,
):
path = "s3://fused-asset/hex/nyc_dem/"
utils = fused.load("https://github.com/fusedio/udfs/tree/9780aef/community/joris/Read_H3_dataset/")
df = utils.read_h3_dataset(path, bounds, res=res)
map_utils = fused.load("https://github.com/fusedio/udfs/tree/3ada22d/community/milind/map_utils")
layers = [
,
"filled": True,
"extruded": False,
"stroked": False,
"opacity": 0.7,
}
},
},
]
return map_utils.deckgl_layers(layers=layers, basemap="dark")
```
For more on standalone maps, see Standalone Maps. For Workbench styling, see H3 Visualization.
---
### Vector to H3
For vector data, use `.map()` to parallelize hexagonification:
The `ai-chat` widget requires you to be logged in to fused.io. Unauthenticated viewers will see a login prompt.
### How to add it
1. Click the **Widget** icon in the canvas toolbar to add a new widget node
2. In the widget JSON editor, click **Presets** and select **ai-chat**
3. Connect the UDF nodes you want the chat to query by drawing edges from them to the widget node
The preset inserts this widget JSON:
```json
}
```
All props are optional. You can add a `systemPromptExtra` string to give the AI extra instructions specific to your data:
```json
}
```
For full widget documentation including all available props and how to compose widgets, see Widgets.
---
## See also
- Widgets — full reference for all widget types including `ai-chat`
- Building for Agents — how to design UDFs that work well as MCP tools
- Overture Maps MCP Agent — a complete example of a canvas exposed as an MCP server
- Tokens & endpoints — managing canvas access and session tokens
- Write UDFs securely — security considerations for agent-facing UDFs
================================================================================
## Cloud storage
Path: guide/data-input-outputs/import-connection/cloud-storage.mdx
URL: https://docs.fused.io/guide/data-input-outputs/import-connection/cloud-storage
# Cloud storage
Fused supports multiple cloud storage options for reading and writing data.
## Supported storage paths
| Provider | Format | Example |
|----------|--------|---------|
| Fused home directory | `s3://` | `s3://fused-users/fused/aman/my-data/file.parquet` |
| Fused public assets | `s3://` | `s3://fused-asset/path/file.parquet` |
| Source Cooperative | `s3://` | `s3://us-west-2.opendata.source.coop/path/file.parquet` |
| Google Cloud | `gs://` or `gcs://` | `gs://bucket-name/path/file.parquet` |
| HTTP(S) | `https://` | `https://example.com/file.csv` |
For details on using your Fused home directory and the `/mnt/cache` disk, see Storage options.
## Connect your own bucket
Connect S3 or GCS buckets to access their files interactively from within the File Explorer UI and programmatically from within UDFs.
Contact Fused to set an S3 or GCS bucket on the File Explorer for all users in your organization. Alternatively, set a bucket as a "favorite" so it appears in the File Explorer for your account only.
### Amazon S3
Set the policy below on your bucket, replacing `YOUR_BUCKET_NAME` with its name. Fused will provide `YOUR_ENV_NAME`.
Alternatively, use this Fused app to automatically structure the policy for you.
The bucket must enable the following CORS settings to allow uploading files from Fused:
#### Encrypted S3 Buckets
If your bucket uses server-side encryption with AWS KMS (SSE-KMS), additional KMS and bucket policy configuration is required. See Amazon S3 integration for full step-by-step instructions.
### Google Cloud Storage (GCS)
To connect a Google Cloud Storage bucket to your Fused environment:
**1. Create a Service Account in GCS**
Set up a Google Cloud service account with permissions to read, write, and list from the GCS bucket. See the Google Cloud documentation for instructions to:
- Create a Service Account
- Set permissions for the Service Account
**2. Download the JSON Key File**
Download the JSON Key file associated with the Service Account. This file contains credentials that Fused will use to access the GCS bucket.
**3. Set the JSON Key as a Secret**
Set the JSON Key as a secret in the secrets management UI. The secret must be named `gcs_fused`.
You then need to write these credentials to a JSON file and pass them to Google:
```python
@fused.udf
def udf():
from google.cloud import storage
# get GCP secrets
with open("/tmp/gcs_key.json", "w") as f:
f.write(fused.secrets["gcs_fused"])
os.environ["GOOGLE_APPLICATION_CREDENTIALS"] = "/tmp/gcs_key.json"
# your code here
```
## Read & write examples
### Reading from S3
```python
@fused.udf
def udf():
path = "s3://fused-sample/demo_data/housing_2024.csv"
return pd.read_csv(path)
```
### Writing to S3
```python
df.to_parquet("s3://my-bucket/data.parquet")
```
### Writing to GCS
```python
df.to_parquet("gcs://my-bucket/data.parquet")
```
### Download to Fused mount
```python
@fused.udf
def udf(url='https://www2.census.gov/geo/tiger/TIGER_RD18/STATE/11_DISTRICT_OF_COLUMBIA/11/tl_rd22_11_bg.zip'):
out_path = fused.download(url=url, file_path='out.zip')
return str(out_path)
```
Files will be written to `/mnt/cache/`, where any other UDF can then access them.
## Downloading large remote files
For datasets from external sources like Zenodo or Humanitarian Data Exchange that take longer than 120s to download, run as a batch job:
```python showLineNumbers
@fused.udf(
engine='c2-standard-4', # Small instance - download uses little resources
disk_size_gb=999 # Large disk for the file
)
def udf():
url = "https://zenodo.org/records/4395621/files/my_large_file.zip"
s3_path = f"s3://fused-asset/data/my-files/"
# Skip if already downloaded
if s3fs.S3FileSystem().exists(s3_path):
return f'File exists: '
# Download with progress
temp_path = tempfile.NamedTemporaryFile(delete=False).name
resp = requests.get(url, stream=True)
resp.raise_for_status()
with open(temp_path, 'wb') as f:
for chunk in resp.iter_content(chunk_size=8192):
f.write(chunk)
# Upload to S3
s3fs.S3FileSystem().put(temp_path, s3_path)
return f"Uploaded to: "
```
Once downloaded, use the Reading Data guide for extracting compressed files (ZIP/RAR).
## `/mnt/cache` disk
`/mnt/cache` is the path to a mounted disk to store files shared between UDFs. This is where `@fused.cache` and `fused.download` write data. It's ideal for files that UDFs need to read with low-latency, downloaded files, the output of cached functions, access keys, `.env`, and ML model weights.
UDFs may interact with the disk as with a local file system:
```python showLineNumbers
# Write to mount
df.to_parquet("/mnt/cache/data.parquet")
# List files
@fused.udf
def udf():
for each in os.listdir('/mnt/cache/'):
print(each)
```
If you encounter `Error: No such file or directory: '/mnt/cache/'`, contact the Fused team to enable it for your environment.
================================================================================
## Databases
Path: guide/data-input-outputs/import-connection/databases.mdx
URL: https://docs.fused.io/guide/data-input-outputs/import-connection/databases
# Databases
Connect Fused to external databases. See the dedicated integration guides:
- Snowflake
- BigQuery
================================================================================
## Google Earth Engine
Path: guide/data-input-outputs/import-connection/geospatial/gee.mdx
URL: https://docs.fused.io/guide/data-input-outputs/import-connection/geospatial/gee
# Google Earth Engine
Fused interfaces Google Earth Engine with the Python `earthengine-api` library. This example shows how to load data from GEE datasets into Fused UDFs and read it with xarray.
### 1. Authenticate with a Google Service Account
Create a UDF to set your Google Service Account credentials in your Fused runtime disk in a file in the `/mnt/cache` directory.
```python showLineNumbers
@fused.udf
def udf():
# Google Key as JSON
data =
# Define the target path for the new GEE credentials file
key_path = '/mnt/cache/gee_creds.json'
# Write the loaded JSON data to the new file
with open(key_path, 'w') as file:
json.dump(data, file)
```
### 2. Load data from Google Earth Engine
Create a UDF to load data from a GEE ImageCollection and open it with xarray. Authenticate by passing the key file path to `ee.ServiceAccountCredentials`.
```python showLineNumbers
@fused.udf
def udf(bounds: fused.types.TileGDF=None, n=10):
common = fused.load("https://github.com/fusedio/udfs/tree/fbf5682/public/common/")
# Authenticate GEE
key_path = '/mnt/cache/gee_creds.json'
credentials = ee.ServiceAccountCredentials("fused-account@fused-gee.iam.gserviceaccount.com", key_path)
ee.Initialize(opt_url="https://earthengine-highvolume.googleapis.com", credentials=credentials)
# Generate GEE bounding box for spatial filter
geom = ee.Geometry.Rectangle(*bounds.total_bounds)
scale = 1 / 2 ** max(0, bounds.z[0]) # A larger scale will increase your resolution per z but slow down the loading
# Load data from a GEE ImageCollection
ic = ee.ImageCollection("MODIS/061/MOD13A2").filter(
ee.Filter.date("2023-01-01", "2023-06-01")
)
# Open with xarray (the `xee` package must be present for engine="ee" to work)
ds = xarray.open_dataset(ic, engine="ee", geometry=geom, scale=scale).isel(time=0)
# Transform image color with a utility function
arr = common.arr_to_plasma(ds["NDVI"].values.squeeze().T, min_max=(0, 8000))
return arr
```
================================================================================
## STAC Catalogs
Path: guide/data-input-outputs/import-connection/geospatial/stac.mdx
URL: https://docs.fused.io/guide/data-input-outputs/import-connection/geospatial/stac
# STAC Catalogs
Access STAC (SpatioTemporal Asset Catalog) catalogs with pystac and odc.stac.
## Earth on AWS
```python showLineNumbers
@fused.udf
def udf(
bounds: fused.types.Bounds = [-77.083, 38.804, -76.969, 38.983],
):
odc.stac.configure_s3_access(aws_unsigned=True)
catalog = pystac_client.Client.open("https://earth-search.aws.element84.com/v1")
# Loading Elevation model
items = catalog.search(
collections=["cop-dem-glo-30"],
bbox=bounds
).item_collection()
xarray_dataset = odc.stac.load(
items,
crs="EPSG:3857",
bands=["data"],
resolution=150,
bbox=bounds,
).astype(int)
return xarray_dataset["data"], bounds
```
## Microsoft Planetary Computer
```python showLineNumbers
@fused.udf
def udf(
bounds: fused.types.Bounds = [-122.463,37.755,-122.376,37.803],
):
catalog = pystac_client.Client.open(
"https://planetarycomputer.microsoft.com/api/stac/v1",
modifier=planetary_computer.sign_inplace,
)
# Loading Elevation model
items = catalog.search(collections=["cop-dem-glo-30"],bbox=bounds).item_collection()
xarray_dataset = odc.stac.load(
items,
crs="EPSG:3857",
bands=["data"],
resolution=150,
bbox=bounds,
).astype(int)
return xarray_dataset["data"], bounds
```
================================================================================
## Local files
Path: guide/data-input-outputs/import-connection/local-files.mdx
URL: https://docs.fused.io/guide/data-input-outputs/import-connection/local-files
# Local files
Quickly bring any local data into Fused.
## Drag & drop
Drop files directly into the File Explorer:
[Image: Drag and drop files directly into Workbench]
## Upload with Python
Install `fused`, authenticate & run:
```python
fused.api.upload("my_local_file.csv", "s3://fused-users/fused/aman/my_data/file.csv") # change to your own path
```
Your Fused home directory is the private S3 path attached to your account.
## Optimize data loading
**For files < 1GB:** Use function caching to speed up loading:
```python
@fused.udf
def udf():
path = "s3://fused-sample/demo_data/housing_2024.csv"
@fused.cache
def load_data():
return pd.read_csv(path)
return load_data()
```
This is especially useful for slow formats (CSV, Excel, etc.).
**For files > 1GB:** Use Geospatial Ingestion to create cloud-optimized, partitioned files:
```python
job = fused.ingest(
input="https://www2.census.gov/geo/tiger/TIGER_RD18/LAYER/TRACT/tl_rd22_11_tract.zip",
output="s3://fused-users/fused/aman/census/dc_tract/", # change to your own path
)
job.run_batch()
```
================================================================================
## Using AI inside a UDF
Path: guide/data-input-outputs/import-connection/using-ai-inside-udf.mdx
URL: https://docs.fused.io/guide/data-input-outputs/import-connection/using-ai-inside-udf
You can call large language models directly from inside a UDF with `job2.ai`. No API keys or token management — Fused handles authentication through your account.
Every call to `ai.run()` counts against your AI token quota. Track your usage on the Profile page in Workbench.
## Talk to AI from a UDF
```python
@fused.udf
def udf():
from job2 import ai
from job2.ai import AiModel
response = ai.run(
prompt="Summarize the key benefits of vector databases.",
system_prompt="You are a concise technical writer. Answer in 1 sentence",
model=AiModel.GPT_OSS_120B,
)
return response.text
```
Vector databases enable fast similarity search on high‑dimensional embeddings, scale efficiently with billions of vectors, support real‑time updates and hybrid filtering, and integrate seamlessly with AI/ML pipelines for semantic retrieval and recommendation tasks.
`job2` is available in the Fused runtime — no installation required. The default model is `AiModel.GPT_OSS_120B`, an open-source model suitable for most tasks. Pass a `system_prompt` to shape persona and constraints. `ai.run()` also supports OpenAI-style tool calling, where `tools` and `tool_handler` use the same mechanism that powers user-defined tools in AI Chat.
Wrap `ai.run()` in a `@fused.cache`-decorated helper during development so identical prompts don't re-spend tokens on every run.
================================================================================
## Widgets
Path: guide/data-input-outputs/import-connection/widgets.mdx
URL: https://docs.fused.io/guide/data-input-outputs/import-connection/widgets
# Widgets
```python
@fused.udf
def udf(selected_option: str = "orders"):
from datetime import datetime, timedelta
np.random.seed(42)
end_date = datetime.now()
dates = [end_date - timedelta(days=i) for i in range(29, -1, -1)]
df = pd.DataFrame()
col = selected_option if selected_option in ("orders", "revenue") else "orders"
return df[["date", col]].rename(columns=)
```
```json
,
"children": [
},
}",
"barColor": "#E8FF59",
"showGrid": true,
"showValues": true,
"beginAtZero": true
}
}
]
}
```
```python
@fused.udf
def udf():
path = "s3://fused-sample/demo_data/airbnb_listings_sf.parquet"
@fused.cache
def load_data(file_path):
return pd.read_parquet(file_path)
df = load_data(path)
return df
```
```json
} GROUP BY neighbourhood_cleansed ORDER BY value DESC LIMIT 10",
"title": "Top 10 Most Expensive Neighbourhoods"
}
},
"showEditor": true,
"editorCollapsed": false,
"aiBuilderMode": true,
"aiPanel": "right"
}
}
```
*When you share a widget URL, Fused automatically appends all canvas parameters as query parameters so the shared view can be reproduced exactly.* Try it out →
## Map widgets
```python
@fused.udf
def udf():
path = "s3://fused-sample/demo_data/airbnb_listings_sf.parquet"
df = pd.read_parquet(path).dropna(subset=["latitude", "longitude", "price_in_dollar"])
gdf = gpd.GeoDataFrame(
df, geometry=gpd.points_from_xy(df["longitude"], df["latitude"]), crs="EPSG:4326"
)
grouped = gdf.groupby("neighbourhood_cleansed")
return gpd.GeoDataFrame(
,
crs="EPSG:4326",
)
```
```python
@fused.udf
def udf(bounds: fused.types.Bounds = [-122.446, 37.756, -122.430, 37.770]):
table_path = "s3://fused-asset/infra/building_msft_us"
common = fused.load("https://github.com/fusedio/udfs/tree/fbf5682/public/common/")
return common.table_to_tile(bounds, table=table_path)
```
```python
@fused.udf
def udf(
bounds: fused.types.Bounds = [-122.6, 37.2, -121.7, 38.0],
path: str = "s3://fused-asset/demos/seismic_data/v2023_1_pga_475_rock_3min.tif",
):
common = fused.load("https://github.com/fusedio/udfs/tree/fbf5682/public/common/")
tile = common.get_tiles(bounds, zoom=common.estimate_zoom(bounds))
arr = common.read_tiff(tile, input_tiff_path=path)
return common.arr_to_plasma(arr.filled(0), min_max=(0, 1.5))
```
```python
@fused.udf
def udf():
path = "s3://fused-sample/demo_data/airbnb_listings_sf.parquet"
df = pd.read_parquet(path).dropna(subset=["latitude", "longitude", "price_in_dollar"])
return df[["name", "latitude", "longitude", "price_in_dollar", "room_type"]]
```
## Multi-Component Widgets
A single widget node can hold multiple widgets — sliders, charts, tables, text, maps — stacked or laid out together. You wrap them in a `div` with `children`.
Use a `div` as the root container type and list each widget inside its `children` array — the structure is just a wrapper with standard CSS for layout.
```json
,
"children": [
},
},
}
]
}
```
- `type: "div"` — a container, not a visual widget. It just groups children.
- `props.style` — standard CSS. Use `flex-direction: column` for a vertical stack, `row` for side-by-side.
- `children` — an ordered array of widget definitions ``. Each child is a full widget. For the full list of supported widgets, see the Widget API reference.
You can nest a `div` inside another `div` for more complex layouts.
### Combining input & output components
Multiple components can also work together inside a single widget:
- An input component (like a slider) publishes a value through `param`
- An output component (like a chart) can read that value with `$param`
This lets you build interactive widgets with both inputs and outputs in a single widget.
### Example
When the slider changes, every widget using `$param` (here `$top_n`) updates instantly — the bar chart and SQL table re-render in sync with the slider value. Try it out →
```python
@fused.udf
def udf():
path = "s3://fused-sample/demo_data/airbnb_listings_sf.parquet"
@fused.cache
def load_data(file_path):
return pd.read_parquet(file_path)
df = load_data(path)
return df
```
```json
,
"children": [
},
} GROUP BY neighbourhood_cleansed ORDER BY value DESC LIMIT $top_n",
"barColor": "#E8FF59",
"barOpacity": 1,
"barRadius": 4,
"hoverColor": "#ffffff",
"showGrid": true,
"rotateLabels": true,
"horizontal": false,
"showValues": true,
"xAxisFontSize": 11,
"yAxisFontSize": 11,
"beginAtZero": true,
"animationMs": 300
}
},
} WHERE neighbourhood_cleansed IN (SELECT neighbourhood_cleansed FROM } GROUP BY neighbourhood_cleansed ORDER BY AVG(price_in_dollar) DESC LIMIT $top_n) GROUP BY neighbourhood_cleansed ORDER BY Avg_Price DESC"
}
}
]
}
```
[Image: Multi-widget slider updating chart and table]
================================================================================
## Geospatial Ingestion
Path: guide/data-input-outputs/read-write/geospatial/ingestion.mdx
URL: https://docs.fused.io/guide/data-input-outputs/read-write/geospatial/ingestion
# Geospatial Data Ingestion
_This page gives you tools to make your data fast to read so your UDFs are more responsive._
## Why Ingestion?
The whole purpose of Fused is to speed up data science pipelines. To make this happen we need data to be responsive, regardless of size. The ideal solution is to have all data sitting in RAM right next to compute, but in real-world applications:
- Datasets (especially geospatial data) can be in the Tb or Pb range which rarely fit in storage, let alone RAM
- Compute needs to be scaled up and down depending on workloads
One solution is **Cloud Optimized formats**: Data lives in the cloud but also leverages file formats that are fast to access. Just putting a `.zip` file that needs to be uncompressed at every read on an S3 bucket is still very slow. Ingested data should be:
- **On the cloud** so dataset size doesn't matter (AWS S3, Google Cloud Storage, etc.)
- **Partitioned** (broken down into smaller pieces that are fast to retrieve so we can load only sections of the dataset we need)
This makes it fast to read for any UDF, so developing in Map Builder & running UDFs is a lot faster & responsive!
### When is ingestion needed?
You don't _always_ need to ingest your file into a cloud, geo-partitioned format:
- Small files (< 100Mb) that are fast to open (already in `.parquet`) that you only read once
**Example of data you should ingest:** 1Gb `.zip` of shapefile
- `.zip` means you need to unzip your file each time you open it. This slows down working with the data _every time_.
- shapefile contains multiple files, it isn't the fastest to read
**Example of data you don't need to ingest:** 50Mb `.parquet`
- Even if the data isn't geo-partitioned, loading this data should be fast enough
---
## Ingest Geospatial Table Data
If you only need to store a file in cloud storage, use `fused.api.upload()` or drag and drop it in Workbench. If you want fast spatial reads on large geospatial data, use `fused.ingest()`.
| Topic | `fused.api.upload` | `fused.ingest` |
|---|---|---|
| What it does | Uploads a file to S3 as-is | Converts data into partitioned GeoParquet for fast spatial reads |
| Execution | Runs immediately | Starts a batch job with `run_batch()` |
| Output | One uploaded file | A folder of `.parquet` files plus a `_sample` spatial index |
| Storage | `s3://` bucket | `s3://` bucket |
| Transforms data? | No, stores the file as-is | Yes, partitions data, writes indexes, and can explode geometries |
| Spatial indexing? | No | Yes, via the `_sample` file |
To run an ingestion job on vector data we need:
1. **Input data** - This could be CSV files, a `.zip` containing shapefiles or any other non-partitioned data
2. **A cloud directory** - Where we save ingested data and later access it through UDFs
Our ingestion process:
1. Uploads the `input`
2. Creates geo-partitions of the input data
This is defined with `fused.ingest()`:
```python showLineNumbers
# Run this locally - not in Workbench
job = fused.ingest(
input="https://www2.census.gov/geo/tiger/TIGER_RD18/LAYER/TRACT/tl_rd22_11_tract.zip",
output="s3://fused-users/fused/aman/census/dc_tract/", # change to your own path
)
```
Ingestion jobs often take more than a few seconds and require a lot of RAM, making this a large run. Use `run_batch()` so your ingestion job can take as long as needed.
```python showLineNumbers
# doctest: skip
# Run this locally - not in Workbench
job_id = job.run_batch()
```
Refer to the dedicated documentation page for `fused.ingest()` for more details on all parameters
## Reading Ingested Data
Ingested tables can easily be read with the Fused utility function `table_to_tile`, which spatially filters the dataset and reads only the chunks within a specified polygon.
```python showLineNumbers
@fused.udf
def udf(
bounds: fused.types.Bounds = None,
table="s3://fused-asset/infra/building_msft_us/"
):
common = fused.load("https://github.com/fusedio/udfs/tree/fbf5682/public/common/")
return common.table_to_tile(bounds, table)
```
### The `_sample` File
When `fused.ingest()` runs, it creates a folder of partitioned Parquet files alongside a small file called `_sample`:
```
s3://fused-asset/infra/building_msft_us/
├── 0.parquet
├── 1.parquet
├── 2.parquet
├── ...
└── _sample ← spatial index
```
Each numbered Parquet file can contain multiple **row groups** (chunks). `_sample` is the spatial index that maps every chunk to its geographic extent so readers can skip irrelevant files entirely.
---
### Reading `_sample`
You can read the spatial index to inspect chunk bounding boxes:
```python showLineNumbers
df = fused.get_chunks_metadata("s3://fused-asset/infra/building_msft_us/")
```
This returns a GeoDataFrame with one row per chunk, including `file_id`, `chunk_id`, bounding box coordinates, and a `geometry` column.
In File Explorer, double-clicking a `_sample` file automatically generates a ready-to-run UDF that reads the ingested table.
---
### Reading Ingested Metadata
`fused.get_chunks_metadata()` reads the spatial index of an ingested table and returns one row per chunk, each with its bounding box and a `file_id` / `chunk_id` pair. You can spatially filter those rows by an area of interest to find exactly which chunks you need, then read only those — skipping the rest of the dataset entirely.
The example below uses Overture Maps buildings to show how to read only a subset of data for a small area. Try it on Fused Canvas →
**Step 1 — Read the chunk index**
```python showLineNumbers
@fused.udf
def udf(
release: str = "2025-05-21-0",
theme: str = "buildings",
type: str = "building",
part: str = "0",
):
path = f"s3://us-west-2.opendata.source.coop/fused/overture//theme=/type=/part=/"
return fused.get_chunks_metadata(path)
```
`file_id` and `chunk_id` are the coordinates you pass to `fused.get_chunk_from_table()` to read a specific chunk — everything else is metadata to help you filter.
**Step 2 — Filter by AOI**
Pass a bounding box and intersect it with the chunk geometries to find which `file_id` / `chunk_id` pairs overlap your area of interest.
```python showLineNumbers
@fused.udf
def udf(
bounds: fused.types.Bounds = [-122.42, 37.77, -122.40, 37.79],
release: str = "2025-05-21-0",
theme: str = "buildings",
type: str = "building",
part: str = "0",
):
from shapely.geometry import box
path = f"s3://us-west-2.opendata.source.coop/fused/overture//theme=/type=/part=/"
chunks_meta = fused.get_chunks_metadata(path)
aoi = box(*bounds)
return chunks_meta[chunks_meta.intersects(aoi)]
```
---
## Common Ingestion Patterns
### Ingest a table from a URL
Ingests a table from a URL and writes it to your Fused home directory in S3.
```python showLineNumbers
job_id = fused.ingest(
input="https://www2.census.gov/geo/tiger/TIGER_RD18/LAYER/TRACT/tl_rd22_11_tract.zip",
output="s3://fused-users/fused/max/census/dc_tract/", # <- replace with your own path,
).run_batch()
```
### Ingest multiple files
```python showLineNumbers
job_id = fused.ingest(
input=["s3://my-bucket/file1.parquet", "s3://my-bucket/file2.parquet"],
output="s3://fused-users/fused/max/census/dc_tract/", # <- replace with your own path,
).run_batch()
```
To ingest multiple local files, first upload them to S3 with fused.api.upload then specify an array of their S3 paths as the input to ingest.
### Row-based ingestion
Standard ingestion is row-based, where the user sets the maximum number of rows per chunk and file.
```python showLineNumbers
job_id = fused.ingest(
input="https://www2.census.gov/geo/tiger/TIGER_RD18/LAYER/TRACT/tl_rd22_11_tract.zip",
explode_geometries=True,
partitioning_method="rows",
partitioning_maximum_per_file=100,
partitioning_maximum_per_chunk=10,
).run_batch()
```
### Area-based ingestion
Fused also supports area-based ingestion, where the number of rows in each partition is determined by the sum of their area.
```python showLineNumbers
job_id = fused.ingest(
input="https://www2.census.gov/geo/tiger/TIGER_RD18/LAYER/TRACT/tl_rd22_11_tract.zip",
output="s3://fused-users/fused/max/census/dc_tract_area/", # <- replace with your own path,
explode_geometries=True,
partitioning_method="area",
partitioning_maximum_per_file=None,
partitioning_maximum_per_chunk=None,
).run_batch()
```
### Ingest GeoDataFrame
Ingest a GeoDataFrame directly.
```python showLineNumbers
job_id = fused.ingest(
input=gdf,
output="s3://sample-bucket/file.parquet",
).run_batch()
```
### Ingest Shapefile
We recommend you `.zip` your shapefile and ingest it as a single file:
```python showLineNumbers
job_id = fused.ingest(
input="s3://my_bucket/my_shapefile.zip",
output="s3://sample-bucket/file.parquet",
).run_batch()
```
### Write bbox columns for faster spatial filtering
Optionally, you can ask for writing a `bbox` covering column as part of the
resulting GeoParquet files:
```python showLineNumbers
job_id = fused.ingest(
input="https://www2.census.gov/geo/tiger/TIGER_RD18/LAYER/TRACT/tl_rd22_11_tract.zip",
output="s3://fused-users/fused/max/census/dc_tract/", # <- replace with your own path,,
write_covering_bbox=True,
).run_batch()
```
This makes the files bigger, but can result in faster loading with a spatial filter
when using tools such as GeoPandas or DuckDB:
```python showLineNumbers
@fused.udf
def udf(bounds: fused.types.Bounds = [-77.12, 38.79, -76.91, 38.99]):
gdf = geopandas.read_parquet("s3://fused-users/fused/max/census/dc_tract/", bbox=bounds)
return gdf
```
## Ingest to your own S3 bucket
`fused.ingest` supports writing output to any S3 bucket as long as you have appropriate permissions:
1. Open the `S3 Policy` tab in the profile page of Workbench and enter your S3 bucket name. This returns a JSON object.
2. Copy this IAM policy and paste it in your AWS S3 Policy tab.
3. Write the output to your S3 bucket using the `output` parameter:
```python showLineNumbers
# Assuming s3://my-bucket/ is your own managed S3 bucket
job_id = fused.ingest(
input="s3://my-bucket/file.parquet",
output="s3://my-bucket/ingested/",
).run_batch()
```
## Troubleshooting
If you encounter the following error message, please contact the Fused team to request an increase:
```text
Error: `Quota limit: Number of running instances`
```
================================================================================
## Reading geospatial
Path: guide/data-input-outputs/read-write/geospatial/reading.mdx
URL: https://docs.fused.io/guide/data-input-outputs/read-write/geospatial/geospatial-reading
# Reading geospatial
Common examples for reading geospatial data in Fused.
## Python Packages
### `geopandas`
```python
@fused.udf
def udf():
path = "s3://fused-sample/demo_data/subway_stations.geojson"
return gpd.read_file(path)
```
### `shapely`
```python
@fused.udf
def udf():
from shapely.geometry import Point, Polygon
# Create geometries with shapely
points = [Point(-122.4, 37.8), Point(-122.3, 37.7)]
polygon = Polygon([(-122.5, 37.7), (-122.3, 37.7), (-122.3, 37.9), (-122.5, 37.9)])
gdf = gpd.GeoDataFrame(
,
geometry=points + [polygon],
crs=4326
)
return gdf
```
### `rioxarray`
```python
@fused.udf
def udf():
path = "s3://fused-sample/demo_data/elevation.tif"
# Read raster data with rioxarray
raster = rxr.open_rasterio(path)
# Convert to DataFrame for display
df = raster.to_dataframe().reset_index()
return df.head(1000)
```
### `xarray`
```python
@fused.udf
def udf():
# Download NetCDF data to mount disk for proper reading
path = fused.download('s3://fused-sample/demo_data/2025_01_01_ERA5_surface.nc','2025_01_01_ERA5_surface.nc')
ds = xr.open_dataset(path)
# Convert to DataFrame
df = ds.to_dataframe().reset_index()
return df.head(1000)
```
## Vector Formats
### GeoJSON (.geojson, .json)
```python
@fused.udf
def udf():
path = "s3://fused-sample/demo_data/table/US_states.geojson"
return gpd.read_file(path)
```
### Shapefile (.shp + .shx, .dbf, .prj)
```python
@fused.udf
def udf():
path = "s3://fused-sample/demo_data/table/US_states_shapefile.shp"
return gpd.read_file(path)
```
### GeoPackage (.gpkg)
```python
@fused.udf
def udf():
path = "s3://fused-sample/demo_data/table/US_states_geopackage.gpkg"
return gpd.read_file(path)
```
### KML/KMZ (.kml, .kmz)
```python
@fused.udf
def udf():
path = "s3://fused-sample/demo_data/table/US_states.kml"
return gpd.read_file(path)
```
### GeoParquet (.parquet)
```python
@fused.udf
def udf():
path = "s3://fused-sample/demo_data/buildings.parquet"
return gpd.read_parquet(path)
```
### Large Geoparquet (.parquet with subset)
Why not just use `gpd.read_parquet()`?
- `gpd.read_parquet()` loads the ENTIRE file into memory before you can `.head()`
- For large files (100MB+) this causes Out of Memory errors in a realtime UDF run
**Solution:** Use DuckDB to push LIMIT down to the read level so only
n_rows are ever loaded into memory, then convert geometry from WKB to
proper Shapely objects via DuckDB's spatial extension (ST_AsText).
```python
@fused.udf
def udf(
n_rows: int = 1000,
):
path = "s3://us-west-2.opendata.source.coop/cholmes/overture/geoparquet-country-quad-2/CZ.parquet"
common = fused.load("https://github.com/fusedio/udfs/tree/9bad664/public/common/")
@fused.cache
def load_large_geoparquet(p, limit):
con = common.duckdb_connect()
# In this example, bucket is in us-west-2; set region so S3 requests don't use default us-east-1
con.sql("SET s3_region='us-west-2';")
# 1. Detect the geometry column (DuckDB reads it as BLOB/GEOMETRY)
col_info = con.execute(
"""
SELECT column_name FROM (
DESCRIBE SELECT * FROM read_parquet(?)
) WHERE column_type IN ('GEOMETRY', 'BLOB', 'WKB_GEOMETRY')
""",
[p],
).fetchall()
geom_col = col_info[0][0] if col_info else "geometry"
geom_sql = geom_col.replace('"', '""')
# 2. Read only `limit` rows and convert geometry BLOB -> WKT text
# LIMIT is pushed down so only `limit` rows are ever in memory
df = con.execute(
f'SELECT *, ST_AsText("") AS __wkt FROM read_parquet(?) LIMIT ?',
[p, limit],
).df()
# 3. Parse WKT into Shapely geometry objects and build GeoDataFrame
df[geom_col] = gpd.GeoSeries.from_wkt(df["__wkt"])
df = df.drop(columns=["__wkt"])
return gpd.GeoDataFrame(df, geometry=geom_col, crs=4326)
gdf = load_large_geoparquet(path, n_rows)
print(gdf.T)
return gdf
```
### CSV with coordinates (.csv)
```python
@fused.udf
def udf():
from shapely.geometry import Point
# Read CSV
df = pd.read_csv("s3://fused-sample/demo_data/table/subway_stations.csv")
# Convert to GeoDataFrame
gdf = gpd.GeoDataFrame(
df,
geometry=gpd.points_from_xy(df.longitude, df.latitude),
crs=4326
)
return gdf
```
### Excel with coordinates (.xlsx)
```python
@fused.udf
def udf():
from shapely.geometry import Point
path = "s3://fused-sample/demo_data/table/subway_stations.xlsx"
# Read Excel file
df = pd.read_excel(path)
# Convert to GeoDataFrame if coordinates exist
if 'longitude' in df.columns and 'latitude' in df.columns:
gdf = gpd.GeoDataFrame(
df,
geometry=gpd.points_from_xy(df.longitude, df.latitude),
crs=4326
)
return gdf
return df
```
## Raster Formats
### GeoTIFF (.tif, .tiff)
```python
@fused.udf
def udf():
path = "s3://fused-sample/demo_data/satellite_imagery/wildfires.tiff"
with rasterio.open(path) as src:
data = src.read()
bounds = src.bounds
return data, bounds
```
### NetCDF (.nc)
```python
@fused.udf
def udf():
# Download to mount disk for proper NetCDF reading
path = fused.download('s3://fused-sample/demo_data/climate_data.nc', 'climate_data.nc')
# Open NetCDF dataset
ds = xr.open_dataset(path)
return ds.to_dataframe().reset_index().head(1000)
```
For working with STAC catalogs (Earth on AWS, Microsoft Planetary Computer), see STAC.
================================================================================
## Writing geospatial
Path: guide/data-input-outputs/read-write/geospatial/writing.mdx
URL: https://docs.fused.io/guide/data-input-outputs/read-write/geospatial/geospatial-writing
# Writing geospatial
When working with geospatial data in Fused we recommend saving files in these formats:
- **Vector data**: GeoParquet
- **Raster data**: Cloud Optimized GeoTIFF (COG)
## Vector: GeoParquet
```python
@fused.udf
def udf():
path = "s3://fused-sample/demo_data/subway_stations.geojson"
gdf = gpd.read_file(path)
# Process data...
output_path = "s3://fused-users/fused/aman/subway_stations.parquet" # change to your own path
gdf.to_parquet(output_path)
return f"File saved to "
```
## Raster: Cloud Optimized GeoTIFF (COG)
```python
@fused.udf
def udf():
path = "s3://fused-sample/demo_data/satellite_imagery/wildfires.tiff"
# Read the raster data
with rasterio.open(path) as src:
data = src.read()
profile = src.profile
# Process the data
processed_data = np.where(data > np.percentile(data, 80), 255, 0).astype(np.uint8)
# Update profile for writing
profile.update()
# Write to Fused's shared disk (accessible to all UDFs in org)
username = fused.api.whoami()['handle']
output_path = f"/mnt/cache/wildfires_processed_.tif"
with rasterio.open(output_path, 'w', **profile) as dst:
dst.write(processed_data)
return f"File saved to shared disk at "
```
## Large Datasets: `fused.ingest()`
For large geospatial datasets, use `fused.ingest()` to create optimized, geo-partitioned files. This enables efficient spatial queries on datasets of any size.
```python
# Ingest Washington DC Census data
job = fused.ingest(
input="https://www2.census.gov/geo/tiger/TIGER_RD18/LAYER/TRACT/tl_rd22_11_tract.zip",
output="s3://fused-users/fused/aman/data/census/partitioned/", # change to your own path
)
job.run_batch()
```
You can tail logs to see how the job is progressing:
```python
fused.api.job_tail_logs("your-job-id")
```
Learn more about geospatial data ingestion.
================================================================================
## Reading files
Path: guide/data-input-outputs/read-write/reading.mdx
URL: https://docs.fused.io/guide/data-input-outputs/read-write/reading
# Reading files
Common examples for reading tabular data in Fused.
For geospatial formats (GeoJSON, Shapefile, GeoTIFF, etc.), see Reading Geospatial Data.
## CSV
```python
@fused.udf
def udf():
path = "s3://fused-sample/demo_data/housing_2024.csv"
return pd.read_csv(path)
```
## Parquet
```python
@fused.udf
def udf():
path = "s3://fused-sample/demo_data/housing_2024.parquet"
return pd.read_parquet(path)
```
## JSON
```python
@fused.udf
def udf():
path = "s3://fused-sample/demo_data/config.json"
return pd.read_json(path)
```
## Excel
```python
@fused.udf
def udf():
path = "s3://fused-sample/demo_data/report.xlsx"
return pd.read_excel(path)
```
## DuckDB (SQL Queries)
Query files directly with SQL using DuckDB:
```python
@fused.udf
def udf():
path = "s3://fused-sample/demo_data/housing_2024.parquet"
conn = duckdb.connect()
result = conn.execute(
"""
SELECT *
FROM read_parquet(?)
WHERE latitude IS NOT NULL
LIMIT 1000
""",
[path],
).df()
return result
```
Using Fused's common utilities for authenticated S3 access:
```python
@fused.udf
def udf():
common = fused.load("https://github.com/fusedio/udfs/tree/main/public/common/")
con = common.duckdb_connect()
df = con.sql("""
SELECT * FROM read_parquet('s3://bucket/data.parquet')
WHERE value > 100
LIMIT 1000
""").df()
return df
```
## Compressed Files (ZIP/RAR)
### ZIP Files
**List files in archive:**
```python
@fused.cache
def get_zip_file_info(url):
s3 = s3fs.S3FileSystem()
with s3.open(url, "rb") as f:
with zipfile.ZipFile(f) as zip_ref:
file_info = []
for filename in zip_ref.namelist():
info = zip_ref.getinfo(filename)
file_info.append()
return pd.DataFrame(file_info)
```
**Extract specific files:**
```python
@fused.cache
def extract_file_from_zip(url, filename, output_path):
s3 = s3fs.S3FileSystem()
with tempfile.NamedTemporaryFile(mode="wb", delete=False, suffix=os.path.splitext(filename)[1]) as output_file:
temp_path = output_file.name
CHUNK_SIZE = 100 * 1024 * 1024 # 100MB chunks
with s3.open(url, "rb") as f:
with zipfile.ZipFile(f) as zip_ref:
with zip_ref.open(filename) as file:
while chunk := file.read(CHUNK_SIZE):
output_file.write(chunk)
s3.put(temp_path, output_path)
return output_path
```
### RAR Files
**List files in archive:**
```python
@fused.cache
def get_rar_file_info(url):
s3 = s3fs.S3FileSystem()
with s3.open(url, "rb") as f:
with rarfile.RarFile(f) as rar_ref:
file_info = []
for filename in rar_ref.namelist():
info = rar_ref.getinfo(filename)
file_info.append()
return pd.DataFrame(file_info)
```
**Extract specific files:**
```python
@fused.cache
def extract_file_from_rar(url, filename, output_path):
s3 = s3fs.S3FileSystem()
with tempfile.NamedTemporaryFile(mode="wb", delete=False, suffix=os.path.splitext(filename)[1]) as output_file:
temp_path = output_file.name
CHUNK_SIZE = 100 * 1024 * 1024 # 100MB chunks
with s3.open(url, "rb") as f:
with rarfile.RarFile(f) as rar_ref:
with rar_ref.open(filename) as file:
while chunk := file.read(CHUNK_SIZE):
output_file.write(chunk)
s3.put(temp_path, output_path)
return output_path
```
Use `.map()` to extract multiple files in parallel.
## Recommended Formats
| Data Type | Recommended Format | Why |
|-----------|-------------------|-----|
| Tables | **Parquet** | Columnar, compressed, fast |
| Large tables | **Partitioned Parquet** | Efficient queries on subsets |
For large datasets (>1GB), consider partitioning your data or using geospatial ingestion for spatial data.
================================================================================
## Writing files
Path: guide/data-input-outputs/read-write/writing.mdx
URL: https://docs.fused.io/guide/data-input-outputs/read-write/writing
# Writing files
Common examples for writing tabular data in Fused.
For geospatial formats (GeoParquet, GeoTIFF, etc.), see Writing Geospatial Data.
## CSV
```python
@fused.udf
def udf():
df = pd.DataFrame()
df.to_csv("s3://fused-users/fused/aman/my-data/output.csv", index=False) # change to your own path
return "Saved!"
```
## Parquet
Parquet is the recommended format for tabular data - it's columnar, compressed, and fast.
```python
@fused.udf
def udf():
path = "s3://fused-sample/demo_data/housing_2024.csv"
df = pd.read_csv(path)
df['price_per_area'] = round(df['price'] / df['area'], 2)
output_path = "s3://fused-users/fused/aman/housing_processed.parquet" # change to your own path
df.to_parquet(output_path)
return f"File saved to "
```
## JSON
```python
@fused.udf
def udf():
df = pd.DataFrame()
df.to_json("s3://fused-users/fused/aman/my-data/output.json") # change to your own path
return "Saved!"
```
## Where to Save Files
| Storage | Path Format | Best For |
|---------|-------------|----------|
| Fused home directory | `s3://fused-users/fused/aman/path/file.parquet` | Persistent storage, sharing |
| Mounted disk | `/mnt/cache/file.parquet` | Temporary files, caching |
| Your own S3 | `s3://bucket/file.parquet` | Enterprise integration |
See Cloud Storage for details on connecting your own buckets.
================================================================================
## First UDF & basics
Path: guide/getting-started/first-udf-basics.mdx
URL: https://docs.fused.io/guide/getting-started/first-udf-basics
# First UDF & basics
## Fused
Fused makes it easy to run Python at scale. You write Python code, and Fused handles execution, scaling, and API generation automatically.
If it runs locally, it runs on Fused — at scale.
It decouples *what you write* from *how it runs* and *where it goes*.
## UDFs
UDFs (User Defined Functions) are Python functions with a `@fused.udf` decorator that return data. Each UDF becomes its own API endpoint with a unique URL.
Try it in Workbench:
```python
@fused.udf
def udf(name: str = "Fused"):
return pd.DataFrame(!']})
```
A UDF needs:
- The `@fused.udf` decorator
- A function (called `udf`)
- Parameters with **type hints** and **default values**
UDFs can return tables (`DataFrame`, `GeoDataFrame`), arrays (`numpy`, `xarray`), or simple Python objects. Learn more about writing UDFs.
## Data
Bring your own data into Fused:
- **Drag & drop** — Drop local files directly into Workbench
- **Cloud storage** — Read from S3, GCS, or Azure (public or connect your own bucket)
- **Databases** — Read from Snowflake, BigQuery, or other databases
- **APIs** — Fetch from any HTTP endpoint
```python
@fused.udf
def udf():
return pd.read_csv("s3://your-bucket/your-data.csv")
```
Need credentials for private data? See secrets management.
## Formats
Share your canvas to get a canvas token; then each UDF is available by name.
[Image: UDF API URL structure: domain, canvas token, UDF name, extension, query params]
Every UDF is a dynamic file system. Same UDF, multiple output formats. Change the URL extension to get JSON, CSV, Parquet, PNG, TIFF, or MVT; no code changes needed!
```
https://udf.ai/fc_/my_udf.json
https://udf.ai/fc_/my_udf.csv
https://udf.ai/fc_/my_udf.parquet
```
Pass parameters via URL to change outputs dynamically:
```
https://udf.ai/fc_/my_udf.json?name=World
```
Learn more about Calling UDFs as API.
## Caching
First request runs your code. Subsequent requests (same code, same parameters) return cached results in under a second. UDFs are cached for 14 days by default.
Try it yourself:
```python
@fused.udf
def udf():
time.sleep(5)
return
```
Run once → 5 seconds. Run again → ~1 second (cached).
Set any cache duration you need, including `0` to force a fresh run every time:
```python
@fused.udf(cache_max_age="0s")
def udf():
time.sleep(5)
return
```
Learn more about caching.
## Pipelines
UDFs can call other UDFs to build data pipelines. Each stays standalone with its own endpoint.
```python
# UDF 1: load_cities
@fused.udf
def udf(continent: str = "Europe"):
cities = pd.DataFrame()
return cities[cities.continent == continent]
```
```python
# UDF 2: big_cities
@fused.udf
def udf(continent: str = "Europe", min_pop: int = 3):
load_cities = fused.load('load_cities')
cities = load_cities(continent=continent)
return cities[cities.population >= min_pop]
```
Here, `fused.load("load_cities")` loads the saved UDF named `load_cities`. It returns a callable UDF object, so `load_cities(continent=continent)` calls the `load_citites` UDF and runs it.
You could also run `load_cities(continent=continent, engine='local')` locally inside the current UDF. This can help limit the number of UDF instances you run at the same time, especially for small functions.
`big_cities` calls `load_cities` and passes through the `continent` param. Both UDFs have their own API endpoint — call either one directly:
```
https://udf.ai/fc_/my_udf.json?continent=Asia&min_pop=5
```
Organise UDFs visually in Canvas — connect them, build workflows, create dashboards.
================================================================================
## Using AI
Path: guide/getting-started/using-ai.mdx
URL: https://docs.fused.io/guide/getting-started/using-ai
# Using AI
Fused supports multiple ways to leverage AI when building and working with UDFs.
## Claude Code & AI Coding Tools (Recommended)
The recommended approach for building with AI is to use AI coding tools like **Claude Code** directly through the CLI with Fused SKILLs. This gives you a powerful, full-featured development experience where AI can read, write, and iterate on your UDFs locally.
See the full guide: AI Coding Tools (Claude Code & others)
This approach is recommended for:
- Building and iterating on UDFs
- Complex multi-file or multi-step tasks
- Full project context and code generation
- Using Claude Code via the CLI with Fused SKILLs
## AI Chat in Workbench
Fused Workbench also includes a built-in AI Chat interface. This is still available and works well for smaller, quick tasks directly in the browser.
AI Chat is recommended for:
- Quick questions about a UDF
- Small edits or fixes
- Exploring Fused capabilities inline
For most development workflows, we recommend using AI coding tools like Claude Code through the CLI for the best experience.
================================================================================
## Workbench intro
Path: guide/getting-started/workbench-intro.mdx
URL: https://docs.fused.io/guide/getting-started/workbench-intro
# Workbench intro
Workbench is Fused's browser based IDE.
[Image: Workbench Preview]
It allows you to:
- Write Python UDFs directly in the browser with built-in dependencies — no local setup needed. For custom packages, see Dependencies.
- Build workflows and shareable dashboards in Canvas
- Browse cloud storage and preview files in File Explorer
## Canvas
Freeform canvas where each UDF is a draggable card. Connect UDFs with the (+) icon to build workflows, annotate with text elements, and create interactive dashboards shareable via link.
[Image: Canvas Preview]
_An example of a workflow in Canvas: Change the crop type to see the changes in the dataframe and map. Try it out →_
**Good for:**
- Chaining UDFs together into repeatable workflows
- Annotating work with text elements next to code
- Creating interactive dashboards shareable with a link
Learn more about Canvas →
## File Explorer
Browse public or private cloud storage buckets. Preview large files directly in the browser, then double-click to open in a UDF and start working.
[Image: File Explorer]
**Good for:**
- Browsing files across different buckets (S3, GCS)
- Previewing large files without writing code
- Quickly opening files in a UDF template
Learn more about File Explorer →
## Map View
A GIS-style layer view for advanced geospatial exploration. Toggle UDFs on/off like layers in QGIS/ArcGIS, with automatic tiling for large datasets based on the viewport.
[Image: UDF Builder]
**Good for:**
- Advanced exploration of large geospatial datasets
- Working across multiple layers (each UDF is a layer)
- Automatic viewport-based tiling for performance
Learn more about Map View →
## Next Steps
- Write your first UDF - Learn everything about UDFs
- Using AI to build - AI is built right at the core of Fused
- Geospatial processing - Learn how to leverage Fused for heavy geospatial workflows
================================================================================
## Aggregations
Path: guide/h3-analytics/aggregations.mdx
URL: https://docs.fused.io/guide/h3-analytics/aggregations
# Aggregate
After ingesting a dataset to H3 hexagons it's possible to visualize it in Fused but we can also directly work with the data.
This page shows how to aggregate data at different resolutions or create derivative layers.
[Image: Aggregating H3 Data]
Example aggregating elevation data across the US at different H3 resolutions:
```python showLineNumbers
@fused.udf
def udf(
bounds: fused.types.Bounds = [-74.556, 40.400, -73.374, 41.029], # Default to full NYC
):
path = "s3://fused-asset/hex/copernicus-dem-90m/"
hex_reader = fused.load("https://github.com/fusedio/udfs/tree/9780aef/community/joris/Read_H3_dataset/")
df = hex_reader.read_h3_dataset(path, bounds, res=None) # res=None lets the hex_reader determine the resolution based on the current bounds
return df
```
You can already use the h3_reader.read_h3_dataset and specify:
- `res` at a specific resolution
- `value` to filter on a specific value (especially for categorical data)
This reader uses DuckDB under the hood to read the data meaning you can write additional queries _after_ reading the data as shown in creating derivative layers.
## Aggregate at lower resolutions
H3 hexagons allow for aggregation at different resolutions. The ingestion process already creates overviews at different H3 resolutions - see Resolution Guide for details.
### Numerical data
Example numerical values:
- Temperature
- Elevation
- Income
- Population
Aggregating means:
- Summing values (i.e. how many people live in a H3 cell in total)
- Taking mean / max / min / stddev (i.e. what is the average temperature in a H3 cell)
Example: Aggregating elevation across the US at different H3 levels
```python showLineNumbers
@fused.udf
def udf(
bounds: fused.types.Bounds = [-74.556, 40.400, -73.374, 41.029], # Default to full NYC
res: int = 4, # Default to H3 resolution 4
):
path = "s3://fused-asset/hex/copernicus-dem-90m/"
hex_reader = fused.load("https://github.com/fusedio/udfs/tree/9780aef/community/joris/Read_H3_dataset/")
df = hex_reader.read_h3_dataset(
path,
bounds,
res=res
)
return df
```
### Categorical data
Example categorical data:
- Land Use
- Crop Type
- Zone
Aggregating means:
- Counting values (i.e. how many different crop types are there in a H3 cell)
- Taking mode (i.e. what is the most common crop type in a H3 cell)
Example: Aggregating Corn yields across the US at different H3 levels
```python showLineNumbers
@fused.udf
def udf(
bounds: fused.types.Bounds = [-127.54220803198237,10.667151173068717,-66.93703570835524,55.22298640160706],
res: int = None, # if left to None, hex_reader will determine resolution itself
data_value: int = 1, # 1=Corn in CDL for this example
year: int = 2024,
):
path = f"s3://fused-asset/hex/cdls_v8/year=/"
common = fused.load("https://github.com/fusedio/udfs/tree/b6786d6/public/common/")
hex_reader = fused.load("https://github.com/fusedio/udfs/tree/9780aef/community/joris/Read_H3_dataset/")
# Read all hexagons where the CDL value matches the requested data class (e.g. Corn)
df = hex_reader.read_h3_dataset(path, bounds, res=res, value=data_value)
print(df.T)
if 'pct' not in df.columns:
# Dynamically compute the % of each hex covered by the specified crop type
data_res = h3.get_resolution(df["hex"].iloc[0])
print(f"")
con = common.duckdb_connect()
df = con.execute(
"""
SELECT
hex,
SUM(area) AS total_area,
ANY_VALUE(data) AS data,
h3_get_hexagon_area_avg(?, 'm^2') AS hex_area,
(SUM(area) / h3_get_hexagon_area_avg(?, 'm^2')) * 100 AS pct
FROM df
WHERE data = ?
GROUP BY hex
""",
[data_res, data_res, data_value],
).df()
print(df.shape)
if df.shape[0] > 0:
return df
else:
return None
```
```python showLineNumbers
@fused.udf
def udf(
bounds: fused.types.Bounds = [-74.556, 40.400, -73.374, 41.029], # Default to full NYC
):
path = "s3://fused-asset/hex/copernicus-dem-90m/"
hex_reader = fused.load("https://github.com/fusedio/udfs/tree/9780aef/community/joris/Read_H3_dataset/")
df = hex_reader.read_h3_dataset(path, bounds, res=None)
# Slope calculation using h3_grid_ring
common = fused.load("https://github.com/fusedio/udfs/tree/b6786d6/public/common/")
con = common.duckdb_connect()
qr = """
WITH hex_neighbors AS (
SELECT
h1.hex AS hex,
h1.data_avg AS elevation,
UNNEST(h3_grid_ring(h1.hex, 1)) AS neighbor_hex
FROM df h1 -- Notice that DuckDB allows you to directly call the dataframe by its name
),
neighbor_data AS (
SELECT
n.hex,
n.elevation,
n.neighbor_hex,
df2.data_avg AS neighbor_elevation,
h3_get_hexagon_edge_length_avg(h3_get_resolution(n.hex), 'm') AS edge_length_m
FROM hex_neighbors n
JOIN df df2 ON n.neighbor_hex = df2.hex
),
calculations AS (
SELECT
hex,
elevation,
DEGREES(ATAN(ABS(elevation - neighbor_elevation) / edge_length_m)) AS slope_deg
FROM neighbor_data
),
slope_aggregated AS (
SELECT
hex,
elevation,
AVG(slope_deg) * 100 AS avg_slope_deg,
MAX(slope_deg) * 100 AS max_slope_deg
FROM calculations
GROUP BY hex, elevation
)
SELECT
s.hex,
ROUND(s.elevation, 2) AS elevation,
ROUND(s.avg_slope_deg, 2) AS avg_slope_deg,
ROUND(s.max_slope_deg, 2) AS max_slope_deg
FROM slope_aggregated s;
"""
processed_df = con.execute(qr).df()
print(processed_df.describe())
return processed_df
```
================================================================================
## Converting to H3
Path: guide/h3-analytics/converting.mdx
URL: https://docs.fused.io/guide/h3-analytics/converting
# Converting Data to H3
This page covers different methods to convert your data into H3 hexagons.
Try the examples on this page in Canvas →
---
## File to H3
Turning a single small dataset into a grid of H3 hexagons.
### Point Count to Hex
The following example uses a simple CSV of 311 calls in the New York City area, showing a heatmap of calls per hex 9 cell:
```python showLineNumbers
@fused.udf
def udf(
res: int = 9
):
noise_311_link = "https://gist.githubusercontent.com/kashuk/670a350ea1f9fc543c3f6916ab392f62/raw/4c5ced45cc94d5b00e3699dd211ad7125ee6c4d3/NYC311_noise.csv"
# Load common utilities (includes duckdb helper)
common = fused.load("https://github.com/fusedio/udfs/tree/b6786d6/public/common/")
con = common.duckdb_connect()
df = con.execute(
"""
SELECT
h3_latlng_to_cell(lat, lng, ?) AS hex,
COUNT(*) AS cnt
FROM read_csv_auto(?)
WHERE lat IS NOT NULL AND lng IS NOT NULL
GROUP BY 1
""",
[res, noise_311_link],
).df()
# Visualize as a heatmap of call counts per hex
map_utils = fused.load("https://github.com/fusedio/udfs/tree/3ada22d/community/milind/map_utils")
layers = [
,
"filled": True,
"extruded": False,
"stroked": False,
"opacity": 0.7,
}
},
},
]
return map_utils.deckgl_layers(layers=layers, basemap="dark")
```
Link to UDF in Fused Catalog
```python showLineNumbers
@fused.udf
def udf(
bounds: fused.types.Bounds = [-125.0, 24.0, -66.9, 49.0],
min_hex_cell_res: int= 11, # Increase this if working with high res local data
max_hex_cell_res: int= 4,
):
common = fused.load("https://github.com/fusedio/udfs/tree/b6786d6/public/common/")
path = "s3://fused-asset/demos/catchment_analysis/simplified_acs_bg_ca_2022.parquet"
# Dynamic H3 resolution
def dynamic_h3_res(b):
z = common.estimate_zoom(b)
return max(min(int(2 + z / 1.5),min_hex_cell_res), max_hex_cell_res)
parent_res = max(dynamic_h3_res(bounds) - 1, 0)
# Load and clip data
gdf = gpd.read_parquet(path)
tile = common.get_tiles(bounds, clip=True)
gdf = gdf.to_crs(4326).clip(tile)
# Early exit if empty
if len(gdf) == 0:
return pd.DataFrame(columns=["hex", "POP", "pct"])
# Hexify
con = common.duckdb_connect()
df_hex = common.gdf_to_hex(gdf, res=parent_res, add_latlng_cols=None)
con.register("df_hex", df_hex)
# Aggregate to parent hexagons and calculate percentages
# In this case we're aggregating by sum
query = """
WITH agg AS (
SELECT
h3_cell_to_parent(hex, ?) AS hex,
SUM(POP) AS POP
FROM df_hex
GROUP BY hex
)
SELECT
hex,
POP,
POP * 100.0 / SUM(POP) OVER () AS pct
FROM agg
ORDER BY POP DESC
"""
return con.execute(query, [parent_res]).df()
```
Link to UDF in Fused Catalog
```python showLineNumbers
@fused.udf
def udf(bounds: fused.types.Bounds = [-73.983, 40.763, -73.969, 40.773]):
common = fused.load("https://github.com/fusedio/udfs/tree/b6786d6/public/common/")
tile = common.get_tiles(bounds, clip=True)
x, y, z = tile.iloc[0][["x", "y", "z"]]
url = f"https://s3.amazonaws.com/elevation-tiles-prod/geotiff///.tif"
res_offset = 0
h3_size = max(min(int(3 + z / 1.5), 12) - res_offset, 2)
con = common.duckdb_connect()
da_tiff = rioxarray.open_rasterio(url).squeeze(drop=True).rio.reproject("EPSG:4326")
df_tiff = da_tiff.to_dataframe("data").reset_index()[["y", "x", "data"]]
df = con.execute(
"""
SELECT
h3_latlng_to_cell(y, x, ?) AS hex,
AVG(data) AS elevation
FROM df_tiff
GROUP BY 1
""",
[h3_size],
).df()
df = df[df["elevation"] > 0]
map_utils = fused.load("https://github.com/fusedio/udfs/tree/3ada22d/community/milind/map_utils")
layers = [
,
"filled": True,
"extruded": False,
"stroked": False,
"opacity": 0.7,
}
},
},
]
return map_utils.deckgl_layers(layers=layers, basemap="dark")
```
```python showLineNumbers
@fused.udf
def udf(
bounds: fused.types.Bounds = [-73.983, 40.763, -73.969, 40.773],
res: int = None,
):
# Cropland Data Layer ingested with "cnt" metric
path = "s3://fused-asset/hex/cdls_v8/year=2024/"
utils = fused.load("https://github.com/fusedio/udfs/tree/9780aef/community/joris/Read_H3_dataset")
df = utils.read_h3_dataset(path, bounds, res=res)
return df
```
```
hex data cnt cnt_total
0 626740321835323391 122 12 14
1 626740321835323391 123 1 14
2 626740321835323391 121 1 14
```
Each H3 cell can have multiple rows (one per category).
```python showLineNumbers
@fused.udf
def udf(
bounds: fused.types.Bounds = [-73.983, 40.763, -73.969, 40.773],
res: int = None,
):
path = "s3://fused-asset/hex/nyc_dem/"
utils = fused.load("https://github.com/fusedio/udfs/tree/9780aef/community/joris/Read_H3_dataset")
df = utils.read_h3_dataset(path, bounds, res=res)
return df
```
```
hex data_avg
0 617733122581069823 78.822576
1 617733122610954239 78.225562
```
Use `map_utils.deckgl_layers` to render the hexagons on a standalone map:
```python showLineNumbers
@fused.udf
def udf(
bounds: fused.types.Bounds = [-74.556, 40.400, -73.374, 41.029],
res: int = 9,
):
path = "s3://fused-asset/hex/nyc_dem/"
utils = fused.load("https://github.com/fusedio/udfs/tree/9780aef/community/joris/Read_H3_dataset/")
df = utils.read_h3_dataset(path, bounds, res=res)
map_utils = fused.load("https://github.com/fusedio/udfs/tree/3ada22d/community/milind/map_utils")
layers = [
,
"filled": True,
"extruded": False,
"stroked": False,
"opacity": 0.7,
}
},
},
]
return map_utils.deckgl_layers(layers=layers, basemap="dark")
```
For more on standalone maps, see Standalone Maps. For Workbench styling, see H3 Visualization.
---
### Vector to H3
For vector data, use `.map()` to parallelize hexagonification:
 This method is for datasets < 100k vectors. Run in Single (viewport) mode, not Tiled.
```python showLineNumbers
@fused.udf
def udf(
bounds: fused.types.Bounds = [8.4452104984018,41.76046948393174,8.903258920921276,42.053137175457145]
):
common = fused.load("https://github.com/fusedio/udfs/tree/b6786d6/public/common/")
res = common.bounds_to_res(bounds, offset=0)
res = max(9, res)
gdf = get_data()
if gdf.shape[0] > 100_000:
print("Dataset too large. Contact info@fused.io for scaling.")
return
vector_chunks = common.split_gdf(gdf[["geometry"]], n=32, return_type="file")
pool = hexagonify_udf.map(vector_chunks, res=res, engine="remote")
df = pool.df().reset_index(drop=True)
df = df.groupby('hex').sum(['cnt','area']).sort_values('hex').reset_index()[['hex', 'cnt', 'area']]
df['area'] = df['area'].astype(int)
return df
@fused.udf
def hexagonify_udf(geometry, res: int = 12):
common = fused.load("https://github.com/fusedio/udfs/tree/b6786d6/public/common/")
gdf = common.to_gdf(geometry)
gdf = common.gdf_to_hex(gdf[['geometry']], res=15)
con = common.duckdb_connect()
df = con.execute(
"""
SELECT h3_cell_to_parent(hex, ?) AS hex,
COUNT(1) AS cnt,
SUM(h3_cell_area(hex, 'm^2')) AS area
FROM gdf
GROUP BY 1
ORDER BY 1
""",
[res],
).df()
return df
@fused.cache
def get_data():
gdf = fused.get_chunk_from_table(
"s3://us-west-2.opendata.source.coop/fused/overture/2025-12-17-0/theme=buildings/type=building/part=3", 10, 0
)
return gdf
```
Open in Catalog →
Reach out to our team at info@fused.io
================================================================================
## Joining
Path: guide/h3-analytics/joining.mdx
URL: https://docs.fused.io/guide/h3-analytics/joining
# Join
This page shows how to join two H3 hexagon datasets. This allows merging different datasets together to simplify analysis as each cell contains all the data.
This is particularly helpful when working with:
- Datasets in different spatial projections
- Sparse datasets like location data
- Datasets of different resolutions or types
[Image: Joining H3 Datasets]
### Assumptions
We assume both datasets:
- Use `hex` as the H3 hexagon column name (as would be the case for any ingested H3 dataset through Fused)
- Are accessible at the same hex resolutions
### Joining logic
We use DuckDB to join the datasets together.
Using the example from the previous "Aggregate" section, we can join the elevation & crop data layer together.
Elevation dataset (UDF catalog link):
| hex | data_avg |
|---------------------|--------------|
| 599718693687615487 | 14.60947 |
| 599718693687877631 | 31.12178 |
| ... | ... |
| 599718693688401919 | 23.30812 |
| 599718693688664063 | 45.28209 |
Crop Data Layer dataset (filtering to only show corn, i.e. `data_value=1` UDF Catalog Link):
| hex | data | area |
|-------------------|------|-----------|
| 600179630763671551| 1 | 507124 |
| 600179630763671551| 1 | 3537 |
| ... | ... | ... |
| 600181356234760191| 1 | 172089 |
| 600191310987132927| 1 | 801 |
We can join both tables together on the `hex` column:
```python showLineNumbers
@fused.udf
def udf(
bounds: fused.types.Bounds=[-74.556, 40.4, -73.374, 41.029],
res: int = 5,
):
# These are the two datasets coming from the previous "Aggregate" section
copdem_udf = fused.load('copdem_elevation')
cdl_udf = fused.load("reading_cdl_2024_hex_simplified")
elevation = copdem_udf(bounds=bounds, res=res)
cdl = cdl_udf(bounds=bounds, res=res, data_value=1)
common = fused.load("https://github.com/fusedio/udfs/tree/b6786d6/public/common/")
con = common.duckdb_connect()
qr = """
SELECT
e.hex,
e.data_avg as elevation_data,
c.data as cdl_data,
c.total_area as cdl_total_area
FROM elevation as e
LEFT JOIN cdl as c
ON e.hex = c.hex
"""
return con.execute(qr).df()
```
Returns the following table:
| hex | elevation_data | cdl_data | cdl_total_area |
|---------------------|---------------|----------|---------------|
| 599650080954204159 | 289.9432 | 1.0 | 74533290 |
| 599650080954466303 | 257.9233 | 1.0 | 90340230 |
| ... | ... | ... | ... |
| 599671053654220799 | 203.5272 | 1.0 | 97844060 |
| 599671261723484159 | 306.1185 | 1.0 | 121949200 |
### Example
- Environmental Variable Exploration canvas merging all these variables into a single dataset:
- Crop Data Layer
- Land Irrigation
- Soil Type
- Temperature
- Precipitation
================================================================================
## H3 Analytics Overview
Path: guide/h3-analytics/overview.mdx
URL: https://docs.fused.io/guide/h3-analytics/h3-overview
# H3 Analytics Overview
Try the basics of H3 in Fused on Canvas →
## When to use H3
Consider using H3 tiling when:
- Creating heatmaps of events (populations, counts, etc.)
- Wanting to compare datasets across resolutions & scale
- Working with sparse datasets
Example of buildings heatmap based on the Overture Buildings dataset:
```python showLineNumbers
common = fused.load("https://github.com/fusedio/udfs/blob/main/public/common/")
@fused.udf
def udf(bounds: fused.types.Bounds = [-122.71963771127753,36.53196328805067,-120.70395948802646,38.082911654639275]):
res = bounds_to_res(bounds)
print(res)
releases = ['2024-02-15-alpha-0', '2024-03-12-alpha-0', '2024-08-20-0', '2024-09-18-0', '2024-10-23-0', '2024-11-13-0', '2024-12-18-0', '2025-01-22-0', '2025-03-19-1', '2025-04-23-0', '2025-05-21-0']
release1 = releases[-1]
df1 = common.read_hexfile(bounds, f"s3://fused-users/fused/sina/overture_overview//hex.parquet", clip=True)
return df1
@fused.cache
def bounds_to_res(bounds, res_offset=0, max_res=14, min_res=3):
z = common.estimate_zoom(bounds)
return max(min(int(3 + max(0, z - 3) / 1.7 + res_offset), max_res), min_res)
```
## Converting Datasets to H3 tiles
We've provided a few options for converting datasets to H3 tiles:
| Type | Data Size | Hexagonification Type | H3 Output | Consideration |
|------|-----------|----------------------|-----------|---------------|
| File to H3 | Small (< 100MB) | On the fly | Static Resolution | Easy to adjust. Can easily change field to hexagonify |
| Dynamic Tile to H3 | Small or Large | On the fly | Dynamic Resolution | Easy to adjust. Can easily change field to hexagonify |
| Ingesting Dataset to H3 | Large (> 100MB) | Pre-computed | Dynamic Resolution | Requires deciding on which variable to hexagonify ahead of time |
For choosing the right resolution, see Resolution Guide.
## Example UDFs
- Ookla Download Speed Heatmap: Visualize download speeds across the world.
- US Crop Viewer: Explore crops around the US
- Overture Release Difference Heatmap: Visually identify differences between 2 Overture Building dataset releases.
================================================================================
## Resolution Guide
Path: guide/h3-analytics/resolution-guide.mdx
URL: https://docs.fused.io/guide/h3-analytics/resolution-guide
# H3 Resolution Guide
Cheat sheet for choosing the right H3 resolution.
## Resolution Table
| H3 Resolution (`res`) | Average Hex Area (m²) | Average Hex Edge Length (m) | Pixel Size Equivalent (m, √ avg hex area) | Common Raster Dataset Example |
|-----------------------|-----------------------|-----------------------------|-----------------------------------|----------------------------------------|
| 0 | 4,357,449,416,078 | 1,281,256 | 2,087,465 | |
| 1 | 609,788,441,794 | 483,057 | 780,889 | |
| 2 | 86,801,780,399 | 182,513 | 294,621 | |
| 3 | 12,393,434,655 | 68,979 | 111,325 | |
| 4 | 1,770,347,654 | 26,072 | 42,075 | ERA 5 (0.25deg ~ 27km at Equator)|
| 5 | 252,903,858 | 9,854 | 15,903 | |
| 6 | 36,129,062 | 3,725 | 6,011 | |
| 7 | 5,161,293 | 1,406 | 2,272 | |
| 8 | 737,328 | 531 | 859 | |
| 9 | 105,333 | 201 | 325 | Modis Vegetation Index (250m)|
| 10 | 15,048 | 76 | 123 | |
| 11 | 2,150 | 29 | 46 | Landsat Collection 2 (30m) |
| 12 | 307.1 | 10.8 | 17.5 | Sentinel-2 (10m) |
| 13 | 43.9 | 4.1 | 6.6 | |
| 14 | 6.3 | 1.5 | 2.5 | USGS LiDAR DEM (1m) |
| 15 | 0.9 | 0.6 | 0.9 | |
**Notes:**
- Values are approximate (area and edge length slightly vary by latitude/longitude).
- "Pixel Size Equivalent" is the square root of the average hex area, to aid raster/pixel comparison.
For more details see the H3 Cell Counts Stats page.
## Quick Reference
| Resolution | Avg Edge Length | Use Case |
|------------|-----------------|----------|
| 0 | 1107.71 km | Continental |
| 3 | 59.81 km | Regional |
| 5 | 8.54 km | City |
| 7 | 1.22 km | Neighborhood |
| 9 | 174.38 m | Block |
| 11 | 24.91 m | Building |
| 15 | 0.51 m | Sub-meter |
## Choosing Resolution
By default, when ingesting raster data to H3, the resolution is inferred from the raster data. Using the resolution of the raster input, it chooses an H3 resolution with a cell size that is as close as possible to but larger than the pixel size (at the center of the raster).
For example:
- Resolution 11 for a raster with pixel size of 30x30m
- Resolution 10 for a raster with pixel size of 90x90m
================================================================================
## Visualization
Path: guide/h3-analytics/visualization.mdx
URL: https://docs.fused.io/guide/h3-analytics/visualization
# H3 Visualization
## In Workbench Map Viewer
Quick styling options for H3 data in Workbench:
- Vector `H3HexagonLayer`
- Vector `H3HexagonLayer` with Tiles
---
## Interactive Visualizations in Canvas
In Fused Canvas you can create interactive visualizations by combining UDFs together.
We can create a more advanced version of these visualizations using by creating UDFs that leverage postMessages to talk to each other.
### Connecting Histogram & Map
**Launch the interactive Crop Exploration Dashboard →**
We provide these UDFs for now as-is. You can duplicate them and modify them to work with your own data:
The Range Histogram UDF allows you to visualize the distribution of a continuous variable (like elevation or temperature) as an interactive histogram. You can select a range to filter the data on the map.
```python
# doctest: skip
@fused.udf
def udf(
# Replace with your own data URL
data_url: str = "https://staging.udf.ai/UDF_join_era5_cdl_elevation/run?dtype_out_raster=png&dtype_out_vector=parquet",
theme: str = "workbench",
auto_fetch: bool = True,
dataset: str = "all", # IMPORTANT: match the map’s DATASET or use "all"
num_bins: int = 50,
value_field: str = "elevation",
title: str = "Elevation",
channel: str = "fused-elevation-temp" # IMPORTANT: match the map’s CHANNEL
):
common = fused.load("https://github.com/fusedio/udfs/tree/b6786d6/public/common/")
_ = fused.load("join_era5_cdl_elevation")
themes =
}
selected = themes.get(theme, themes['workbench'])
safe_title = (
title.replace("&", "&")
.replace("<", "<")
.replace(">", ">")
.replace('"', """)
.replace("'", "'")
)
html_content = """
"""
return common.html_to_obj(html_content)
```
The Categorical Bar Chart UDF is used to visualize counts of each category (such as crop types). Clicking a bar will filter the map to display only the selected category.
```python
@fused.udf
def udf(
# Replace with your own data URL
data_url: str = "https://staging.udf.ai/UDF_join_era5_cdl_elevation/run?dtype_out_raster=png&dtype_out_vector=parquet",
theme: str = "workbench",
auto_fetch: bool = True,
dataset: str = "all",
value_field: str = "crop_rank_1",
title: str = "Top 10 Crop Types",
channel: str = "fused-elevation-temp"
):
common = fused.load("https://github.com/fusedio/udfs/tree/b6786d6/public/common/")
_ = fused.load("join_era5_cdl_elevation")
# Load crop name mapping
cdl_crop_types_udf = fused.load("cdl_crop_types_indexing")
crop_df = cdl_crop_types_udf()
crop_mapping = dict(zip(crop_df['ID'], crop_df['Name']))
# Convert to JavaScript object string
crop_mapping_js = ": '',\n"
crop_mapping_js += " }"
themes =
}
selected = themes.get(theme, themes['workbench'])
safe_title = (
title.replace("&", "&")
.replace("<", "<")
.replace(">", ">")
.replace('"', """)
.replace("'", "'")
)
html_content = """
"""
return common.html_to_obj(html_content)
```
The Map UDF renders the geospatial hexagons and supports interactions with the histogram or bar chart to update map highlights in real time.
```python
# doctest: skip
common = fused.load("https://github.com/fusedio/udfs/tree/b6786d6/public/common/")
DEFAULT_CONFIG = r""",
"hexLayer":
}
}"""
DEFAULT_STYLE_URL = "https://basemaps.cartocdn.com/gl/dark-matter-gl-style/style.json"
@fused.udf
def udf(
# replace with your own data URL
data_url: str = "https://staging.udf.ai/UDF_join_era5_cdl_elevation/run?dtype_out_raster=png&dtype_out_vector=parquet",
config_json: str = DEFAULT_CONFIG,
mapbox_token: str = "pk.eyJ1IjoiaXNhYWNmdXNlZGxhYnMiLCJhIjoiY2xicGdwdHljMHQ1bzN4cWhtNThvbzdqcSJ9.73fb6zHMeO_c8eAXpZVNrA",
center_lng: float = -119.4179,
center_lat: float = 36.7783,
zoom: float = 4,
tooltip_columns: list = ["crop_rank_1", "elevation", "daily_mean"],
default_query: str = "SELECT * FROM data",
map_style_url: str = DEFAULT_STYLE_URL,
channel: str = "fused-elevation-temp",
dataset: str = "all",
):
from jinja2 import Template
style_url = map_style_url or DEFAULT_STYLE_URL
_ = fused.load("join_era5_cdl_elevation")
html = Template(r"""
""").render(
data_url=data_url,
config_json=config_json,
mapbox_token=mapbox_token,
map_style_url=style_url,
default_style_url=DEFAULT_STYLE_URL,
center_lng=center_lng,
center_lat=center_lat,
zoom=zoom,
tooltip_columns=tooltip_columns,
default_query=default_query,
channel=channel,
dataset=dataset,
)
return common.html_to_obj(html)
```
Feel free to directly reach out to us at `info@fused.io` if you have any questions on implementing this yourself
================================================================================
## What is Fused?
Path: guide/overview.mdx
URL: https://docs.fused.io/guide/guide-overview
# What is Fused?
Fused is the glue between your data and the tools that consume it: write Python functions that run serverlessly — on our cloud, with no servers for you to set up or manage — and expose them as secure HTTP endpoints. No containers, no infrastructure config, no waiting.
This method is for datasets < 100k vectors. Run in Single (viewport) mode, not Tiled.
```python showLineNumbers
@fused.udf
def udf(
bounds: fused.types.Bounds = [8.4452104984018,41.76046948393174,8.903258920921276,42.053137175457145]
):
common = fused.load("https://github.com/fusedio/udfs/tree/b6786d6/public/common/")
res = common.bounds_to_res(bounds, offset=0)
res = max(9, res)
gdf = get_data()
if gdf.shape[0] > 100_000:
print("Dataset too large. Contact info@fused.io for scaling.")
return
vector_chunks = common.split_gdf(gdf[["geometry"]], n=32, return_type="file")
pool = hexagonify_udf.map(vector_chunks, res=res, engine="remote")
df = pool.df().reset_index(drop=True)
df = df.groupby('hex').sum(['cnt','area']).sort_values('hex').reset_index()[['hex', 'cnt', 'area']]
df['area'] = df['area'].astype(int)
return df
@fused.udf
def hexagonify_udf(geometry, res: int = 12):
common = fused.load("https://github.com/fusedio/udfs/tree/b6786d6/public/common/")
gdf = common.to_gdf(geometry)
gdf = common.gdf_to_hex(gdf[['geometry']], res=15)
con = common.duckdb_connect()
df = con.execute(
"""
SELECT h3_cell_to_parent(hex, ?) AS hex,
COUNT(1) AS cnt,
SUM(h3_cell_area(hex, 'm^2')) AS area
FROM gdf
GROUP BY 1
ORDER BY 1
""",
[res],
).df()
return df
@fused.cache
def get_data():
gdf = fused.get_chunk_from_table(
"s3://us-west-2.opendata.source.coop/fused/overture/2025-12-17-0/theme=buildings/type=building/part=3", 10, 0
)
return gdf
```
Open in Catalog →
Reach out to our team at info@fused.io
================================================================================
## Joining
Path: guide/h3-analytics/joining.mdx
URL: https://docs.fused.io/guide/h3-analytics/joining
# Join
This page shows how to join two H3 hexagon datasets. This allows merging different datasets together to simplify analysis as each cell contains all the data.
This is particularly helpful when working with:
- Datasets in different spatial projections
- Sparse datasets like location data
- Datasets of different resolutions or types
[Image: Joining H3 Datasets]
### Assumptions
We assume both datasets:
- Use `hex` as the H3 hexagon column name (as would be the case for any ingested H3 dataset through Fused)
- Are accessible at the same hex resolutions
### Joining logic
We use DuckDB to join the datasets together.
Using the example from the previous "Aggregate" section, we can join the elevation & crop data layer together.
Elevation dataset (UDF catalog link):
| hex | data_avg |
|---------------------|--------------|
| 599718693687615487 | 14.60947 |
| 599718693687877631 | 31.12178 |
| ... | ... |
| 599718693688401919 | 23.30812 |
| 599718693688664063 | 45.28209 |
Crop Data Layer dataset (filtering to only show corn, i.e. `data_value=1` UDF Catalog Link):
| hex | data | area |
|-------------------|------|-----------|
| 600179630763671551| 1 | 507124 |
| 600179630763671551| 1 | 3537 |
| ... | ... | ... |
| 600181356234760191| 1 | 172089 |
| 600191310987132927| 1 | 801 |
We can join both tables together on the `hex` column:
```python showLineNumbers
@fused.udf
def udf(
bounds: fused.types.Bounds=[-74.556, 40.4, -73.374, 41.029],
res: int = 5,
):
# These are the two datasets coming from the previous "Aggregate" section
copdem_udf = fused.load('copdem_elevation')
cdl_udf = fused.load("reading_cdl_2024_hex_simplified")
elevation = copdem_udf(bounds=bounds, res=res)
cdl = cdl_udf(bounds=bounds, res=res, data_value=1)
common = fused.load("https://github.com/fusedio/udfs/tree/b6786d6/public/common/")
con = common.duckdb_connect()
qr = """
SELECT
e.hex,
e.data_avg as elevation_data,
c.data as cdl_data,
c.total_area as cdl_total_area
FROM elevation as e
LEFT JOIN cdl as c
ON e.hex = c.hex
"""
return con.execute(qr).df()
```
Returns the following table:
| hex | elevation_data | cdl_data | cdl_total_area |
|---------------------|---------------|----------|---------------|
| 599650080954204159 | 289.9432 | 1.0 | 74533290 |
| 599650080954466303 | 257.9233 | 1.0 | 90340230 |
| ... | ... | ... | ... |
| 599671053654220799 | 203.5272 | 1.0 | 97844060 |
| 599671261723484159 | 306.1185 | 1.0 | 121949200 |
### Example
- Environmental Variable Exploration canvas merging all these variables into a single dataset:
- Crop Data Layer
- Land Irrigation
- Soil Type
- Temperature
- Precipitation
================================================================================
## H3 Analytics Overview
Path: guide/h3-analytics/overview.mdx
URL: https://docs.fused.io/guide/h3-analytics/h3-overview
# H3 Analytics Overview
Try the basics of H3 in Fused on Canvas →
## When to use H3
Consider using H3 tiling when:
- Creating heatmaps of events (populations, counts, etc.)
- Wanting to compare datasets across resolutions & scale
- Working with sparse datasets
Example of buildings heatmap based on the Overture Buildings dataset:
```python showLineNumbers
common = fused.load("https://github.com/fusedio/udfs/blob/main/public/common/")
@fused.udf
def udf(bounds: fused.types.Bounds = [-122.71963771127753,36.53196328805067,-120.70395948802646,38.082911654639275]):
res = bounds_to_res(bounds)
print(res)
releases = ['2024-02-15-alpha-0', '2024-03-12-alpha-0', '2024-08-20-0', '2024-09-18-0', '2024-10-23-0', '2024-11-13-0', '2024-12-18-0', '2025-01-22-0', '2025-03-19-1', '2025-04-23-0', '2025-05-21-0']
release1 = releases[-1]
df1 = common.read_hexfile(bounds, f"s3://fused-users/fused/sina/overture_overview//hex.parquet", clip=True)
return df1
@fused.cache
def bounds_to_res(bounds, res_offset=0, max_res=14, min_res=3):
z = common.estimate_zoom(bounds)
return max(min(int(3 + max(0, z - 3) / 1.7 + res_offset), max_res), min_res)
```
## Converting Datasets to H3 tiles
We've provided a few options for converting datasets to H3 tiles:
| Type | Data Size | Hexagonification Type | H3 Output | Consideration |
|------|-----------|----------------------|-----------|---------------|
| File to H3 | Small (< 100MB) | On the fly | Static Resolution | Easy to adjust. Can easily change field to hexagonify |
| Dynamic Tile to H3 | Small or Large | On the fly | Dynamic Resolution | Easy to adjust. Can easily change field to hexagonify |
| Ingesting Dataset to H3 | Large (> 100MB) | Pre-computed | Dynamic Resolution | Requires deciding on which variable to hexagonify ahead of time |
For choosing the right resolution, see Resolution Guide.
## Example UDFs
- Ookla Download Speed Heatmap: Visualize download speeds across the world.
- US Crop Viewer: Explore crops around the US
- Overture Release Difference Heatmap: Visually identify differences between 2 Overture Building dataset releases.
================================================================================
## Resolution Guide
Path: guide/h3-analytics/resolution-guide.mdx
URL: https://docs.fused.io/guide/h3-analytics/resolution-guide
# H3 Resolution Guide
Cheat sheet for choosing the right H3 resolution.
## Resolution Table
| H3 Resolution (`res`) | Average Hex Area (m²) | Average Hex Edge Length (m) | Pixel Size Equivalent (m, √ avg hex area) | Common Raster Dataset Example |
|-----------------------|-----------------------|-----------------------------|-----------------------------------|----------------------------------------|
| 0 | 4,357,449,416,078 | 1,281,256 | 2,087,465 | |
| 1 | 609,788,441,794 | 483,057 | 780,889 | |
| 2 | 86,801,780,399 | 182,513 | 294,621 | |
| 3 | 12,393,434,655 | 68,979 | 111,325 | |
| 4 | 1,770,347,654 | 26,072 | 42,075 | ERA 5 (0.25deg ~ 27km at Equator)|
| 5 | 252,903,858 | 9,854 | 15,903 | |
| 6 | 36,129,062 | 3,725 | 6,011 | |
| 7 | 5,161,293 | 1,406 | 2,272 | |
| 8 | 737,328 | 531 | 859 | |
| 9 | 105,333 | 201 | 325 | Modis Vegetation Index (250m)|
| 10 | 15,048 | 76 | 123 | |
| 11 | 2,150 | 29 | 46 | Landsat Collection 2 (30m) |
| 12 | 307.1 | 10.8 | 17.5 | Sentinel-2 (10m) |
| 13 | 43.9 | 4.1 | 6.6 | |
| 14 | 6.3 | 1.5 | 2.5 | USGS LiDAR DEM (1m) |
| 15 | 0.9 | 0.6 | 0.9 | |
**Notes:**
- Values are approximate (area and edge length slightly vary by latitude/longitude).
- "Pixel Size Equivalent" is the square root of the average hex area, to aid raster/pixel comparison.
For more details see the H3 Cell Counts Stats page.
## Quick Reference
| Resolution | Avg Edge Length | Use Case |
|------------|-----------------|----------|
| 0 | 1107.71 km | Continental |
| 3 | 59.81 km | Regional |
| 5 | 8.54 km | City |
| 7 | 1.22 km | Neighborhood |
| 9 | 174.38 m | Block |
| 11 | 24.91 m | Building |
| 15 | 0.51 m | Sub-meter |
## Choosing Resolution
By default, when ingesting raster data to H3, the resolution is inferred from the raster data. Using the resolution of the raster input, it chooses an H3 resolution with a cell size that is as close as possible to but larger than the pixel size (at the center of the raster).
For example:
- Resolution 11 for a raster with pixel size of 30x30m
- Resolution 10 for a raster with pixel size of 90x90m
================================================================================
## Visualization
Path: guide/h3-analytics/visualization.mdx
URL: https://docs.fused.io/guide/h3-analytics/visualization
# H3 Visualization
## In Workbench Map Viewer
Quick styling options for H3 data in Workbench:
- Vector `H3HexagonLayer`
- Vector `H3HexagonLayer` with Tiles
---
## Interactive Visualizations in Canvas
In Fused Canvas you can create interactive visualizations by combining UDFs together.
We can create a more advanced version of these visualizations using by creating UDFs that leverage postMessages to talk to each other.
### Connecting Histogram & Map
**Launch the interactive Crop Exploration Dashboard →**
We provide these UDFs for now as-is. You can duplicate them and modify them to work with your own data:
The Range Histogram UDF allows you to visualize the distribution of a continuous variable (like elevation or temperature) as an interactive histogram. You can select a range to filter the data on the map.
```python
# doctest: skip
@fused.udf
def udf(
# Replace with your own data URL
data_url: str = "https://staging.udf.ai/UDF_join_era5_cdl_elevation/run?dtype_out_raster=png&dtype_out_vector=parquet",
theme: str = "workbench",
auto_fetch: bool = True,
dataset: str = "all", # IMPORTANT: match the map’s DATASET or use "all"
num_bins: int = 50,
value_field: str = "elevation",
title: str = "Elevation",
channel: str = "fused-elevation-temp" # IMPORTANT: match the map’s CHANNEL
):
common = fused.load("https://github.com/fusedio/udfs/tree/b6786d6/public/common/")
_ = fused.load("join_era5_cdl_elevation")
themes =
}
selected = themes.get(theme, themes['workbench'])
safe_title = (
title.replace("&", "&")
.replace("<", "<")
.replace(">", ">")
.replace('"', """)
.replace("'", "'")
)
html_content = """
"""
return common.html_to_obj(html_content)
```
The Categorical Bar Chart UDF is used to visualize counts of each category (such as crop types). Clicking a bar will filter the map to display only the selected category.
```python
@fused.udf
def udf(
# Replace with your own data URL
data_url: str = "https://staging.udf.ai/UDF_join_era5_cdl_elevation/run?dtype_out_raster=png&dtype_out_vector=parquet",
theme: str = "workbench",
auto_fetch: bool = True,
dataset: str = "all",
value_field: str = "crop_rank_1",
title: str = "Top 10 Crop Types",
channel: str = "fused-elevation-temp"
):
common = fused.load("https://github.com/fusedio/udfs/tree/b6786d6/public/common/")
_ = fused.load("join_era5_cdl_elevation")
# Load crop name mapping
cdl_crop_types_udf = fused.load("cdl_crop_types_indexing")
crop_df = cdl_crop_types_udf()
crop_mapping = dict(zip(crop_df['ID'], crop_df['Name']))
# Convert to JavaScript object string
crop_mapping_js = ": '',\n"
crop_mapping_js += " }"
themes =
}
selected = themes.get(theme, themes['workbench'])
safe_title = (
title.replace("&", "&")
.replace("<", "<")
.replace(">", ">")
.replace('"', """)
.replace("'", "'")
)
html_content = """
"""
return common.html_to_obj(html_content)
```
The Map UDF renders the geospatial hexagons and supports interactions with the histogram or bar chart to update map highlights in real time.
```python
# doctest: skip
common = fused.load("https://github.com/fusedio/udfs/tree/b6786d6/public/common/")
DEFAULT_CONFIG = r""",
"hexLayer":
}
}"""
DEFAULT_STYLE_URL = "https://basemaps.cartocdn.com/gl/dark-matter-gl-style/style.json"
@fused.udf
def udf(
# replace with your own data URL
data_url: str = "https://staging.udf.ai/UDF_join_era5_cdl_elevation/run?dtype_out_raster=png&dtype_out_vector=parquet",
config_json: str = DEFAULT_CONFIG,
mapbox_token: str = "pk.eyJ1IjoiaXNhYWNmdXNlZGxhYnMiLCJhIjoiY2xicGdwdHljMHQ1bzN4cWhtNThvbzdqcSJ9.73fb6zHMeO_c8eAXpZVNrA",
center_lng: float = -119.4179,
center_lat: float = 36.7783,
zoom: float = 4,
tooltip_columns: list = ["crop_rank_1", "elevation", "daily_mean"],
default_query: str = "SELECT * FROM data",
map_style_url: str = DEFAULT_STYLE_URL,
channel: str = "fused-elevation-temp",
dataset: str = "all",
):
from jinja2 import Template
style_url = map_style_url or DEFAULT_STYLE_URL
_ = fused.load("join_era5_cdl_elevation")
html = Template(r"""
""").render(
data_url=data_url,
config_json=config_json,
mapbox_token=mapbox_token,
map_style_url=style_url,
default_style_url=DEFAULT_STYLE_URL,
center_lng=center_lng,
center_lat=center_lat,
zoom=zoom,
tooltip_columns=tooltip_columns,
default_query=default_query,
channel=channel,
dataset=dataset,
)
return common.html_to_obj(html)
```
Feel free to directly reach out to us at `info@fused.io` if you have any questions on implementing this yourself
================================================================================
## What is Fused?
Path: guide/overview.mdx
URL: https://docs.fused.io/guide/guide-overview
# What is Fused?
Fused is the glue between your data and the tools that consume it: write Python functions that run serverlessly — on our cloud, with no servers for you to set up or manage — and expose them as secure HTTP endpoints. No containers, no infrastructure config, no waiting.
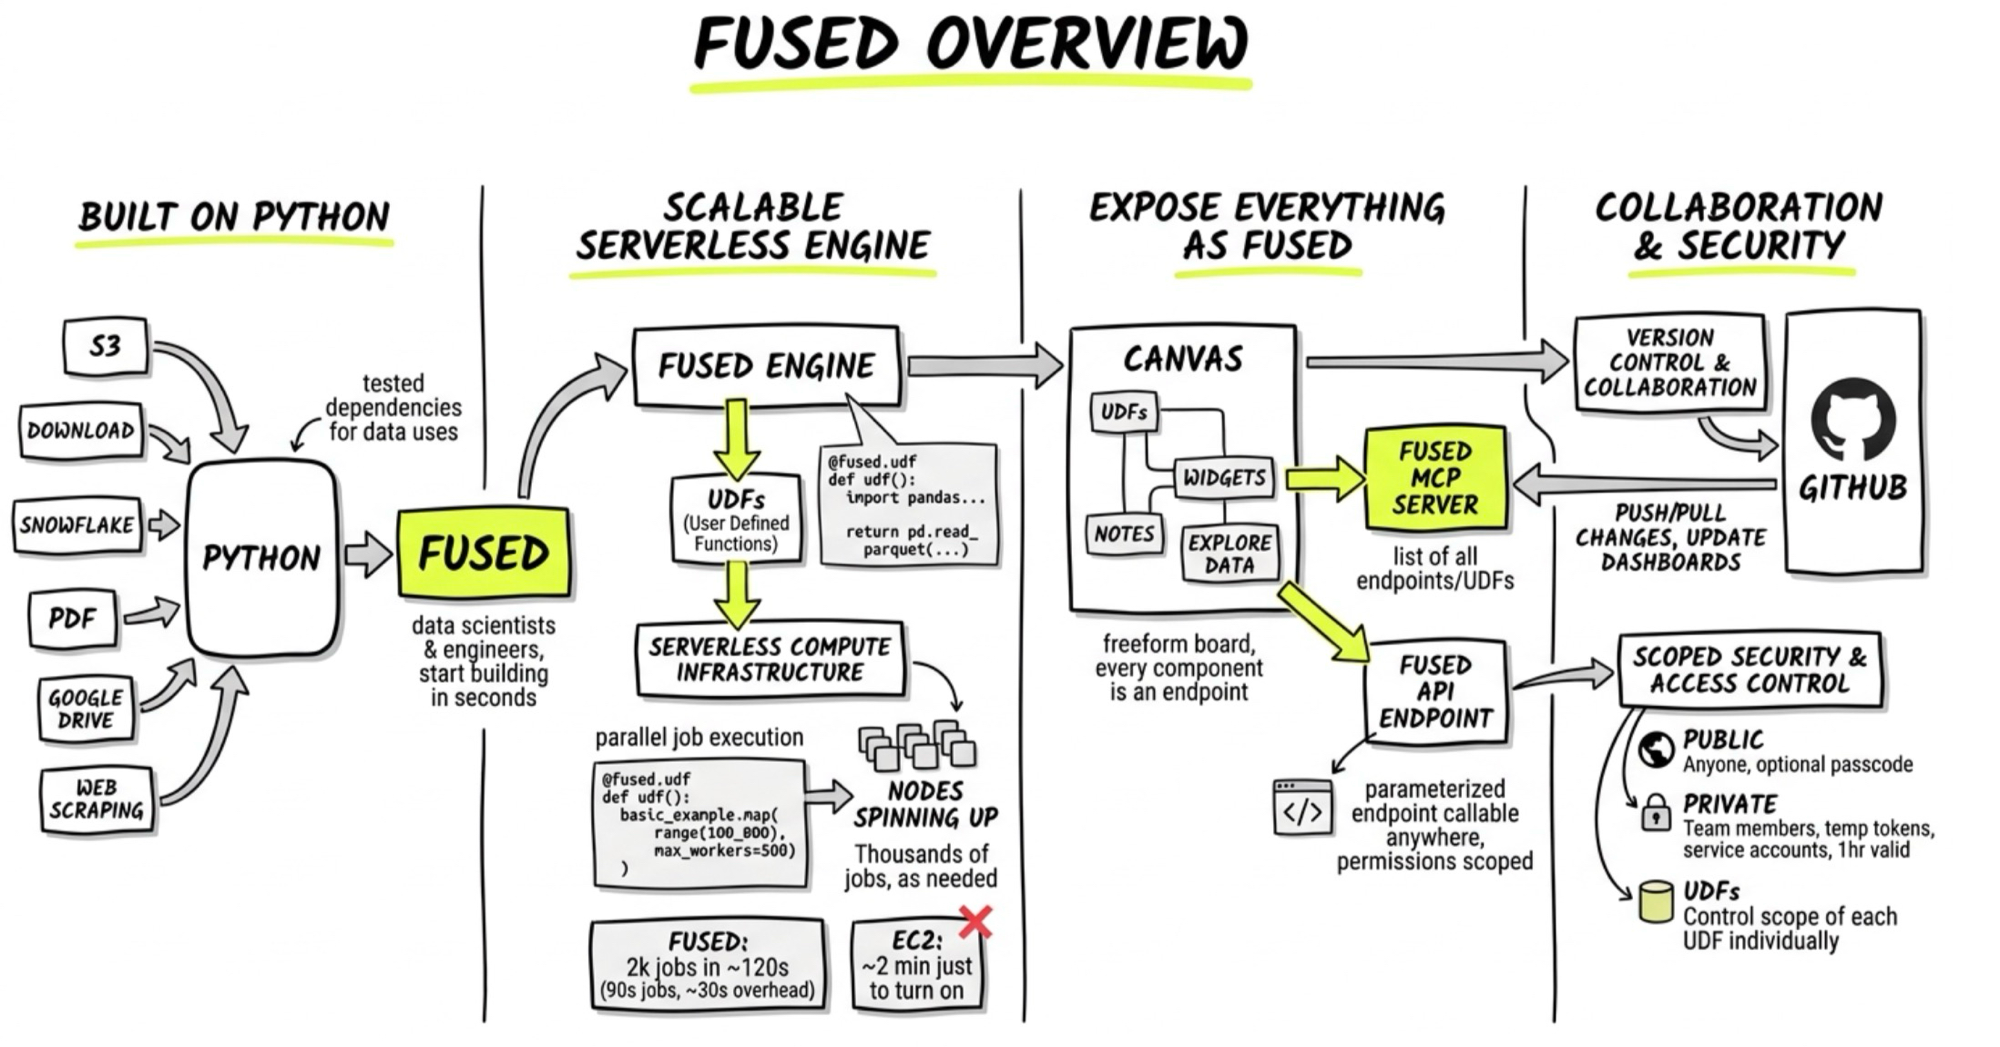 ---
## Built on Python
Python is the language of data. Whether you want to load data from S3, Snowflake, or Google Drive, or extract from a PDF, scrape a website, or process a one-time download, there's a way to do it in Python. It's the most versatile tool for working with any data, regardless of type, origin, or size.
We ship an opinionated and tested set of dependencies that covers most modern data use cases, so data scientists and engineers can start building in seconds, not hours.
---
## Scalable serverless engine
Python alone isn't enough. Scaling up compute on demand normally means deploying a new Docker container. Fused lets you create **User Defined Functions (UDFs)**: simple, self-contained Python functions that run on our cloud. **Serverless** just means you never provision, configure, or pay for an idle machine — Fused spins up exactly the compute each run needs, then shuts it down. All you need is a `@fused.udf` decorator:
```python
@fused.udf
def udf():
return pd.read_parquet("s3://fused-sample/demo_data/airbnb_listings_sf.parquet")
```
You can call thousands of jobs at the same time:
```python
@fused.udf
def udf():
basic_example = fused.load('process_data') # Load existing UDF
results = basic_example.map(range(100_000), max_workers=500) # Run in parallel
return results.df()
```
This spins up as many nodes as needed under the hood.
---
## Built on Python
Python is the language of data. Whether you want to load data from S3, Snowflake, or Google Drive, or extract from a PDF, scrape a website, or process a one-time download, there's a way to do it in Python. It's the most versatile tool for working with any data, regardless of type, origin, or size.
We ship an opinionated and tested set of dependencies that covers most modern data use cases, so data scientists and engineers can start building in seconds, not hours.
---
## Scalable serverless engine
Python alone isn't enough. Scaling up compute on demand normally means deploying a new Docker container. Fused lets you create **User Defined Functions (UDFs)**: simple, self-contained Python functions that run on our cloud. **Serverless** just means you never provision, configure, or pay for an idle machine — Fused spins up exactly the compute each run needs, then shuts it down. All you need is a `@fused.udf` decorator:
```python
@fused.udf
def udf():
return pd.read_parquet("s3://fused-sample/demo_data/airbnb_listings_sf.parquet")
```
You can call thousands of jobs at the same time:
```python
@fused.udf
def udf():
basic_example = fused.load('process_data') # Load existing UDF
results = basic_example.map(range(100_000), max_workers=500) # Run in parallel
return results.df()
```
This spins up as many nodes as needed under the hood.
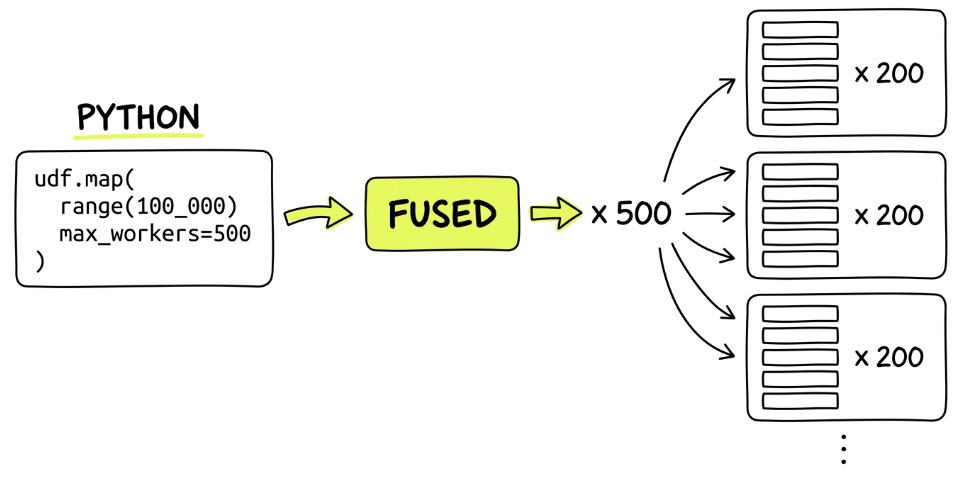 To put that in perspective: two thousand 90-second jobs complete in 120 wall-clock seconds, just 30 seconds of total orchestration overhead, at 0.015s per job, each on a dedicated 4-core machine with 10 GB of RAM. A regular EC2 instance takes ~2 minutes just to turn on. Fused does the whole job in that time.
---
## Expose everything as an API
Every project you build in Fused lives in a **Canvas**: a freeform board where every component is either a UDF running Python, a sticky note, or a widget to explore data.
To put that in perspective: two thousand 90-second jobs complete in 120 wall-clock seconds, just 30 seconds of total orchestration overhead, at 0.015s per job, each on a dedicated 4-core machine with 10 GB of RAM. A regular EC2 instance takes ~2 minutes just to turn on. Fused does the whole job in that time.
---
## Expose everything as an API
Every project you build in Fused lives in a **Canvas**: a freeform board where every component is either a UDF running Python, a sticky note, or a widget to explore data.
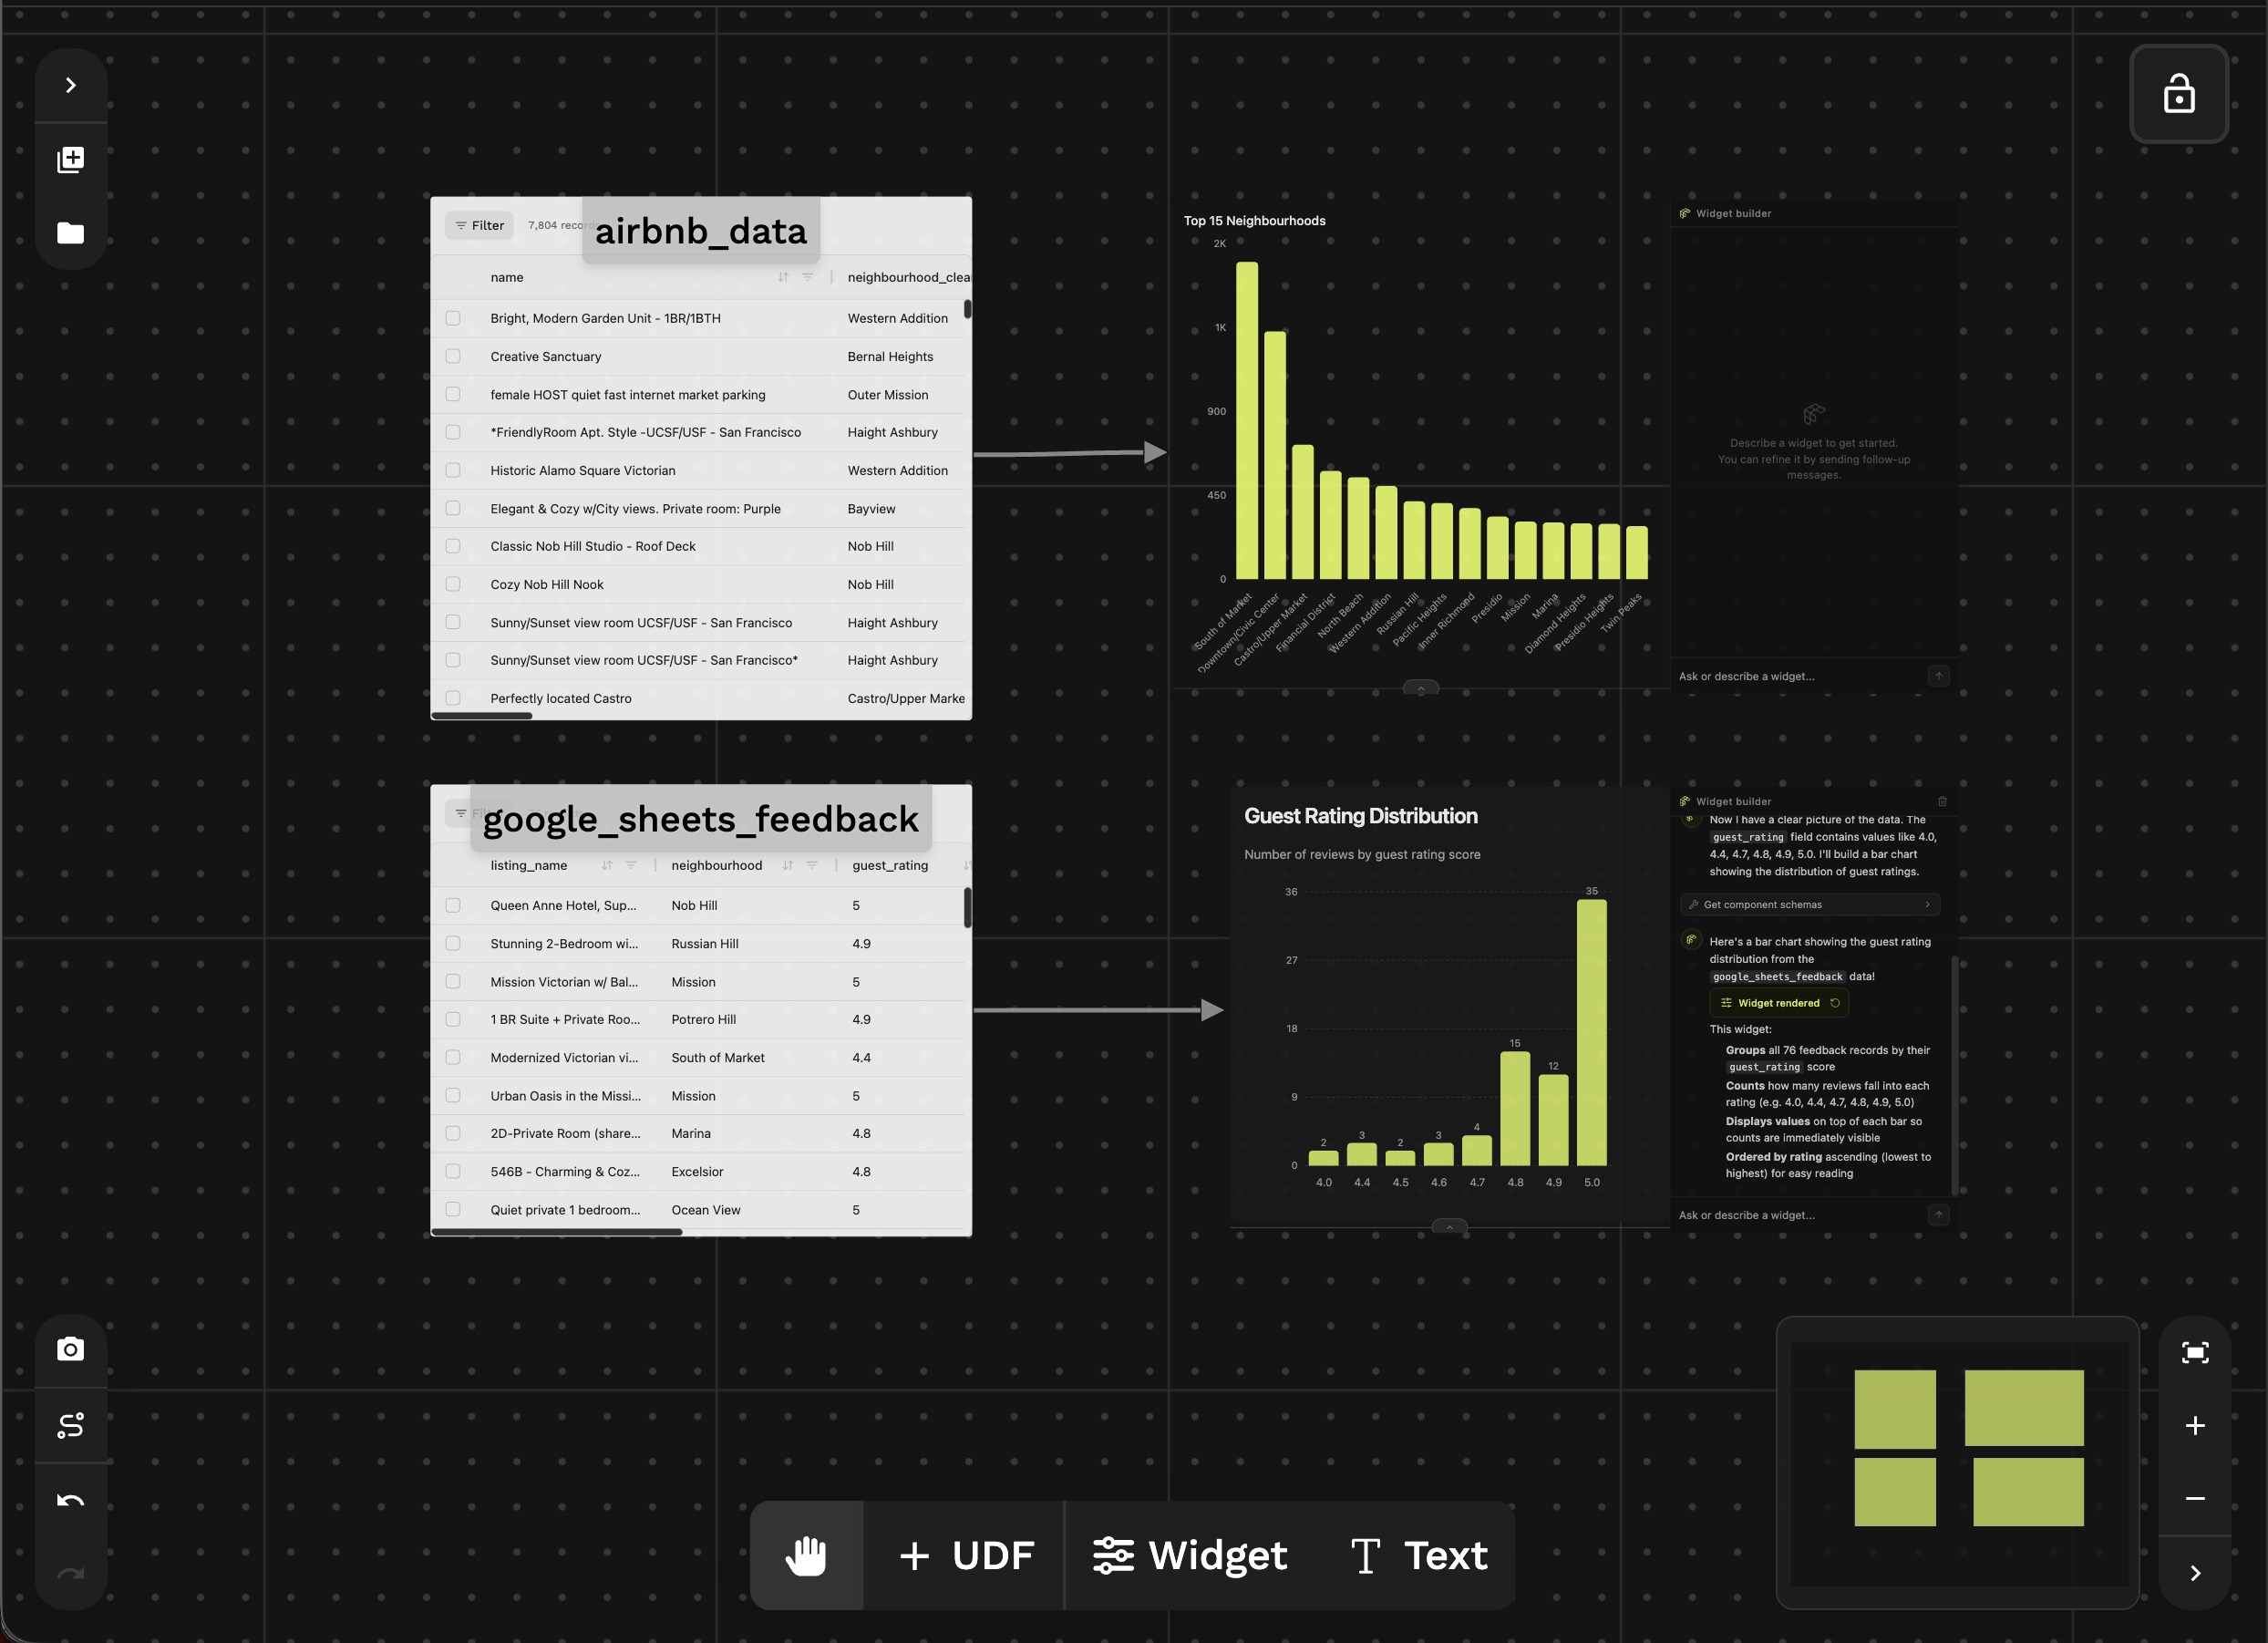 Each Canvas is shareable, and every component is directly accessible through an API call. Think of a Canvas as a directory of all your endpoints, and each UDF as an endpoint.
Every Canvas can also be turned into a **Fused MCP Server**: a list of all the endpoints in your Canvas, corresponding to all your UDFs:
Each Canvas is shareable, and every component is directly accessible through an API call. Think of a Canvas as a directory of all your endpoints, and each UDF as an endpoint.
Every Canvas can also be turned into a **Fused MCP Server**: a list of all the endpoints in your Canvas, corresponding to all your UDFs:
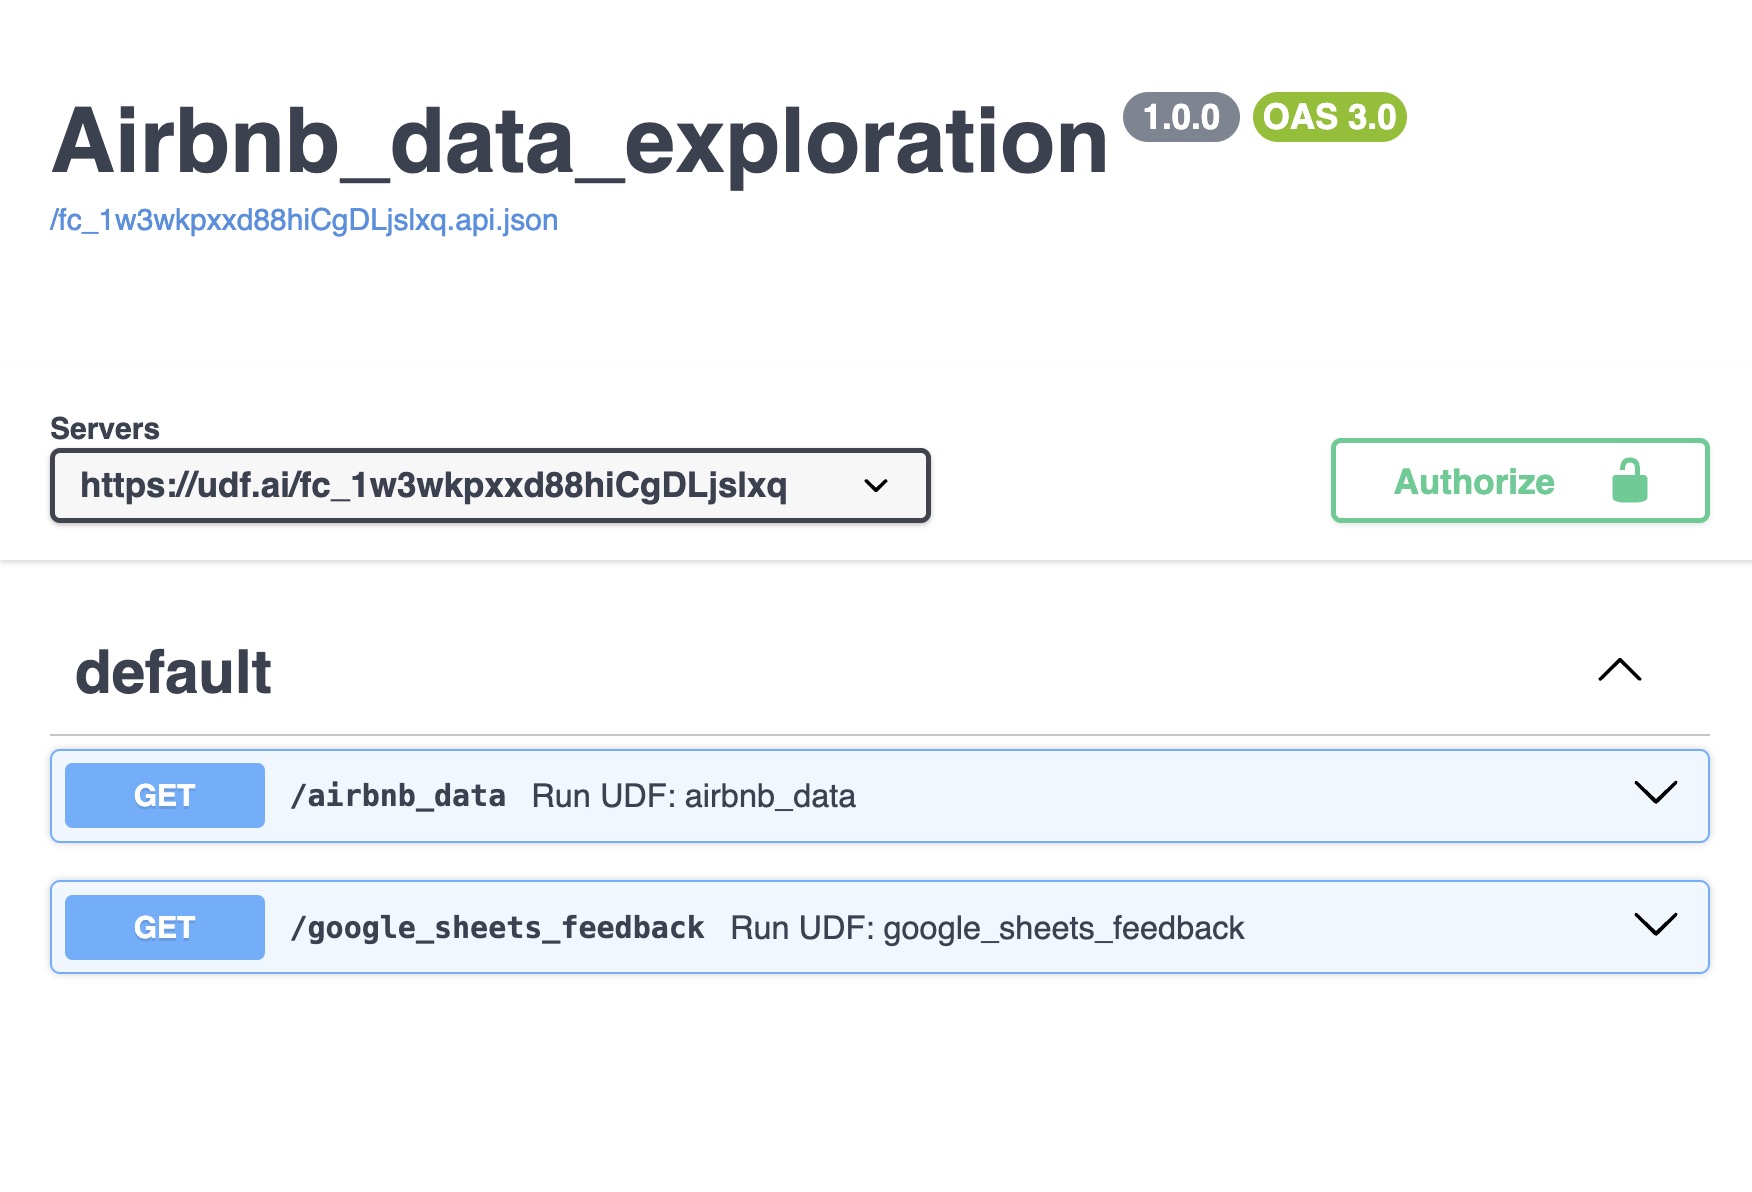 Every UDF you create can instantly become a parameterized endpoint callable from anywhere, once you've scoped the right permissions:
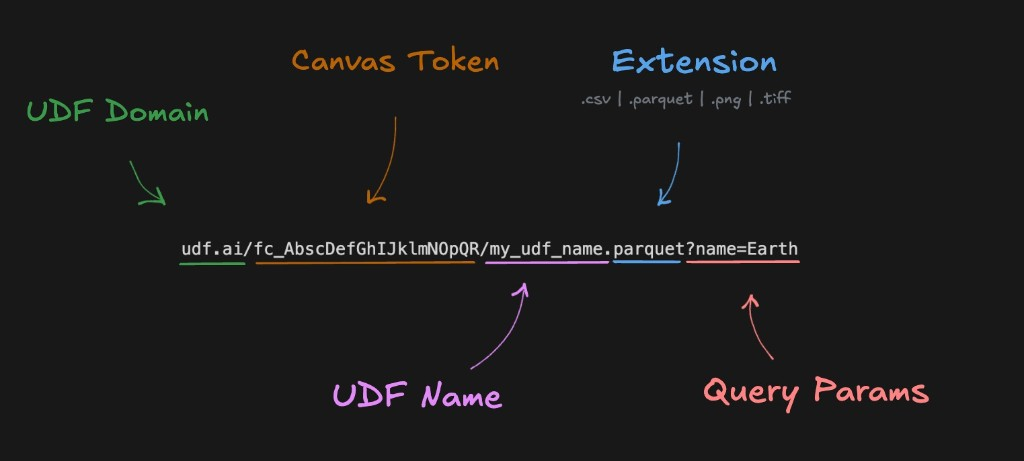 ---
## Version control & team collaboration
Since users are doing real work in Fused, version control matters. The Canvas can be collaborated on and connected directly to GitHub to store and version-control your code.
---
## Version control & team collaboration
Since users are doing real work in Fused, version control matters. The Canvas can be collaborated on and connected directly to GitHub to store and version-control your code.
 Teams can make edits directly from GitHub and push or pull changes to update dashboards and visualizations in real time.
---
## Scoped security & access control
Every Fused project can be shared and turned into a Fused MCP server, with fine-grained control over who can access what:
- **Public**: Anyone can see and execute your UDFs. Optionally require a passcode.
- **Private**: Only members of your Fused team can access your work. Issue temporary access tokens (e.g. valid for 1 hour) or use service accounts for secure machine-to-machine delivery.
You control the scope of each UDF individually.
---
## Example: RAG your docs
We built a bot that answers questions about Fused documentation directly in Slack, all built inside Fused itself.
Teams can make edits directly from GitHub and push or pull changes to update dashboards and visualizations in real time.
---
## Scoped security & access control
Every Fused project can be shared and turned into a Fused MCP server, with fine-grained control over who can access what:
- **Public**: Anyone can see and execute your UDFs. Optionally require a passcode.
- **Private**: Only members of your Fused team can access your work. Issue temporary access tokens (e.g. valid for 1 hour) or use service accounts for secure machine-to-machine delivery.
You control the scope of each UDF individually.
---
## Example: RAG your docs
We built a bot that answers questions about Fused documentation directly in Slack, all built inside Fused itself.
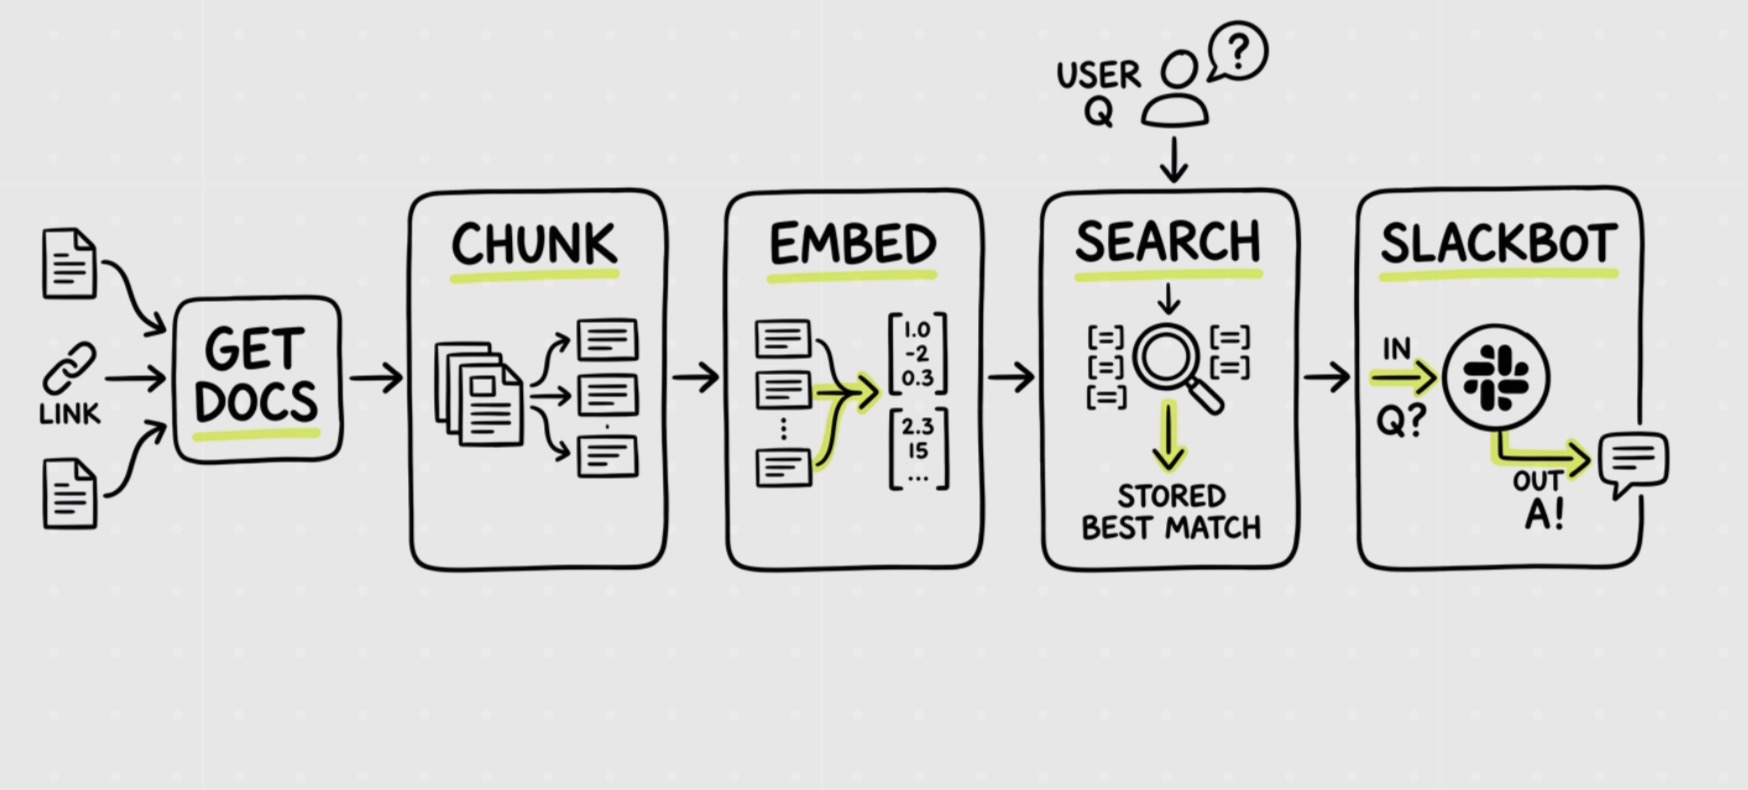 It works in three steps:
- **Connect**: Crawl any docs site via its sitemap, parallelize fetching and cleaning all pages into a single `llms.txt` file saved to S3.
- **Process**: Fetch the file, split into overlapping chunks, embed with an off-the-shelf LLM, write vector embeddings to a LanceDB table.
- **Expose**: A `vector_search` UDF takes a natural language question, embeds it, runs a cosine similarity lookup, and returns the top 4 most relevant chunks, cached for 1 hour.
The result: any AI agent (or Slack bot) can query your docs with a single request:
```
https://udf.ai/fc_YOUR_SHARED_TOKEN/vector_search.json?question=what is fused?
```
All on S3, simple Python, smart caching, and parallel processing, no additional setup. See the full example in the docs.
---
## Get started
- ⚡️ Quickstart Guide: Write your first UDF in minutes
- 💻 Writing UDFs: Learn UDF structure and best practices
- 🍿 Getting Started With Fused: 1–4 min videos to get you up and running
================================================================================
## UDFs as API
Path: guide/working-with-udfs/run-udfs-as-api.mdx
URL: https://docs.fused.io/guide/working-with-udfs/run-udfs-as-api
# UDFs as API
Every UDF can be used as a file system.
[Image: UDF API URL structure: domain, canvas token, UDF name, extension, query params]
Share your canvas to get a canvas token (`fc_***`); then call any UDF by name.
## Output formats
UDFs can return data in various formats via the `format` query parameter:
### Vector data formats
| Format | Extension | Description |
|--------|-----------|-------------|
| `parquet` | `.parquet` | Efficient columnar storage format |
| `geojson` | `.geojson` | Standard GeoJSON format |
| `json` | `.json` | JSON objects and GeoJSON |
| `csv` | `.csv` | Comma-separated values |
| `mvt` | `.mvt` | Mapbox Vector Tiles |
| `feather` | `.feather` | Apache Arrow IPC format |
| `excel` | `.xlsx` | Excel spreadsheet |
| `xml` | `.xml` | XML data |
| `html` | `.html` | HTML document |
### Raster data formats
| Format | Extension | Description |
|--------|-----------|-------------|
| `png` | `.png` | Lossless raster images |
| `jpeg` | `.jpeg` / `.jpg` | Compressed raster images |
| `gif` | `.gif` | Animated or static images |
| `webp` | `.webp` | Modern efficient image format |
| `apng` | `.apng` | Animated PNG images |
| `svg` | `.svg` | Scalable vector graphics |
| `tiff` | `.tiff` / `.tif` | GeoTIFF and TIFF rasters |
| `npy` | `.npy` | NumPy array binary format |
## Example usage
Use your canvas token and UDF name (from sharing your canvas):
### Returning as JSON
```bash
https://udf.ai/fc_/my_udf.json
```
### Returning as CSV
```bash
https://udf.ai/fc_/my_udf.csv
```
### Returning as HTML
```bash
https://udf.ai/fc_/my_udf.html
```
## Tile endpoints
For map tile servers, use the `tiles` path with `//` template:
### Vector tiles (MVT)
```bash
https://udf.ai/fc_/my_udf/run/tiles///?=mvt
```
When consuming Fused MVT tiles in tools that require a `source-layer` name (like Mapbox GL JS, MapLibre, or react-map-gl), the layer is always named `udf`.
### Raster tiles (PNG)
```bash
https://udf.ai/fc_/my_udf/run/tiles///?=png
```
## Integrations
These dynamic endpoints work with:
- DeckGL - Interactive maps
- Mapbox - Web maps
- QGIS - Desktop GIS
- Felt - Collaborative mapping
- Google Sheets - Spreadsheet import
If you rename a UDF in Workbench, the API URL changes — the old URL (with the previous name) will no longer work. Update any clients or bookmarks that call the UDF by URL.
================================================================================
## Parallel execution
Path: guide/working-with-udfs/run-udfs-in-parallel.mdx
URL: https://docs.fused.io/guide/working-with-udfs/fused-submit
Run a UDF over multiple inputs in parallel.
## Using `.map()`
Call `.map()` on a UDF to run it over multiple inputs in parallel:
```python
# doctest: skip
my_udf.map(
arg_list, # list of arguments, each element becomes a job
*,
engine=None, # "remote" (default), "local", or instance type
cache_max_age=None, # max cache age
max_workers=None, # max parallel workers (default 32)
worker_concurrency=None, # concurrency per worker (default 1)
cache=True, # set False to disable caching
max_retry=2, # max retries for failed jobs
) -> JobPool
```
See the `Udf.map()` API reference for full details.
## Basic example
```python
@fused.udf
def udf():
# Create a pool of jobs
pool = my_udf.map([1, 2, 3, 4, 5])
# Wait and collect results as DataFrame
df = pool.df()
return df
@fused.udf
def my_udf(x: int):
return x ** 2
```
## Input formats
| Format | Example | Use case |
|--------|---------|----------|
| List | `[0, 1, 2, 3]` | Single parameter |
| List of dicts | `[, ]` | Multiple parameters |
Each item becomes a separate job.
```python
@fused.udf
def udf():
# Create a pool of jobs
pool = my_udf.map([, ])
df = pool.df()
return df
@fused.udf
def my_udf(a: int, b: int):
return a + b
```
### Passing multiple arguments
You can also pass multiple arguments as a list of dictionaries:
```python
@fused.udf
def udf():
arg_list = [
,
,
,
]
pool = my_udf.map(arg_list)
return pool.df()
@fused.udf
def my_udf(a: int, b: int):
return a + b
```
Each dict is one job, so this runs `(1,2)`, `(3,4)`, `(5,6)`.
`pool.df()` returns:
| a | b | result |
|---|---|--------|
| 1 | 2 | 3 |
| 3 | 4 | 7 |
| 5 | 6 | 11 |
If your values are already split across separate lists, `zip` is a compact alternative:
```python
# doctest: skip
arg_list = [ for a, b in zip(a_values, b_values)]
```
You can also pass a pandas DataFrame where each row is one job:
```python
@fused.udf
def udf():
arg_list = pd.DataFrame()
pool = my_udf.map(arg_list)
return pool.df()
@fused.udf
def my_udf(a: int, b: int):
return a + b
```
This returns the same `pool.df()` output shown above.
For single-parameter UDFs, this also works with an `input` column:
```python
@fused.udf
def udf():
arg_list = pd.DataFrame()
pool = my_udf.map(arg_list)
return pool.df()
@fused.udf
def my_udf(input: int):
return input ** 2
```
## Parameters
### `engine`
Same as running UDFs. Default: `"remote"`
| Mode | Best for |
|------|----------|
| `"remote"` (default) | Many quick jobs |
| `"small"`/`"medium"`/`"large"` | Long/heavy jobs |
### `max_workers`
Number of instances to spin up in parallel. Default: `32`, Max: `1000`.
```python
# doctest: skip
# Spin up 100 instances in parallel
pool = my_udf.map(inputs, max_workers=100)
```
### `max_retry`
Max retries per failed job. Default: `2`
### `cache_max_age`
Same as running UDFs.
### `worker_concurrency`
Number of arguments to pass to the UDF per instance. Default: `1`.
```python
@fused.udf
def udf():
# Running 10 jobs in parallel but with 4 jobs per UDF instance
pool = my_udf.map(range(10), worker_concurrency=4)
df = pool.df()
return df
@fused.udf
def my_udf(x: int):
return x ** 2
```
## Working with results
`.map()` returns a `JobPool` object:
```python
# doctest: skip
pool = my_udf.map(inputs)
pool.wait() # Show progress bar
pool.total_time() # Total wall time
pool.times() # Time per job
pool.first_error() # First error encountered
pool.df() # Get results as DataFrame
pool.results() # Get results as list
```
See the `JobPool` API reference for full details.
## See also
- Running UDFs — single UDF execution
- Scaling out UDFs — best practices
- `JobPool` API reference — all JobPool methods
---
## [Legacy]: `fused.submit()`
The `fused.submit()` function still works but `.map()` is preferred:
```python
# Legacy
results = fused.submit(my_udf, inputs)
# Preferred
pool = my_udf.map(inputs)
results = pool.df()
```
================================================================================
## Running UDFs
Path: guide/working-with-udfs/run-udfs-in-python.mdx
URL: https://docs.fused.io/guide/working-with-udfs/fused-run
Run a UDF and get results back.
## Calling a UDF
UDFs are callable objects—call them directly like regular Python functions:
```python
# doctest: skip
my_udf(
*args, # positional arguments
engine=None, # "remote" (default), "local", or instance type
cache_max_age=None, # max cache age, e.g. "48h", "10s"
cache=True, # set False to disable caching
**kwargs, # keyword arguments
)
```
See the `Udf` API reference for full details.
## Loading a UDF
Use `fused.load()` to get a UDF object, then call it directly:
| Method | Syntax | Use case |
|--------|--------|----------|
| Your UDF | `fused.load("my_udf")` | Load a saved UDF by name |
| Team UDF | `fused.load("team/my_udf")` | Shared team UDFs |
| Public UDF | `fused.load("UDF_Name")` | Public UDFs (free) |
| Token | `fused.load("fsh_***")` | Legacy per-UDF token; still supported. Share UDF without exposing code |
| Git commit | `fused.load("github.com/.../tree//")` | Production stability |
Legacy `fsh_` tokens remain supported in the Python SDK; for new sharing, use canvas tokens (`fc_/`).
```python
# Load and call
my_udf = fused.load("my_udf")
result = my_udf(name="hello")
```
```python
commit_hash = "bdfb4d0"
my_udf = fused.load(f"https://github.com/fusedio/udfs/tree//public/My_UDF/")
result = my_udf()
```
Avoid pointing to `main` branch—your UDF will change when others push to it.
## Parameters
### `engine`
Controls where your UDF runs:
| Value | Where it runs | RAM | Time limit |
|-------|---------------|-----|------------|
| `"remote"` / `"realtime"` (default) | Serverless instance | ~10GB | 120s |
| `"local"` | Current process | — | — |
| `"small"` | Dedicated machine | 2 GB | None |
| `"medium"` | Dedicated machine | 64 GB | None |
| `"large"` | Dedicated machine | 512 GB | None |
| AWS/GCP type (e.g. `"m5.4xlarge"`) | Dedicated machine | Varies | None |
```python
# doctest: skip
result = my_udf(engine="medium") # 64 GB RAM, no time limit
```
**`local` contexts:**
| Context | What happens |
|---------|--------------|
| Inside a UDF | Shares that UDF's compute (120s, ~10GB) |
| Inside a batch job | Shares the batch instance resources |
| On your laptop | Runs on local machine |
Set a default engine when defining a UDF:
```python
@fused.udf(engine="large")
def my_udf():
...
```
In Workbench, UDFs with a batch engine will prompt for confirmation before running.
| Instance Type | vCPUs | Memory (GB) |
|---------------|-------|-------------|
| `t3.small` | 2 | 2 |
| `t3.medium` | 2 | 4 |
| `t3.large` | 2 | 8 |
| `t3.xlarge` | 4 | 16 |
| `t3.2xlarge` | 8 | 32 |
| `m5.large` | 2 | 8 |
| `m5.xlarge` | 4 | 16 |
| `m5.2xlarge` | 8 | 32 |
| `m5.4xlarge` | 16 | 64 |
| `m5.8xlarge` | 32 | 128 |
| `m5.12xlarge` | 48 | 192 |
| `m5.16xlarge` | 64 | 256 |
| `r5.large` | 2 | 16 |
| `r5.xlarge` | 4 | 32 |
| `r5.2xlarge` | 8 | 64 |
| `r5.4xlarge` | 16 | 128 |
| `r5.8xlarge` | 32 | 256 |
| `r5.12xlarge` | 48 | 384 |
| `r5.16xlarge` | 64 | 512 |
| Instance Type | vCPUs | Memory (GB) |
|---------------|-------|-------------|
| `c2-standard-4` | 4 | 16 |
| `c2-standard-8` | 8 | 32 |
| `c2-standard-16` | 16 | 64 |
| `c2-standard-30` | 30 | 120 |
| `c2-standard-60` | 60 | 240 |
| `m3-ultramem-32` | 32 | 976 |
| `m3-ultramem-64` | 64 | 1,952 |
### `cache_max_age`
Control how long results are cached. UDFs are cached for **14 days by default**.
| Value | Meaning |
|-------|---------|
| `None` (default) | Follow `@fused.udf()` setting (14 days) |
| `"0s"` | No caching |
| `"10s"`, `"48h"`, `"1d"` | Cache for specified duration |
```python
result = my_udf(cache_max_age="1h") # Cache for 1 hour
result = my_udf(cache=False) # Disable caching
```
Set a default cache duration in the UDF decorator:
```python
@fused.udf(cache_max_age="1d")
def my_udf():
...
```
Learn more about caching.
## Passing arguments
Pass UDF parameters as keyword arguments:
```python
@fused.udf
def my_udf(name: str, count: int = 1):
return pd.DataFrame()
result = my_udf(name="hello", count=3)
```
## Reserved parameters
These parameters control how Fused structures the `bounds` object for tile UDFs.
### With `x`, `y`, `z`
```python
overture_udf = fused.load("UDF_Overture_Maps_Example")
result = overture_udf(x=5241, y=12662, z=15)
```
### With `bounds` as GeoDataFrame
```python
# doctest: skip
bounds = gpd.GeoDataFrame.from_features()
result = overture_udf(bounds=bounds)
```
### With `bounds` as bbox list
```python
# doctest: skip
# [min_x, min_y, max_x, max_y]
result = overture_udf(bounds=[-122.349, 37.781, -122.341, 37.818])
```
## See also
- Run UDFs efficiently — best practices
- Parallel execution — run over multiple inputs
- Caching — how caching works
- `Udf` API reference — full API details
---
## [Legacy]: `fused.run()`
The `fused.run()` function still works but direct UDF calling is preferred:
```python
# Legacy
result = fused.run(my_udf, name="hello")
# Preferred
my_udf = fused.load("udf_name_here")
result = my_udf(name="hello")
```
================================================================================
## Scheduling UDFs
Path: guide/working-with-udfs/scheduling-udfs.mdx
URL: https://docs.fused.io/guide/working-with-udfs/scheduling-udfs
Schedule UDFs to run automatically on a recurring cron schedule. Scheduled UDFs execute on batch compute instances with no time limit, making them suitable for data pipelines, periodic refreshes, and automated workflows.
- Cronjobs can be scheduled at any combination of minute, hour, day of month, month, or day of week.
- Cronjobs can only be scheduled **once per hour**.
- Cronjobs run on **batch compute instances** with no execution time limit.
- There is a **1:1 relationship** between a UDF and a cronjob — the same UDF cannot have multiple schedules.
- A Fused developer or enterprise account is required to schedule UDFs.
## Creating a schedule
### With `fused.api.schedule_udf()`
Use `fused.api.schedule_udf()` to schedule any UDF by name or object:
```python
@fused.udf
def udf():
job = fused.api.schedule_udf(
udf=fused.load("my_etl_pipeline"),
minute=0,
hour=8,
udf_args=,
enabled=True,
)
print(job)
#
```
### Cron field reference
| Field | Parameter | Range | Default |
|-------|-----------|-------|---------|
| Minute | `minute` | 0–59 | *required* |
| Hour | `hour` | 0–23 | *required* |
| Day of month | `day_of_month` | 1–31 | Every day |
| Month | `month` | 1–12 | Every month |
| Day of week | `day_of_week` | 0–6 (0 = Sunday) | Every day |
Pass a single `int` for a specific value, or a `list[int]` for multiple values:
```python
@fused.udf
def udf():
# Run every day at 4:59 AM
fused.api.schedule_udf(udf="my_udf", minute=59, hour=4)
# Run at midnight on the 1st and 15th of every month
fused.api.schedule_udf(udf="my_udf", minute=0, hour=0, day_of_month=[1, 15])
# Run every Monday (1) and Friday (5) at noon
fused.api.schedule_udf(udf="my_udf", minute=0, hour=12, day_of_week=[1, 5])
```
## Passing arguments
Use `udf_args` to pass parameters to the scheduled UDF. These are forwarded as keyword arguments each time the job runs:
```python
@fused.udf
def udf():
fused.api.schedule_udf(
udf=fused.load("job_to_run"),
minute=59,
hour=4,
udf_args=,
enabled=True,
)
```
The target UDF receives them as typed parameters:
```python
@fused.udf(cache_max_age="0s")
def udf(message: str = "hello from cron!"):
print(message)
return pd.DataFrame()
```
## Listing schedules
Use `fused.api.schedule_list()` to retrieve all scheduled jobs for your team:
```python
@fused.udf
def udf():
jobs = fused.api.schedule_list()
print(f"Total jobs: ")
for job in jobs:
print(f" — — enabled=")
```
To inspect schedules as a DataFrame:
```python
@fused.udf(cache_max_age="0s")
def udf():
jobs = fused.api.schedule_list()
rows = []
for job in jobs:
row = job.model_dump()
rows.append()
return pd.DataFrame(rows)
```
You can also check a specific UDF's schedule with `udf.get_schedule()`:
```python
@fused.udf
def udf():
my_udf = fused.load("my_etl_pipeline")
schedules = my_udf.get_schedule()
print(schedules)
```
## Updating a schedule
Calling `fused.api.schedule_udf()` (or `udf.schedule()`) with a UDF that already has a schedule will **update the existing schedule** rather than creating a duplicate. This makes schedule creation idempotent:
```python
@fused.udf
def udf():
# Initially schedule at 8 AM
fused.api.schedule_udf(udf="my_udf", minute=0, hour=8)
# Change to 6 AM — updates the same cronjob
fused.api.schedule_udf(udf="my_udf", minute=0, hour=6)
```
To disable a schedule without deleting it, set `enabled=False`:
```python
@fused.udf
def udf():
fused.api.schedule_udf(udf="my_udf", minute=0, hour=8, enabled=False)
```
## Triggering a run manually
Use `run_now()` on a `CronJob` to trigger an immediate execution outside of the regular schedule:
```python
@fused.udf
def udf():
jobs = fused.api.schedule_list()
for job in jobs:
if job.name == "my_etl_pipeline":
result = job.run_now()
print(result)
break
```
## Deleting a schedule
Call `.delete()` on a `CronJob` to permanently remove it:
```python
@fused.udf
def udf(name: str = "my_etl_pipeline"):
jobs = fused.api.schedule_list()
for job in jobs:
if job.name == name:
job.delete()
print(f"Deleted job: ")
break
```
## Example: scheduled data pipeline
A complete example that fetches data and writes results to cloud storage, scheduled to run daily:
```python
@fused.udf(cache_max_age="0s")
def daily_weather_sync(city: str = "San Francisco"):
from datetime import datetime
response = requests.get(
f"https://api.open-meteo.com/v1/forecast?latitude=37.77&longitude=-122.42¤t_weather=true"
)
data = response.json()["current_weather"]
df = pd.DataFrame([])
path = f"fd://weather//.parquet"
df.to_parquet(path)
print(f"Wrote rows to ")
return df
```
Schedule it to run every day at 6:00 AM:
```python
@fused.udf
def udf():
job = fused.api.schedule_udf(
udf=fused.load("daily_weather_sync"),
minute=0,
hour=6,
udf_args=,
)
print(job)
#
```
Monitor execution results in the Job logs page.
## API reference
| Function | Description |
|----------|-------------|
| `fused.api.schedule_udf()` | Schedule a UDF on a cron schedule |
| `fused.api.schedule_list()` | List all scheduled jobs |
| `udf.schedule()` | Schedule a UDF (instance method) |
| `udf.get_schedule()` | Get existing schedules for a UDF |
================================================================================
## Building UDFs for Agents
Path: guide/working-with-udfs/udf-best-practices/agents.mdx
URL: https://docs.fused.io/guide/working-with-udfs/udf-best-practices/agents
Fused gives you a uniquely fast path from data to agent tool. Write a Python function that joins datasets from any source — FTP servers, one-time CSV downloads, internal APIs, legacy databases, files someone emailed you — do any processing you need, and click **Share → Open API** to instantly expose it as an MCP server. No infrastructure, no deployment, no waiting.
An agent calls a UDF the same way any HTTP client does:
```
GET https://udf.ai/fc_TOKEN/get_county_demographics.json?county_fips=06037
```
```json
```
The key to making this work well is keeping UDFs focused: return small, structured results rather than raw datasets. Agents work best when each tool call gives them a precise answer, not a table they have to reason over. UDFs also have a 120s execution limit — another reason to precompute and serve summaries rather than doing heavy work at call time. This guide covers how to design UDFs that agents can discover, call, and chain reliably.
## Three patterns for agent UDFs
### Pattern A: Data query
The most common pattern. The agent calls the UDF to answer a factual question and uses the response to reason further.
- Returns a small dict or DataFrame (< ~20 rows)
- Field names are self-explanatory
- Call via `.json` endpoint
```python
# get_county_demographics
@fused.udf
def udf(county_fips: str = "06037", year: int = 2023):
"""
Returns population and median income for a specific US county.
Use when the user asks about demographics for a named county.
"""
...
return
```
Agent call: `GET /fc_TOKEN/get_county_demographics.json?county_fips=06037`
---
### Pattern B: Action / trigger
The UDF kicks off a long-running job (ingestion, report generation, batch processing) and returns immediately with a job reference. The agent doesn't wait for completion.
```python
# trigger_census_ingestion
@fused.udf
def udf(dataset: str = "census_2023", region: str = "CA"):
"""
Triggers a batch ingestion job for the specified dataset and region.
Returns immediately with a job ID. Use the job ID with the
check_ingestion_status UDF to monitor progress.
Do NOT use this to fetch data — use get_county_demographics instead.
"""
job_id = str(uuid.uuid4())
enqueue_batch_job(dataset=dataset, region=region, job_id=job_id)
return / ",
}
```
A synchronous UDF that waits for a 5-minute job to complete burns compute and risks hitting the 120s timeout. Design action UDFs to fire-and-forget, then provide a separate status-check UDF if the agent needs to follow up.
For batch patterns, see Scaling out UDFs.
---
### Pattern C: Unit processing
Some UDFs do fast, bounded work on a single input — convert a CSV to Parquet, clip a raster to a bounding box, enrich a single address. Each call completes well within the time limit, but an agent can fan out many calls in parallel to process an entire dataset.
```python
# convert_to_parquet
@fused.udf
def udf(input_path: str, output_prefix: str, partition_by: str = "region"):
"""
Converts a single CSV file to a partitioned Parquet dataset.
Returns the output path and row count on success.
input_path: S3 or GCS path to the source CSV
output_prefix: S3 or GCS prefix where partitioned parquet will be written
partition_by: column name to partition by (default: "region")
"""
df = pd.read_csv(input_path)
out = f"/.parquet"
df.to_parquet(out, index=False)
return
```
The agent calls this once per file and collects the results. Because each call is independent and fast, many can run in parallel without hitting the 120s limit.
This is different from Pattern B: the agent gets a result it can act on immediately rather than waiting for a background job to complete. Keep each unit small — if a single file takes minutes to process, switch to Pattern B instead.
---
## Name your UDFs explicitly
The function must always be called `udf` — Workbench requires it. Use a comment at the top of the file to give the UDF a descriptive name:
```python title="Always use def udf() — name it with a comment"
# get_county_population
@fused.udf
def udf(state_fips: str = "06"):
...
```
This matters because agents choose tools by name and description. `get_county_population` is immediately useful; leaving the comment blank or vague is not.
## Keep execution fast
Agents call UDFs sequentially — each call blocks the reasoning loop. A UDF that takes 30s means the agent is idle for 30s, and that compounds across every step of a workflow.
**Precompute and read from storage, don't recompute on each call:**
**Cache expensive setup** with `@fused.cache` — model loading, large file reads, and API auth are good candidates.
**Keep the 120s limit in mind.** If a task regularly approaches that ceiling, it's a sign the UDF is doing too much live work. Move computation upstream and have the UDF serve results from storage. For jobs that genuinely need more time, see Pattern B: Action / trigger above.
## Keep I/O small
LLM context windows are narrow. A UDF returning 50,000 rows doesn't just fail to help — it actively degrades the agent by flooding its context.
**Return aggregates and summaries, not raw data:**
```python title="Preferred — return a summary"
# get_top_counties_by_population
@fused.udf
def udf(state: str = "CA", top_n: int = 10):
"""
Returns the top N counties by population for a given state.
Use top_n to control how many results are returned (default: 10).
"""
df = pd.read_parquet("s3://my-bucket/census/raw.parquet")
return (
df[df["state"] == state]
.groupby("county")["population"]
.sum()
.nlargest(top_n)
.reset_index()
)
```
**Add a `limit` or `top_n` parameter** whenever the result size could vary. Agents can pass a smaller value when they only need a quick answer.
**Pass file paths, not file contents.** When an agent needs to send data to a UDF for processing, have it pass an S3 or GCS path — not inline data:
```python
# enrich_address_file
@fused.udf
def udf(input_path: str, output_path: str = ""):
"""
Runs demographic enrichment on a CSV of addresses stored at input_path.
Writes results to output_path and returns a summary of the enrichment.
input_path: S3 or GCS path to a CSV with an 'address' column
output_path: S3 or GCS path where enriched parquet will be written
"""
df = pd.read_csv(input_path)
# ... processing ...
df.to_parquet(output_path)
return
```
The UDF does the heavy lifting internally. The agent only sees the summary. For reading and writing files from cloud storage, see the dedicated guide.
## Design for the question, not the data
The LLM decides which UDF to call based on its docstring. A vague docstring leads to wrong calls; a good one leads to correct ones on the first try.
**Write docstrings that answer: what does this UDF answer, and when should an agent use it?**
```python title="Preferred — clear docstring, descriptive params"
# search_census_demographics
@fused.udf
def udf(search_query: str, year: int = 2023, top_n: int = 5):
"""
Searches census demographic data using a natural language query.
Returns the top N matching counties with population and income data.
Use this when the user asks about population, demographics, or income
for a specific area or region.
Args:
search_query: Plain text search (e.g. "counties near Los Angeles")
year: Census year to query (2020-2023)
top_n: Number of results to return
"""
...
```
**Use descriptive parameter names** (`region_fips`, `start_date`, `metric_name`) — not abbreviations (`r`, `d1`, `m`).
**Provide sensible defaults** so agents can call the UDF without specifying every parameter. A UDF with no defaults forces the agent to guess.
**Harden the surface area.** Agents should only control what they genuinely need to vary. Everything else — table names, file paths, internal SQL structure — should be hardcoded. This prevents both misuse and prompt injection. See Write UDFs securely for full guidance.
## Build for chaining
Agents rarely call a single UDF in isolation. They build pipelines — the output of one call becomes the input of the next. A few patterns make UDFs much easier to chain reliably.
### Accept any readable format as input
If your UDF accepts a `path` parameter, don't hardcode `pd.read_parquet(path)`. Agents may pass CSVs, GeoJSON files, or other formats depending on what a prior step produced. Detect the format and read accordingly:
```python
# analyze_locations
@fused.udf
def udf(path: str, value_col: str = "score"):
"""
Analyzes location data from the file at path.
Accepts Parquet, CSV, or GeoJSON.
"""
if path.endswith(".parquet"):
df = gpd.read_parquet(path)
elif path.endswith((".json", ".geojson")):
df = gpd.read_file(path)
elif path.endswith(".csv"):
df = pd.read_csv(path)
else:
try:
df = gpd.read_parquet(path)
except Exception:
df = gpd.read_file(path)
...
```
A UDF that crashes on CSV input when the agent passes one breaks the whole pipeline. Accept what the agent might reasonably give you.
### Add `output_path` and `save_to_file` parameters
Agents chain UDFs by passing the output of one as the input to another. The cleanest way to do this is via a stable S3 path — not by passing a live UDF URL as input to the next call (which causes the receiver to fetch HTML or GeoJSON and try to parse it as Parquet).
Give every analysis or transformation UDF an `output_path` and `save_to_file` parameter:
```python
# transform_data
@fused.udf
def udf(
path: str,
# ... task-specific params ...
output_path: str = "",
save_to_file: bool = False,
overwrite: bool = False,
):
"""
Transforms the dataset at path.
If save_to_file=true, writes the result to output_path on S3
and returns a status object with the output_path — suitable for chaining.
Otherwise returns the result directly.
"""
gdf = process(path)
if save_to_file and output_path:
if not overwrite and file_exists(output_path):
return []
gdf.to_parquet(output_path)
return []
return gdf
```
When called with `save_to_file=true`, the agent reads the `output_path` from the response and passes it to the next UDF. When called without it, the agent gets the data directly. Both modes work with the same UDF.
### Name output columns explicitly — don't inherit from input
If your UDF aggregates or transforms a column, name the output column after what it _represents_, not where it came from. An aggregated count stored in a column called `latitude` (because that was the `value_col` parameter) will confuse both agents and humans downstream.
```python
# doctest: skip
# ❌ Output column inherits the input column name — "latitude" actually means "count"
gdf = aggregate(df, value_col="latitude", agg="count")
# → columns: ["hex", "latitude", "geometry"]
# ✅ Rename to reflect what the column actually contains
gdf = aggregate(df, value_col="latitude", agg="count")
gdf = gdf.rename(columns=)
# → columns: ["hex", "count", "geometry"]
```
If you want to let callers name the output column, add an `output_col` parameter with a sensible default:
```python
# aggregate_by_hex
@fused.udf
def udf(path: str, value_col: str, agg: str = "count", output_col: str = ""):
result_col = output_col or agg
gdf = ... # aggregate
gdf = gdf.rename(columns=)
return gdf
```
---
## Expose your canvas to agents
### Share via MCP
Click **Share → Copy MCP** in Workbench to get a ready-to-run `claude mcp add` command for your canvas. AI tools (Claude, Cursor, VS Code with MCP extensions) can connect to this endpoint directly and discover your UDFs as callable tools. For a step-by-step walkthrough, see Connecting AI to Data.
**Only visible UDFs are included.** UDFs that are hidden in Workbench are excluded from the MCP endpoint. Use this to keep helper UDFs, internal utilities, or anything you don't want agents to call directly out of the tool list — they'll still run when called by other UDFs, they just won't be surfaced.
[Image: Only visible UDFs appear in OpenAPI]
In the example above, the top canvas exposes all three UDFs to the agent, while the bottom canvas hides the two upstream UDFs and surfaces only the final analysis tool. Hiding intermediate steps keeps the agent's tool list focused on the UDFs that answer questions directly.
### Organize your canvas
All UDFs on a canvas are exposed together through a single canvas token (`fc_XXX`). Group agent-facing UDFs on a dedicated canvas and move large batch jobs or internal utilities to a separate one:
```
Canvas A (agent-facing) Canvas B (internal)
───────────────────────────── ──────────────────────────────
get_county_demographics run_full_etl_pipeline
convert_to_parquet rebuild_vector_index
check_ingestion_status reprocess_historical_data
```
This lets you share the Canvas A token freely — in MCP configs, in documentation, with external agents — without worrying about exposing heavy or destructive operations. See Tokens & endpoints for how to manage canvas access.
### Build visualizations with Widgets
UDFs return data — they're not the right place for charts or maps. For visualizations, use Widgets: JSON UI components that run SQL over UDF output and render as bar charts, line charts, maps, and more. An agent can construct a Widget URL from any UDF on the canvas without modifying the UDF itself.
## Security
Agents execute with the parameters they're given. Treat every agent-supplied parameter as untrusted input:
- Never accept free-form SQL, table names, or file paths as agent-controlled parameters
- Hardcode sensitive connection details — never expose them as params
- Validate and constrain inputs (e.g. an allowlist of valid `metric` values)
See Write UDFs securely for full guidance.
## See also
- Connecting AI to Data — how to connect your canvas to Claude Code via MCP and add an AI chat widget
- Widgets — build charts and maps from UDF output
- Write UDFs securely
- Run UDFs efficiently
- Efficient caching
- Scaling out UDFs
- Cloud storage
- Tokens & endpoints
================================================================================
## Using AI Coding Tools with Fused CLI
Path: guide/working-with-udfs/udf-best-practices/ai-coding-tools.mdx
URL: https://docs.fused.io/guide/working-with-udfs/udf-best-practices/ai-coding-tools
Fused publishes a skills plugin that teaches AI coding tools the Fused-specific formats they need to author canvases and write UDFs. Once installed, the AI understands how to create and modify Fused canvases, call integrations, and use the CLI without you having to explain the format every time.
The plugin covers five skill areas:
| Skill | What it teaches |
|---|---|
| `canvas-toml` | `canvas.toml` format — nodes, edges, viewport, folder layout |
| `fused-cli` | `fused` CLI — push, run, share, and manage UDFs from the terminal |
| `fused-integrations` | Built-in integration helpers — Snowflake, BigQuery, GCS, S3, Airtable, Notion, Google Drive |
| `fused-udfs` | Writing Fused UDFs — structure, parameters, return types, caching, agent-friendly design |
| `json-ui-schemas` | Widget JSON schemas — text inputs, dropdowns, charts, maps, SQL tables |
---
## Fused CLI
Install the `fused` Python package to get the CLI:
```bash
pip install --upgrade fused
```
The CLI covers running UDFs, managing canvases, uploading files, handling secrets and integrations, and more. See the CLI Reference for the full command reference.
---
## Claude Code
Claude Code supports the Fused plugin natively via its plugin marketplace. Once installed, Claude Code automatically applies the Fused skills whenever you work on canvas files.
**Via the `fused` CLI (recommended):**
```bash
fused claude plugin add
```
**Via Claude Code directly:**
```bash
claude plugin marketplace add fusedio/claude-plugins
claude plugin install fused@fused-marketplace
```
To update or remove later:
```bash
claude plugin update fused@fused-marketplace
claude plugin remove fused
```
### Try it out
Once the plugin is installed, ask Claude Code to build a canvas from scratch. Try a prompt like:
```
Make a Hello World canvas with some dummy data and a chart showing the number of rows in the data
```
Claude writes the UDF, wires up a chart widget, and pushes the canvas with the `fused` CLI — no manual setup. The result is some dummy data and a bar chart of the row count per category:
[Image: Hello World canvas with dummy data and a bar chart of row counts by category]
---
## Editing canvases locally with Claude
Once Claude Code is set up, the typical workflow is:
**1. Pull your canvas to a local folder**
```bash
fused canvas pull
```
This downloads the canvas — UDF `.py` files, `canvas.toml`, and widget JSON — into a local directory. Claude Code can then read and edit those files directly.
**2. Ask Claude to make changes**
With the canvas pulled locally, you can ask Claude to modify UDFs, wire new nodes, update widget configs, or restructure the canvas. Claude edits the files in place — no copy-pasting required.
**3. Push changes back to Fused**
```bash
fused canvas push
```
This replaces the remote canvas with your local state. Any UDFs missing from the local folder are removed from the remote canvas.
**4. Review and pull changes in Workbench**
Once you push, Fused Workbench detects that the server has a newer version and shows a prompt:
[Image: Workbench showing newer version on server]
Click **Compare** to review the diff against the current canvas state, or **Later** to dismiss and pull manually. When you're ready, the **Pull server changes** panel lets you pull all UDFs at once or cherry-pick individual ones:
[Image: Pull server changes panel with per-UDF controls]
See Versioning for more on checkpoints, diffs, and restoring previous states.
---
## See also
- Connect an AI agent — step-by-step walkthrough of connecting Claude Code to a canvas
- Building for Agents — expose your canvas as an MCP endpoint for AI agents to query
- Working as a Team — GitHub integration for canvas version control
- Versioning — checkpoints, diffs, and restoring canvas state
================================================================================
## Scaling Out UDFs
Path: guide/working-with-udfs/udf-best-practices/batch-jobs.mdx
URL: https://docs.fused.io/guide/working-with-udfs/udf-best-practices/scaling-out
When realtime isn't enough: run many jobs in parallel, or run on a dedicated machine with more resources.
## Choosing your approach
| Your situation | Use |
|----------------|-----|
| Many inputs (files, dates, regions) | Parallel execution |
| Single job needs >120s or >10GB RAM | Dedicated instance |
| Many heavy jobs | Combining both |
## Parallel execution
Use `.map()` to run a UDF over multiple inputs in parallel, spinning up separate instances for each job.
```python
# doctest: skip
@fused.udf
def my_udf(x: int):
return x ** 2
inputs = [0, 1, 2, 3, 4]
pool = my_udf.map(inputs)
results = pool.df()
```
For the full API reference, see `udf.map()`.
### Start small, then scale
Don't immediately spin up 1000 jobs. Test progressively:
```python
# doctest: skip
# First test with 5 inputs
pool = my_udf.map(inputs[:5])
# Then 10, then 50, then scale up
pool = my_udf.map(inputs[:50])
```
### Target 30-45s per job
Each parallel job has a **120s timeout**. Aim for 30-45s per job to leave safety margin for slower runs.
If your jobs consistently hit the timeout, either:
- Break them into smaller chunks
- Use a dedicated instance type
### Check timing
Monitor how long each job takes with `pool.times()`:
```python
# doctest: skip
pool = my_udf.map(inputs[:5])
pool.wait()
print(pool.times()) # Time per job
```
### Error handling
**By default, errors aren't cached.** If a job fails (e.g., API timeout), it will retry fresh on the next run. See Caching for more on how caching works.
However, if you wrap errors in try/except and return a result, that result gets cached:
```python
@fused.udf
def my_udf(url: str):
try:
return fetch_data(url)
except Exception as e:
return # This gets cached!
```
---
## Dedicated instances
Dedicated instances run on machines with more resources and no time limits. Use them when your UDF needs more than realtime can offer.
### When to use
Use a dedicated instance when your UDF exceeds realtime limits:
- Takes longer than **120s** to run
- Needs more than **~4GB RAM**
**Tradeoffs:**
- ~30s startup time (machine needs to spin up)
- Higher resource availability
### Starting a dedicated instance job
Set `engine` to run on a dedicated machine:
```python
@fused.udf(engine='small')
def my_udf():
# This UDF runs on a dedicated instance
...
```
[Image: Running a job from workbench]
In Workbench, dedicated instance UDFs require manual execution (`Shift+Enter`) and show a confirmation modal.
Dedicated instance and realtime jobs have separate caches. Running the same UDF with different `engine` values will cache results independently.
### Write to disk, don't return data
Dedicated instance jobs should **write results to cloud storage or mount**, not return them. Data returned can be lost if the connection times out.
```python
@fused.udf(engine='small')
def my_udf(input_path: str):
# Process data
df = pd.read_parquet(input_path)
result = heavy_processing(df)
# Write to S3, not return
output_path = f"s3://my-bucket/results/"
result.to_parquet(output_path)
return output_path # Return the path, not the data
```
### Monitor your jobs
Dedicated instance jobs take time to start and run. Use the **Jobs page** in Workbench to monitor:
- **Status**: Running, Completed, Failed
- **CPU & Memory**: Resource usage over time
- **Disk**: Storage consumption
- **Runtime**: How long the job has been running
- **Logs**: Real-time output from your UDF
```python
# doctest: skip
# Programmatic monitoring
job.status # Check status
job.tail_logs() # Stream logs
job.cancel() # Stop a job
```
### Expect startup delay
Dedicated instances take ~30s to spin up. Plan accordingly—they aren't for quick iterations.
Test your UDF on a small data sample using realtime execution. Once you're confident it works, switch to a batch `engine` to scale up.
### Instance types
| Alias | vCPUs | RAM |
|-------|-------|-----|
| `small` | 2 | 2 GB |
| `medium` | 16 | 64 GB |
| `large` | 64 | 512 GB |
See the full list of AWS / GCP instance types
---
## Combining both
If your jobs need more than 120s or ~4GB RAM each, combine parallel execution with dedicated instances:
```python
# doctest: skip
pool = my_udf.map(inputs, engine="large")
pool.wait()
```
---
## Example use cases
- Climate Dashboard — Processing 20TB of data in minutes
- Dark Vessel Detection — Retrieving 30 days of AIS data
- Satellite Imagery — Processing Maxar's Open Data STAC Catalogs
- Ingesting cropland data for zonal statistics
- Data ingestion for large geospatial files
## See also
- Running UDFs — calling UDFs
- Parallel execution — `.map()` details
- `JobPool` API reference — all JobPool methods
- Caching — how caching works
================================================================================
## Cache invalidation
Path: guide/working-with-udfs/udf-best-practices/cache-invalidation.mdx
URL: https://docs.fused.io/guide/working-with-udfs/udf-best-practices/cache-invalidation
Fused caches UDF results automatically (see Efficient caching). When you need to force-refresh cached results — after updating source data, fixing a bug in a UDF, or redeploying a pipeline — you can invalidate the cache programmatically.
## Python SDK
Call `invalidate_cache()` on any saved UDF object to clear its cached results.
### Full cache
```python
@fused.udf
def udf():
parent = fused.load("udf_to_invalidate")
parent.invalidate_cache()
data = parent()
return data
```
### Single tile
For Tile UDFs, you can invalidate the cache for a specific tile instead of the entire UDF. Pass `z`, `x`, and `y` as keyword arguments:
```python
udf = fused.load("udf_to_invalidate")
udf.invalidate_cache(z=15, x=9647, y=12320)
```
All three tile coordinates (`z`, `x`, `y`) must be provided together. You cannot invalidate by zoom level alone.
## HTTP API with service token
You can also invalidate cache via the HTTP API, authenticated with a Fused Service Account. This is useful for CI/CD pipelines, cron jobs, or any automation that runs outside of Fused.
The endpoint is:
```
DELETE https://www.fused.io/server/v1/realtime-shared//udf-cache/by-id//delete
```
Both values can be looked up with the Python SDK:
```python
@fused.udf
def udf():
my_udf = fused.load("udf_to_invalidate")
udf_id = my_udf.metadata["fused:id"]
client_id = fused.options.realtime_client_id
return pd.DataFrame()
```
These values stay stable and can be stored as environment variables. The service account token should be stored securely as a secret.
### Full cache
```python
fused_service_account_token = os.getenv("FUSED_SERVICE_ACCOUNT_TOKEN")
headers = ",
}
response = requests.delete(
f"https://www.fused.io/server/v1/realtime-shared//udf-cache/by-id//delete",
headers=headers,
)
response.raise_for_status()
```
### Single tile
Append `z`, `x`, and `y` as query parameters to scope the purge to one tile:
```python
response = requests.delete(
f"https://www.fused.io/server/v1/realtime-shared//udf-cache/by-id//delete",
headers=headers,
params=,
)
response.raise_for_status()
```
All three query parameters (`z`, `x`, `y`) must be provided together. The server returns `422 Unprocessable Entity` if only some are present.
## See also
- Efficient caching — how caching works, `cache_max_age`, and common gotchas
- Securing Shared Tokens — creating service accounts and session tokens
- `Udf` API reference — full SDK details
================================================================================
## Efficient caching
Path: guide/working-with-udfs/udf-best-practices/caching.mdx
URL: https://docs.fused.io/guide/working-with-udfs/udf-best-practices/caching
[Image: Efficient Caching diagram]
Fused caches UDF results automatically to make repeated calls faster. Cached calls return instantly and **don't consume Fused Credit Units**—you only pay for compute once, then reuse the result for free.
## Two types of cache
| Type | When it applies | Storage | Default Duration | Speed |
|------|-----------------|---------|-------------|-------|
| UDF cache | UDF call results | S3 | 14 days | Good |
| `@fused.cache` | Functions inside UDFs | mount | 48 hours | Fast |
Both work the same way: store the result of [function + inputs], return cached result on repeat calls. Change the function or inputs → cache miss → recompute.
## UDF cache
Every UDF call is cached automatically. No configuration needed.
The UDF cache is hosted in `us-west-2`. If your users are outside the US, expect a small amount of added latency (~1–2s) for cached responses due to the geographic round trip.
```python
# doctest: skip
my_udf() # First call: runs UDF
my_udf() # Second call: returns cached result
```
**Disable caching** when you need fresh results:
```python
@fused.udf(cache_max_age=0)
def my_udf():
...
# Or at call time
my_udf(cache_max_age=0)
# or
my_udf(cache=False)
```
## @fused.cache
Use `@fused.cache` for expensive operations *inside* a UDF—loading slow file formats, heavy computations that repeat across runs.
```python
@fused.udf
def udf(ship_length: int = 100):
@fused.cache
def load_data(path):
return pd.read_csv(path) # Slow format, cache it
df = load_data("s3://bucket/large_file.csv")
return df[df.Length > ship_length]
```
The CSV loads once and caches. Changing `ship_length` doesn't reload the file—only changing the `path` would.
**When to use it:**
- Loading CSV, Shapefile, or other slow formats
- Expensive computations that don't depend on all UDF parameters
- API calls you don't want to repeat
**When NOT to use it:**
- Very large datasets (>10GB)—consider ingesting to cloud-native formats instead
## `cache_max_age` reference
Control how long cached results stay valid.
**Format:** `30s` (seconds), `10m` (minutes), `24h` (hours), `7d` (days)
**Where you can set it:**
| Context | Example |
|---------|---------|
| UDF definition | `@fused.udf(cache_max_age="24h")` |
| Direct call | `my_udf(cache_max_age="1h")` |
| @fused.cache | `@fused.cache(cache_max_age="30m")` |
| HTTPS endpoint | `udf.fused.io/token.json?cache_max_age=0` |
The endpoint accepts **seconds as a number** (e.g. `cache_max_age=10`). Python accepts human-readable formats like `10s`, `10m`, `24h`.
**Priority:** Call-time param > `@fused.udf()` > default (90 days)
## Common gotchas
### Parent/child UDF changes
When calling one UDF from another, the child won't automatically refresh when the parent changes:
```python
@fused.udf
def child_udf():
parent = fused.load("parent_udf")
data = parent() # Won't re-fetch if parent changes
return data
```
Fix: disable cache on the child so it always calls the parent:
```python
@fused.udf(cache_max_age=0)
def child_udf():
parent = fused.load("parent_udf")
data = parent() # Always gets latest from parent
return data
```
### Invalidate cache
You can invalidate the UDF cache programmatically — including purging specific tiles. See Cache invalidation for details.
### @fused.cache is shared across UDFs
If two UDFs define the same cached function — identical source code, called with the same arguments — the second will reuse the cached result from the first instead of recomputing. This is because the cache key is based on function source code and call arguments, not on which UDF the function belongs to. Here's an example:
**UDF 1**
```python
@fused.udf
def udf():
@fused.cache
def cached_sleep(): # identical source → same cache key
time.sleep(5)
cached_sleep() # populates the cache on first run
return pd.DataFrame()
```
**UDF 2**
```python
@fused.udf
def udf(name: str = "world"):
@fused.cache
def cached_sleep(): # identical source → hits UDF 1's cache entry
time.sleep(5)
cached_sleep() # returns instantly if UDF 1 ran first
return pd.DataFrame()
```
Any change to function source — a comment, print statement, or different call arguments — produces a different hash and causes a cache miss.
To avoid accidental cache sharing, use distinct function names:
```python
@fused.cache
def cached_sleep_udf1():
...
@fused.cache
def cached_sleep_udf2():
...
```
### Realtime vs dedicated instance have separate caches
```python
# doctest: skip
my_udf() # realtime cache
my_udf(engine="small") # different cache (dedicated instance)
```
### Caching with `bounds` in Tile UDFs
When using Tile UDFs, panning the map triggers new UDF calls with different `bounds`. If you cache a function that takes `bounds` as input, each tile creates a separate cache entry.
**This can be useful:** Pan back to a previously viewed area and the cached tiles load instantly.
**Watch out for:** If you're iterating on code, you may accumulate many cache entries. Consider what actually needs to vary with `bounds`:
```python
# Caches per tile - good for expensive tile-specific operations
@fused.cache
def process_tile(bounds):
...
# Caches once - better when data doesn't depend on bounds
@fused.cache
def load_data(path):
return gpd.read_file(path)
gdf = load_data(path)
return gdf[gdf.geometry.intersects(bounds_geom)] # Filter after
```
## Monitor your cache usage
See how much caching is saving you in the **Profile** page in Workbench. The usage dashboard shows cache hits vs actual compute across different time ranges.
[Image: Cache usage in Account page]
## See also
- Cache invalidation — purge cached results via Python or the HTTP API
- Data ingestion — for large datasets, ingest to Parquet/GeoParquet instead of caching
- Running UDFs — calling UDFs
- `Udf` API reference — full API details
================================================================================
## Debugging playbook
Path: guide/working-with-udfs/udf-best-practices/debugging-playbook.mdx
URL: https://docs.fused.io/guide/working-with-udfs/udf-best-practices/debugging-playbook
Practical techniques for diagnosing and fixing UDFs — from slow code to failed parallel jobs.
## Use the inline profiler
Workbench includes a built-in line-by-line profiler. After a run, each line shows its execution time and hit count — no instrumentation needed.
[Image: Workbench inline profiler showing per-line timing]
Things to look for:
- A slow I/O call dominating total runtime
- A loop body running far more times than expected
- A `@fused.cache` function showing a cache miss on every run
## print intermediate results
`print()` output appears directly in the Workbench results panel. Drop prints wherever you need to track what's happening:
```python
# doctest: skip
print(f"task_id= got value=")
```
Anything you `print()` is visible to anyone calling your UDF — don't print secrets, credentials, or environment variables. See Write UDFs securely for guidance.
## Bust the cache
Cached results can mask bugs — a fix won't appear until the cache is invalidated. There are two independent caches:
| Cache | Cleared by |
|-------|-----------|
| UDF cache | `cache=False` at call time, or `cache_max_age="0s"` on the UDF |
| Workbench cache | **Clear cache** button in the Workbench toolbar |
**Clear cache** only clears the Workbench-level cache. Calls via the HTTP endpoint use a separate cache. See Each execution context has its own cache.
Disable the UDF cache at call time:
```python
# doctest: skip
pool = flaky_task.map(task_ids, cache=False)
```
Or permanently during development:
```python
@fused.udf(cache_max_age="0s")
def udf(): ...
```
Force-reset a `@fused.cache` function:
```python
@fused.cache(cache_reset=True)
def load_data(path): ...
```
## Debug parallel runs
`udf.map()` returns a `JobPool`. If any jobs fail, calling `.df()` will raise — use the pool's inspection API instead to understand what happened across all jobs.
The examples below use `flaky_task` — a UDF that sleeps 2s and raises a `ValueError` on ~50% of runs. Try it out →
```python
@fused.udf(cache_max_age="0s")
def udf(task_id: int = 0):
time.sleep(2)
value = int(np.random.default_rng().integers(0, 10))
if value % 2 == 0:
raise ValueError(f"task_id= failed! Got even number: ")
return pd.DataFrame()
```
### Start small
Before scaling to hundreds of inputs, test with 2–3 first. Change `n_tasks` directly in Workbench — once it works at small scale, increase it:
```python
flaky_task = fused.load("flaky_task")
pool = flaky_task.map(list(range(n_tasks)), cache=False) # try n_tasks=2 first
pool.wait()
```
Now use the pool to inspect what happened.
### Check overall status
`pool.status()` returns a count of outcomes. `all_succeeded()` and `any_failed()` give quick boolean checks:
```python
# doctest: skip
pool.status()
# status
# success 5
# error 1
# Name: count, dtype: int64
pool.all_succeeded() # False
pool.any_failed() # True
```
### Inspecting errors
`first_error()` gives you the first failure with full detail — the fastest way to triage. `errors()` returns the list of all failures:
```python
# doctest: skip
pool.first_error()
# Run #3
#
# The UDF returned the following error in line 22:
# ValueError: task_id=3 failed! Got even number: 8
pool.errors()
# [UdfRuntimeError: Run #3 ...]
```
### Check per-job timing
`times()` returns per-job durations — useful for spotting outliers or hung jobs:
```python
# doctest: skip
pool.times()
# [timedelta(seconds=2, microseconds=565825),
# timedelta(seconds=2, microseconds=580730),
# timedelta(seconds=4, microseconds=352142),
# timedelta(seconds=2, microseconds=507098),
# timedelta(seconds=2, microseconds=561703),
# timedelta(seconds=9, microseconds=824293)]
```
### Inspect every result
`results(return_exceptions=True)` returns one entry per job — a DataFrame on success, an exception on failure:
```python
# doctest: skip
mixed = pool.results(return_exceptions=True)
# task 0: DataFrame shape=(1, 3)
# task 1: DataFrame shape=(1, 3)
# task 2: DataFrame shape=(1, 3)
# task 3: UdfRuntimeError: task_id=3 failed! Got even number: 8
# task 4: DataFrame shape=(1, 3)
# task 5: DataFrame shape=(1, 3)
```
It works in three steps:
- **Connect**: Crawl any docs site via its sitemap, parallelize fetching and cleaning all pages into a single `llms.txt` file saved to S3.
- **Process**: Fetch the file, split into overlapping chunks, embed with an off-the-shelf LLM, write vector embeddings to a LanceDB table.
- **Expose**: A `vector_search` UDF takes a natural language question, embeds it, runs a cosine similarity lookup, and returns the top 4 most relevant chunks, cached for 1 hour.
The result: any AI agent (or Slack bot) can query your docs with a single request:
```
https://udf.ai/fc_YOUR_SHARED_TOKEN/vector_search.json?question=what is fused?
```
All on S3, simple Python, smart caching, and parallel processing, no additional setup. See the full example in the docs.
---
## Get started
- ⚡️ Quickstart Guide: Write your first UDF in minutes
- 💻 Writing UDFs: Learn UDF structure and best practices
- 🍿 Getting Started With Fused: 1–4 min videos to get you up and running
================================================================================
## UDFs as API
Path: guide/working-with-udfs/run-udfs-as-api.mdx
URL: https://docs.fused.io/guide/working-with-udfs/run-udfs-as-api
# UDFs as API
Every UDF can be used as a file system.
[Image: UDF API URL structure: domain, canvas token, UDF name, extension, query params]
Share your canvas to get a canvas token (`fc_***`); then call any UDF by name.
## Output formats
UDFs can return data in various formats via the `format` query parameter:
### Vector data formats
| Format | Extension | Description |
|--------|-----------|-------------|
| `parquet` | `.parquet` | Efficient columnar storage format |
| `geojson` | `.geojson` | Standard GeoJSON format |
| `json` | `.json` | JSON objects and GeoJSON |
| `csv` | `.csv` | Comma-separated values |
| `mvt` | `.mvt` | Mapbox Vector Tiles |
| `feather` | `.feather` | Apache Arrow IPC format |
| `excel` | `.xlsx` | Excel spreadsheet |
| `xml` | `.xml` | XML data |
| `html` | `.html` | HTML document |
### Raster data formats
| Format | Extension | Description |
|--------|-----------|-------------|
| `png` | `.png` | Lossless raster images |
| `jpeg` | `.jpeg` / `.jpg` | Compressed raster images |
| `gif` | `.gif` | Animated or static images |
| `webp` | `.webp` | Modern efficient image format |
| `apng` | `.apng` | Animated PNG images |
| `svg` | `.svg` | Scalable vector graphics |
| `tiff` | `.tiff` / `.tif` | GeoTIFF and TIFF rasters |
| `npy` | `.npy` | NumPy array binary format |
## Example usage
Use your canvas token and UDF name (from sharing your canvas):
### Returning as JSON
```bash
https://udf.ai/fc_/my_udf.json
```
### Returning as CSV
```bash
https://udf.ai/fc_/my_udf.csv
```
### Returning as HTML
```bash
https://udf.ai/fc_/my_udf.html
```
## Tile endpoints
For map tile servers, use the `tiles` path with `//` template:
### Vector tiles (MVT)
```bash
https://udf.ai/fc_/my_udf/run/tiles///?=mvt
```
When consuming Fused MVT tiles in tools that require a `source-layer` name (like Mapbox GL JS, MapLibre, or react-map-gl), the layer is always named `udf`.
### Raster tiles (PNG)
```bash
https://udf.ai/fc_/my_udf/run/tiles///?=png
```
## Integrations
These dynamic endpoints work with:
- DeckGL - Interactive maps
- Mapbox - Web maps
- QGIS - Desktop GIS
- Felt - Collaborative mapping
- Google Sheets - Spreadsheet import
If you rename a UDF in Workbench, the API URL changes — the old URL (with the previous name) will no longer work. Update any clients or bookmarks that call the UDF by URL.
================================================================================
## Parallel execution
Path: guide/working-with-udfs/run-udfs-in-parallel.mdx
URL: https://docs.fused.io/guide/working-with-udfs/fused-submit
Run a UDF over multiple inputs in parallel.
## Using `.map()`
Call `.map()` on a UDF to run it over multiple inputs in parallel:
```python
# doctest: skip
my_udf.map(
arg_list, # list of arguments, each element becomes a job
*,
engine=None, # "remote" (default), "local", or instance type
cache_max_age=None, # max cache age
max_workers=None, # max parallel workers (default 32)
worker_concurrency=None, # concurrency per worker (default 1)
cache=True, # set False to disable caching
max_retry=2, # max retries for failed jobs
) -> JobPool
```
See the `Udf.map()` API reference for full details.
## Basic example
```python
@fused.udf
def udf():
# Create a pool of jobs
pool = my_udf.map([1, 2, 3, 4, 5])
# Wait and collect results as DataFrame
df = pool.df()
return df
@fused.udf
def my_udf(x: int):
return x ** 2
```
## Input formats
| Format | Example | Use case |
|--------|---------|----------|
| List | `[0, 1, 2, 3]` | Single parameter |
| List of dicts | `[, ]` | Multiple parameters |
Each item becomes a separate job.
```python
@fused.udf
def udf():
# Create a pool of jobs
pool = my_udf.map([, ])
df = pool.df()
return df
@fused.udf
def my_udf(a: int, b: int):
return a + b
```
### Passing multiple arguments
You can also pass multiple arguments as a list of dictionaries:
```python
@fused.udf
def udf():
arg_list = [
,
,
,
]
pool = my_udf.map(arg_list)
return pool.df()
@fused.udf
def my_udf(a: int, b: int):
return a + b
```
Each dict is one job, so this runs `(1,2)`, `(3,4)`, `(5,6)`.
`pool.df()` returns:
| a | b | result |
|---|---|--------|
| 1 | 2 | 3 |
| 3 | 4 | 7 |
| 5 | 6 | 11 |
If your values are already split across separate lists, `zip` is a compact alternative:
```python
# doctest: skip
arg_list = [ for a, b in zip(a_values, b_values)]
```
You can also pass a pandas DataFrame where each row is one job:
```python
@fused.udf
def udf():
arg_list = pd.DataFrame()
pool = my_udf.map(arg_list)
return pool.df()
@fused.udf
def my_udf(a: int, b: int):
return a + b
```
This returns the same `pool.df()` output shown above.
For single-parameter UDFs, this also works with an `input` column:
```python
@fused.udf
def udf():
arg_list = pd.DataFrame()
pool = my_udf.map(arg_list)
return pool.df()
@fused.udf
def my_udf(input: int):
return input ** 2
```
## Parameters
### `engine`
Same as running UDFs. Default: `"remote"`
| Mode | Best for |
|------|----------|
| `"remote"` (default) | Many quick jobs |
| `"small"`/`"medium"`/`"large"` | Long/heavy jobs |
### `max_workers`
Number of instances to spin up in parallel. Default: `32`, Max: `1000`.
```python
# doctest: skip
# Spin up 100 instances in parallel
pool = my_udf.map(inputs, max_workers=100)
```
### `max_retry`
Max retries per failed job. Default: `2`
### `cache_max_age`
Same as running UDFs.
### `worker_concurrency`
Number of arguments to pass to the UDF per instance. Default: `1`.
```python
@fused.udf
def udf():
# Running 10 jobs in parallel but with 4 jobs per UDF instance
pool = my_udf.map(range(10), worker_concurrency=4)
df = pool.df()
return df
@fused.udf
def my_udf(x: int):
return x ** 2
```
## Working with results
`.map()` returns a `JobPool` object:
```python
# doctest: skip
pool = my_udf.map(inputs)
pool.wait() # Show progress bar
pool.total_time() # Total wall time
pool.times() # Time per job
pool.first_error() # First error encountered
pool.df() # Get results as DataFrame
pool.results() # Get results as list
```
See the `JobPool` API reference for full details.
## See also
- Running UDFs — single UDF execution
- Scaling out UDFs — best practices
- `JobPool` API reference — all JobPool methods
---
## [Legacy]: `fused.submit()`
The `fused.submit()` function still works but `.map()` is preferred:
```python
# Legacy
results = fused.submit(my_udf, inputs)
# Preferred
pool = my_udf.map(inputs)
results = pool.df()
```
================================================================================
## Running UDFs
Path: guide/working-with-udfs/run-udfs-in-python.mdx
URL: https://docs.fused.io/guide/working-with-udfs/fused-run
Run a UDF and get results back.
## Calling a UDF
UDFs are callable objects—call them directly like regular Python functions:
```python
# doctest: skip
my_udf(
*args, # positional arguments
engine=None, # "remote" (default), "local", or instance type
cache_max_age=None, # max cache age, e.g. "48h", "10s"
cache=True, # set False to disable caching
**kwargs, # keyword arguments
)
```
See the `Udf` API reference for full details.
## Loading a UDF
Use `fused.load()` to get a UDF object, then call it directly:
| Method | Syntax | Use case |
|--------|--------|----------|
| Your UDF | `fused.load("my_udf")` | Load a saved UDF by name |
| Team UDF | `fused.load("team/my_udf")` | Shared team UDFs |
| Public UDF | `fused.load("UDF_Name")` | Public UDFs (free) |
| Token | `fused.load("fsh_***")` | Legacy per-UDF token; still supported. Share UDF without exposing code |
| Git commit | `fused.load("github.com/.../tree//")` | Production stability |
Legacy `fsh_` tokens remain supported in the Python SDK; for new sharing, use canvas tokens (`fc_/`).
```python
# Load and call
my_udf = fused.load("my_udf")
result = my_udf(name="hello")
```
```python
commit_hash = "bdfb4d0"
my_udf = fused.load(f"https://github.com/fusedio/udfs/tree//public/My_UDF/")
result = my_udf()
```
Avoid pointing to `main` branch—your UDF will change when others push to it.
## Parameters
### `engine`
Controls where your UDF runs:
| Value | Where it runs | RAM | Time limit |
|-------|---------------|-----|------------|
| `"remote"` / `"realtime"` (default) | Serverless instance | ~10GB | 120s |
| `"local"` | Current process | — | — |
| `"small"` | Dedicated machine | 2 GB | None |
| `"medium"` | Dedicated machine | 64 GB | None |
| `"large"` | Dedicated machine | 512 GB | None |
| AWS/GCP type (e.g. `"m5.4xlarge"`) | Dedicated machine | Varies | None |
```python
# doctest: skip
result = my_udf(engine="medium") # 64 GB RAM, no time limit
```
**`local` contexts:**
| Context | What happens |
|---------|--------------|
| Inside a UDF | Shares that UDF's compute (120s, ~10GB) |
| Inside a batch job | Shares the batch instance resources |
| On your laptop | Runs on local machine |
Set a default engine when defining a UDF:
```python
@fused.udf(engine="large")
def my_udf():
...
```
In Workbench, UDFs with a batch engine will prompt for confirmation before running.
| Instance Type | vCPUs | Memory (GB) |
|---------------|-------|-------------|
| `t3.small` | 2 | 2 |
| `t3.medium` | 2 | 4 |
| `t3.large` | 2 | 8 |
| `t3.xlarge` | 4 | 16 |
| `t3.2xlarge` | 8 | 32 |
| `m5.large` | 2 | 8 |
| `m5.xlarge` | 4 | 16 |
| `m5.2xlarge` | 8 | 32 |
| `m5.4xlarge` | 16 | 64 |
| `m5.8xlarge` | 32 | 128 |
| `m5.12xlarge` | 48 | 192 |
| `m5.16xlarge` | 64 | 256 |
| `r5.large` | 2 | 16 |
| `r5.xlarge` | 4 | 32 |
| `r5.2xlarge` | 8 | 64 |
| `r5.4xlarge` | 16 | 128 |
| `r5.8xlarge` | 32 | 256 |
| `r5.12xlarge` | 48 | 384 |
| `r5.16xlarge` | 64 | 512 |
| Instance Type | vCPUs | Memory (GB) |
|---------------|-------|-------------|
| `c2-standard-4` | 4 | 16 |
| `c2-standard-8` | 8 | 32 |
| `c2-standard-16` | 16 | 64 |
| `c2-standard-30` | 30 | 120 |
| `c2-standard-60` | 60 | 240 |
| `m3-ultramem-32` | 32 | 976 |
| `m3-ultramem-64` | 64 | 1,952 |
### `cache_max_age`
Control how long results are cached. UDFs are cached for **14 days by default**.
| Value | Meaning |
|-------|---------|
| `None` (default) | Follow `@fused.udf()` setting (14 days) |
| `"0s"` | No caching |
| `"10s"`, `"48h"`, `"1d"` | Cache for specified duration |
```python
result = my_udf(cache_max_age="1h") # Cache for 1 hour
result = my_udf(cache=False) # Disable caching
```
Set a default cache duration in the UDF decorator:
```python
@fused.udf(cache_max_age="1d")
def my_udf():
...
```
Learn more about caching.
## Passing arguments
Pass UDF parameters as keyword arguments:
```python
@fused.udf
def my_udf(name: str, count: int = 1):
return pd.DataFrame()
result = my_udf(name="hello", count=3)
```
## Reserved parameters
These parameters control how Fused structures the `bounds` object for tile UDFs.
### With `x`, `y`, `z`
```python
overture_udf = fused.load("UDF_Overture_Maps_Example")
result = overture_udf(x=5241, y=12662, z=15)
```
### With `bounds` as GeoDataFrame
```python
# doctest: skip
bounds = gpd.GeoDataFrame.from_features()
result = overture_udf(bounds=bounds)
```
### With `bounds` as bbox list
```python
# doctest: skip
# [min_x, min_y, max_x, max_y]
result = overture_udf(bounds=[-122.349, 37.781, -122.341, 37.818])
```
## See also
- Run UDFs efficiently — best practices
- Parallel execution — run over multiple inputs
- Caching — how caching works
- `Udf` API reference — full API details
---
## [Legacy]: `fused.run()`
The `fused.run()` function still works but direct UDF calling is preferred:
```python
# Legacy
result = fused.run(my_udf, name="hello")
# Preferred
my_udf = fused.load("udf_name_here")
result = my_udf(name="hello")
```
================================================================================
## Scheduling UDFs
Path: guide/working-with-udfs/scheduling-udfs.mdx
URL: https://docs.fused.io/guide/working-with-udfs/scheduling-udfs
Schedule UDFs to run automatically on a recurring cron schedule. Scheduled UDFs execute on batch compute instances with no time limit, making them suitable for data pipelines, periodic refreshes, and automated workflows.
- Cronjobs can be scheduled at any combination of minute, hour, day of month, month, or day of week.
- Cronjobs can only be scheduled **once per hour**.
- Cronjobs run on **batch compute instances** with no execution time limit.
- There is a **1:1 relationship** between a UDF and a cronjob — the same UDF cannot have multiple schedules.
- A Fused developer or enterprise account is required to schedule UDFs.
## Creating a schedule
### With `fused.api.schedule_udf()`
Use `fused.api.schedule_udf()` to schedule any UDF by name or object:
```python
@fused.udf
def udf():
job = fused.api.schedule_udf(
udf=fused.load("my_etl_pipeline"),
minute=0,
hour=8,
udf_args=,
enabled=True,
)
print(job)
#
```
### Cron field reference
| Field | Parameter | Range | Default |
|-------|-----------|-------|---------|
| Minute | `minute` | 0–59 | *required* |
| Hour | `hour` | 0–23 | *required* |
| Day of month | `day_of_month` | 1–31 | Every day |
| Month | `month` | 1–12 | Every month |
| Day of week | `day_of_week` | 0–6 (0 = Sunday) | Every day |
Pass a single `int` for a specific value, or a `list[int]` for multiple values:
```python
@fused.udf
def udf():
# Run every day at 4:59 AM
fused.api.schedule_udf(udf="my_udf", minute=59, hour=4)
# Run at midnight on the 1st and 15th of every month
fused.api.schedule_udf(udf="my_udf", minute=0, hour=0, day_of_month=[1, 15])
# Run every Monday (1) and Friday (5) at noon
fused.api.schedule_udf(udf="my_udf", minute=0, hour=12, day_of_week=[1, 5])
```
## Passing arguments
Use `udf_args` to pass parameters to the scheduled UDF. These are forwarded as keyword arguments each time the job runs:
```python
@fused.udf
def udf():
fused.api.schedule_udf(
udf=fused.load("job_to_run"),
minute=59,
hour=4,
udf_args=,
enabled=True,
)
```
The target UDF receives them as typed parameters:
```python
@fused.udf(cache_max_age="0s")
def udf(message: str = "hello from cron!"):
print(message)
return pd.DataFrame()
```
## Listing schedules
Use `fused.api.schedule_list()` to retrieve all scheduled jobs for your team:
```python
@fused.udf
def udf():
jobs = fused.api.schedule_list()
print(f"Total jobs: ")
for job in jobs:
print(f" — — enabled=")
```
To inspect schedules as a DataFrame:
```python
@fused.udf(cache_max_age="0s")
def udf():
jobs = fused.api.schedule_list()
rows = []
for job in jobs:
row = job.model_dump()
rows.append()
return pd.DataFrame(rows)
```
You can also check a specific UDF's schedule with `udf.get_schedule()`:
```python
@fused.udf
def udf():
my_udf = fused.load("my_etl_pipeline")
schedules = my_udf.get_schedule()
print(schedules)
```
## Updating a schedule
Calling `fused.api.schedule_udf()` (or `udf.schedule()`) with a UDF that already has a schedule will **update the existing schedule** rather than creating a duplicate. This makes schedule creation idempotent:
```python
@fused.udf
def udf():
# Initially schedule at 8 AM
fused.api.schedule_udf(udf="my_udf", minute=0, hour=8)
# Change to 6 AM — updates the same cronjob
fused.api.schedule_udf(udf="my_udf", minute=0, hour=6)
```
To disable a schedule without deleting it, set `enabled=False`:
```python
@fused.udf
def udf():
fused.api.schedule_udf(udf="my_udf", minute=0, hour=8, enabled=False)
```
## Triggering a run manually
Use `run_now()` on a `CronJob` to trigger an immediate execution outside of the regular schedule:
```python
@fused.udf
def udf():
jobs = fused.api.schedule_list()
for job in jobs:
if job.name == "my_etl_pipeline":
result = job.run_now()
print(result)
break
```
## Deleting a schedule
Call `.delete()` on a `CronJob` to permanently remove it:
```python
@fused.udf
def udf(name: str = "my_etl_pipeline"):
jobs = fused.api.schedule_list()
for job in jobs:
if job.name == name:
job.delete()
print(f"Deleted job: ")
break
```
## Example: scheduled data pipeline
A complete example that fetches data and writes results to cloud storage, scheduled to run daily:
```python
@fused.udf(cache_max_age="0s")
def daily_weather_sync(city: str = "San Francisco"):
from datetime import datetime
response = requests.get(
f"https://api.open-meteo.com/v1/forecast?latitude=37.77&longitude=-122.42¤t_weather=true"
)
data = response.json()["current_weather"]
df = pd.DataFrame([])
path = f"fd://weather//.parquet"
df.to_parquet(path)
print(f"Wrote rows to ")
return df
```
Schedule it to run every day at 6:00 AM:
```python
@fused.udf
def udf():
job = fused.api.schedule_udf(
udf=fused.load("daily_weather_sync"),
minute=0,
hour=6,
udf_args=,
)
print(job)
#
```
Monitor execution results in the Job logs page.
## API reference
| Function | Description |
|----------|-------------|
| `fused.api.schedule_udf()` | Schedule a UDF on a cron schedule |
| `fused.api.schedule_list()` | List all scheduled jobs |
| `udf.schedule()` | Schedule a UDF (instance method) |
| `udf.get_schedule()` | Get existing schedules for a UDF |
================================================================================
## Building UDFs for Agents
Path: guide/working-with-udfs/udf-best-practices/agents.mdx
URL: https://docs.fused.io/guide/working-with-udfs/udf-best-practices/agents
Fused gives you a uniquely fast path from data to agent tool. Write a Python function that joins datasets from any source — FTP servers, one-time CSV downloads, internal APIs, legacy databases, files someone emailed you — do any processing you need, and click **Share → Open API** to instantly expose it as an MCP server. No infrastructure, no deployment, no waiting.
An agent calls a UDF the same way any HTTP client does:
```
GET https://udf.ai/fc_TOKEN/get_county_demographics.json?county_fips=06037
```
```json
```
The key to making this work well is keeping UDFs focused: return small, structured results rather than raw datasets. Agents work best when each tool call gives them a precise answer, not a table they have to reason over. UDFs also have a 120s execution limit — another reason to precompute and serve summaries rather than doing heavy work at call time. This guide covers how to design UDFs that agents can discover, call, and chain reliably.
## Three patterns for agent UDFs
### Pattern A: Data query
The most common pattern. The agent calls the UDF to answer a factual question and uses the response to reason further.
- Returns a small dict or DataFrame (< ~20 rows)
- Field names are self-explanatory
- Call via `.json` endpoint
```python
# get_county_demographics
@fused.udf
def udf(county_fips: str = "06037", year: int = 2023):
"""
Returns population and median income for a specific US county.
Use when the user asks about demographics for a named county.
"""
...
return
```
Agent call: `GET /fc_TOKEN/get_county_demographics.json?county_fips=06037`
---
### Pattern B: Action / trigger
The UDF kicks off a long-running job (ingestion, report generation, batch processing) and returns immediately with a job reference. The agent doesn't wait for completion.
```python
# trigger_census_ingestion
@fused.udf
def udf(dataset: str = "census_2023", region: str = "CA"):
"""
Triggers a batch ingestion job for the specified dataset and region.
Returns immediately with a job ID. Use the job ID with the
check_ingestion_status UDF to monitor progress.
Do NOT use this to fetch data — use get_county_demographics instead.
"""
job_id = str(uuid.uuid4())
enqueue_batch_job(dataset=dataset, region=region, job_id=job_id)
return / ",
}
```
A synchronous UDF that waits for a 5-minute job to complete burns compute and risks hitting the 120s timeout. Design action UDFs to fire-and-forget, then provide a separate status-check UDF if the agent needs to follow up.
For batch patterns, see Scaling out UDFs.
---
### Pattern C: Unit processing
Some UDFs do fast, bounded work on a single input — convert a CSV to Parquet, clip a raster to a bounding box, enrich a single address. Each call completes well within the time limit, but an agent can fan out many calls in parallel to process an entire dataset.
```python
# convert_to_parquet
@fused.udf
def udf(input_path: str, output_prefix: str, partition_by: str = "region"):
"""
Converts a single CSV file to a partitioned Parquet dataset.
Returns the output path and row count on success.
input_path: S3 or GCS path to the source CSV
output_prefix: S3 or GCS prefix where partitioned parquet will be written
partition_by: column name to partition by (default: "region")
"""
df = pd.read_csv(input_path)
out = f"/.parquet"
df.to_parquet(out, index=False)
return
```
The agent calls this once per file and collects the results. Because each call is independent and fast, many can run in parallel without hitting the 120s limit.
This is different from Pattern B: the agent gets a result it can act on immediately rather than waiting for a background job to complete. Keep each unit small — if a single file takes minutes to process, switch to Pattern B instead.
---
## Name your UDFs explicitly
The function must always be called `udf` — Workbench requires it. Use a comment at the top of the file to give the UDF a descriptive name:
```python title="Always use def udf() — name it with a comment"
# get_county_population
@fused.udf
def udf(state_fips: str = "06"):
...
```
This matters because agents choose tools by name and description. `get_county_population` is immediately useful; leaving the comment blank or vague is not.
## Keep execution fast
Agents call UDFs sequentially — each call blocks the reasoning loop. A UDF that takes 30s means the agent is idle for 30s, and that compounds across every step of a workflow.
**Precompute and read from storage, don't recompute on each call:**
**Cache expensive setup** with `@fused.cache` — model loading, large file reads, and API auth are good candidates.
**Keep the 120s limit in mind.** If a task regularly approaches that ceiling, it's a sign the UDF is doing too much live work. Move computation upstream and have the UDF serve results from storage. For jobs that genuinely need more time, see Pattern B: Action / trigger above.
## Keep I/O small
LLM context windows are narrow. A UDF returning 50,000 rows doesn't just fail to help — it actively degrades the agent by flooding its context.
**Return aggregates and summaries, not raw data:**
```python title="Preferred — return a summary"
# get_top_counties_by_population
@fused.udf
def udf(state: str = "CA", top_n: int = 10):
"""
Returns the top N counties by population for a given state.
Use top_n to control how many results are returned (default: 10).
"""
df = pd.read_parquet("s3://my-bucket/census/raw.parquet")
return (
df[df["state"] == state]
.groupby("county")["population"]
.sum()
.nlargest(top_n)
.reset_index()
)
```
**Add a `limit` or `top_n` parameter** whenever the result size could vary. Agents can pass a smaller value when they only need a quick answer.
**Pass file paths, not file contents.** When an agent needs to send data to a UDF for processing, have it pass an S3 or GCS path — not inline data:
```python
# enrich_address_file
@fused.udf
def udf(input_path: str, output_path: str = ""):
"""
Runs demographic enrichment on a CSV of addresses stored at input_path.
Writes results to output_path and returns a summary of the enrichment.
input_path: S3 or GCS path to a CSV with an 'address' column
output_path: S3 or GCS path where enriched parquet will be written
"""
df = pd.read_csv(input_path)
# ... processing ...
df.to_parquet(output_path)
return
```
The UDF does the heavy lifting internally. The agent only sees the summary. For reading and writing files from cloud storage, see the dedicated guide.
## Design for the question, not the data
The LLM decides which UDF to call based on its docstring. A vague docstring leads to wrong calls; a good one leads to correct ones on the first try.
**Write docstrings that answer: what does this UDF answer, and when should an agent use it?**
```python title="Preferred — clear docstring, descriptive params"
# search_census_demographics
@fused.udf
def udf(search_query: str, year: int = 2023, top_n: int = 5):
"""
Searches census demographic data using a natural language query.
Returns the top N matching counties with population and income data.
Use this when the user asks about population, demographics, or income
for a specific area or region.
Args:
search_query: Plain text search (e.g. "counties near Los Angeles")
year: Census year to query (2020-2023)
top_n: Number of results to return
"""
...
```
**Use descriptive parameter names** (`region_fips`, `start_date`, `metric_name`) — not abbreviations (`r`, `d1`, `m`).
**Provide sensible defaults** so agents can call the UDF without specifying every parameter. A UDF with no defaults forces the agent to guess.
**Harden the surface area.** Agents should only control what they genuinely need to vary. Everything else — table names, file paths, internal SQL structure — should be hardcoded. This prevents both misuse and prompt injection. See Write UDFs securely for full guidance.
## Build for chaining
Agents rarely call a single UDF in isolation. They build pipelines — the output of one call becomes the input of the next. A few patterns make UDFs much easier to chain reliably.
### Accept any readable format as input
If your UDF accepts a `path` parameter, don't hardcode `pd.read_parquet(path)`. Agents may pass CSVs, GeoJSON files, or other formats depending on what a prior step produced. Detect the format and read accordingly:
```python
# analyze_locations
@fused.udf
def udf(path: str, value_col: str = "score"):
"""
Analyzes location data from the file at path.
Accepts Parquet, CSV, or GeoJSON.
"""
if path.endswith(".parquet"):
df = gpd.read_parquet(path)
elif path.endswith((".json", ".geojson")):
df = gpd.read_file(path)
elif path.endswith(".csv"):
df = pd.read_csv(path)
else:
try:
df = gpd.read_parquet(path)
except Exception:
df = gpd.read_file(path)
...
```
A UDF that crashes on CSV input when the agent passes one breaks the whole pipeline. Accept what the agent might reasonably give you.
### Add `output_path` and `save_to_file` parameters
Agents chain UDFs by passing the output of one as the input to another. The cleanest way to do this is via a stable S3 path — not by passing a live UDF URL as input to the next call (which causes the receiver to fetch HTML or GeoJSON and try to parse it as Parquet).
Give every analysis or transformation UDF an `output_path` and `save_to_file` parameter:
```python
# transform_data
@fused.udf
def udf(
path: str,
# ... task-specific params ...
output_path: str = "",
save_to_file: bool = False,
overwrite: bool = False,
):
"""
Transforms the dataset at path.
If save_to_file=true, writes the result to output_path on S3
and returns a status object with the output_path — suitable for chaining.
Otherwise returns the result directly.
"""
gdf = process(path)
if save_to_file and output_path:
if not overwrite and file_exists(output_path):
return []
gdf.to_parquet(output_path)
return []
return gdf
```
When called with `save_to_file=true`, the agent reads the `output_path` from the response and passes it to the next UDF. When called without it, the agent gets the data directly. Both modes work with the same UDF.
### Name output columns explicitly — don't inherit from input
If your UDF aggregates or transforms a column, name the output column after what it _represents_, not where it came from. An aggregated count stored in a column called `latitude` (because that was the `value_col` parameter) will confuse both agents and humans downstream.
```python
# doctest: skip
# ❌ Output column inherits the input column name — "latitude" actually means "count"
gdf = aggregate(df, value_col="latitude", agg="count")
# → columns: ["hex", "latitude", "geometry"]
# ✅ Rename to reflect what the column actually contains
gdf = aggregate(df, value_col="latitude", agg="count")
gdf = gdf.rename(columns=)
# → columns: ["hex", "count", "geometry"]
```
If you want to let callers name the output column, add an `output_col` parameter with a sensible default:
```python
# aggregate_by_hex
@fused.udf
def udf(path: str, value_col: str, agg: str = "count", output_col: str = ""):
result_col = output_col or agg
gdf = ... # aggregate
gdf = gdf.rename(columns=)
return gdf
```
---
## Expose your canvas to agents
### Share via MCP
Click **Share → Copy MCP** in Workbench to get a ready-to-run `claude mcp add` command for your canvas. AI tools (Claude, Cursor, VS Code with MCP extensions) can connect to this endpoint directly and discover your UDFs as callable tools. For a step-by-step walkthrough, see Connecting AI to Data.
**Only visible UDFs are included.** UDFs that are hidden in Workbench are excluded from the MCP endpoint. Use this to keep helper UDFs, internal utilities, or anything you don't want agents to call directly out of the tool list — they'll still run when called by other UDFs, they just won't be surfaced.
[Image: Only visible UDFs appear in OpenAPI]
In the example above, the top canvas exposes all three UDFs to the agent, while the bottom canvas hides the two upstream UDFs and surfaces only the final analysis tool. Hiding intermediate steps keeps the agent's tool list focused on the UDFs that answer questions directly.
### Organize your canvas
All UDFs on a canvas are exposed together through a single canvas token (`fc_XXX`). Group agent-facing UDFs on a dedicated canvas and move large batch jobs or internal utilities to a separate one:
```
Canvas A (agent-facing) Canvas B (internal)
───────────────────────────── ──────────────────────────────
get_county_demographics run_full_etl_pipeline
convert_to_parquet rebuild_vector_index
check_ingestion_status reprocess_historical_data
```
This lets you share the Canvas A token freely — in MCP configs, in documentation, with external agents — without worrying about exposing heavy or destructive operations. See Tokens & endpoints for how to manage canvas access.
### Build visualizations with Widgets
UDFs return data — they're not the right place for charts or maps. For visualizations, use Widgets: JSON UI components that run SQL over UDF output and render as bar charts, line charts, maps, and more. An agent can construct a Widget URL from any UDF on the canvas without modifying the UDF itself.
## Security
Agents execute with the parameters they're given. Treat every agent-supplied parameter as untrusted input:
- Never accept free-form SQL, table names, or file paths as agent-controlled parameters
- Hardcode sensitive connection details — never expose them as params
- Validate and constrain inputs (e.g. an allowlist of valid `metric` values)
See Write UDFs securely for full guidance.
## See also
- Connecting AI to Data — how to connect your canvas to Claude Code via MCP and add an AI chat widget
- Widgets — build charts and maps from UDF output
- Write UDFs securely
- Run UDFs efficiently
- Efficient caching
- Scaling out UDFs
- Cloud storage
- Tokens & endpoints
================================================================================
## Using AI Coding Tools with Fused CLI
Path: guide/working-with-udfs/udf-best-practices/ai-coding-tools.mdx
URL: https://docs.fused.io/guide/working-with-udfs/udf-best-practices/ai-coding-tools
Fused publishes a skills plugin that teaches AI coding tools the Fused-specific formats they need to author canvases and write UDFs. Once installed, the AI understands how to create and modify Fused canvases, call integrations, and use the CLI without you having to explain the format every time.
The plugin covers five skill areas:
| Skill | What it teaches |
|---|---|
| `canvas-toml` | `canvas.toml` format — nodes, edges, viewport, folder layout |
| `fused-cli` | `fused` CLI — push, run, share, and manage UDFs from the terminal |
| `fused-integrations` | Built-in integration helpers — Snowflake, BigQuery, GCS, S3, Airtable, Notion, Google Drive |
| `fused-udfs` | Writing Fused UDFs — structure, parameters, return types, caching, agent-friendly design |
| `json-ui-schemas` | Widget JSON schemas — text inputs, dropdowns, charts, maps, SQL tables |
---
## Fused CLI
Install the `fused` Python package to get the CLI:
```bash
pip install --upgrade fused
```
The CLI covers running UDFs, managing canvases, uploading files, handling secrets and integrations, and more. See the CLI Reference for the full command reference.
---
## Claude Code
Claude Code supports the Fused plugin natively via its plugin marketplace. Once installed, Claude Code automatically applies the Fused skills whenever you work on canvas files.
**Via the `fused` CLI (recommended):**
```bash
fused claude plugin add
```
**Via Claude Code directly:**
```bash
claude plugin marketplace add fusedio/claude-plugins
claude plugin install fused@fused-marketplace
```
To update or remove later:
```bash
claude plugin update fused@fused-marketplace
claude plugin remove fused
```
### Try it out
Once the plugin is installed, ask Claude Code to build a canvas from scratch. Try a prompt like:
```
Make a Hello World canvas with some dummy data and a chart showing the number of rows in the data
```
Claude writes the UDF, wires up a chart widget, and pushes the canvas with the `fused` CLI — no manual setup. The result is some dummy data and a bar chart of the row count per category:
[Image: Hello World canvas with dummy data and a bar chart of row counts by category]
---
## Editing canvases locally with Claude
Once Claude Code is set up, the typical workflow is:
**1. Pull your canvas to a local folder**
```bash
fused canvas pull
```
This downloads the canvas — UDF `.py` files, `canvas.toml`, and widget JSON — into a local directory. Claude Code can then read and edit those files directly.
**2. Ask Claude to make changes**
With the canvas pulled locally, you can ask Claude to modify UDFs, wire new nodes, update widget configs, or restructure the canvas. Claude edits the files in place — no copy-pasting required.
**3. Push changes back to Fused**
```bash
fused canvas push
```
This replaces the remote canvas with your local state. Any UDFs missing from the local folder are removed from the remote canvas.
**4. Review and pull changes in Workbench**
Once you push, Fused Workbench detects that the server has a newer version and shows a prompt:
[Image: Workbench showing newer version on server]
Click **Compare** to review the diff against the current canvas state, or **Later** to dismiss and pull manually. When you're ready, the **Pull server changes** panel lets you pull all UDFs at once or cherry-pick individual ones:
[Image: Pull server changes panel with per-UDF controls]
See Versioning for more on checkpoints, diffs, and restoring previous states.
---
## See also
- Connect an AI agent — step-by-step walkthrough of connecting Claude Code to a canvas
- Building for Agents — expose your canvas as an MCP endpoint for AI agents to query
- Working as a Team — GitHub integration for canvas version control
- Versioning — checkpoints, diffs, and restoring canvas state
================================================================================
## Scaling Out UDFs
Path: guide/working-with-udfs/udf-best-practices/batch-jobs.mdx
URL: https://docs.fused.io/guide/working-with-udfs/udf-best-practices/scaling-out
When realtime isn't enough: run many jobs in parallel, or run on a dedicated machine with more resources.
## Choosing your approach
| Your situation | Use |
|----------------|-----|
| Many inputs (files, dates, regions) | Parallel execution |
| Single job needs >120s or >10GB RAM | Dedicated instance |
| Many heavy jobs | Combining both |
## Parallel execution
Use `.map()` to run a UDF over multiple inputs in parallel, spinning up separate instances for each job.
```python
# doctest: skip
@fused.udf
def my_udf(x: int):
return x ** 2
inputs = [0, 1, 2, 3, 4]
pool = my_udf.map(inputs)
results = pool.df()
```
For the full API reference, see `udf.map()`.
### Start small, then scale
Don't immediately spin up 1000 jobs. Test progressively:
```python
# doctest: skip
# First test with 5 inputs
pool = my_udf.map(inputs[:5])
# Then 10, then 50, then scale up
pool = my_udf.map(inputs[:50])
```
### Target 30-45s per job
Each parallel job has a **120s timeout**. Aim for 30-45s per job to leave safety margin for slower runs.
If your jobs consistently hit the timeout, either:
- Break them into smaller chunks
- Use a dedicated instance type
### Check timing
Monitor how long each job takes with `pool.times()`:
```python
# doctest: skip
pool = my_udf.map(inputs[:5])
pool.wait()
print(pool.times()) # Time per job
```
### Error handling
**By default, errors aren't cached.** If a job fails (e.g., API timeout), it will retry fresh on the next run. See Caching for more on how caching works.
However, if you wrap errors in try/except and return a result, that result gets cached:
```python
@fused.udf
def my_udf(url: str):
try:
return fetch_data(url)
except Exception as e:
return # This gets cached!
```
---
## Dedicated instances
Dedicated instances run on machines with more resources and no time limits. Use them when your UDF needs more than realtime can offer.
### When to use
Use a dedicated instance when your UDF exceeds realtime limits:
- Takes longer than **120s** to run
- Needs more than **~4GB RAM**
**Tradeoffs:**
- ~30s startup time (machine needs to spin up)
- Higher resource availability
### Starting a dedicated instance job
Set `engine` to run on a dedicated machine:
```python
@fused.udf(engine='small')
def my_udf():
# This UDF runs on a dedicated instance
...
```
[Image: Running a job from workbench]
In Workbench, dedicated instance UDFs require manual execution (`Shift+Enter`) and show a confirmation modal.
Dedicated instance and realtime jobs have separate caches. Running the same UDF with different `engine` values will cache results independently.
### Write to disk, don't return data
Dedicated instance jobs should **write results to cloud storage or mount**, not return them. Data returned can be lost if the connection times out.
```python
@fused.udf(engine='small')
def my_udf(input_path: str):
# Process data
df = pd.read_parquet(input_path)
result = heavy_processing(df)
# Write to S3, not return
output_path = f"s3://my-bucket/results/"
result.to_parquet(output_path)
return output_path # Return the path, not the data
```
### Monitor your jobs
Dedicated instance jobs take time to start and run. Use the **Jobs page** in Workbench to monitor:
- **Status**: Running, Completed, Failed
- **CPU & Memory**: Resource usage over time
- **Disk**: Storage consumption
- **Runtime**: How long the job has been running
- **Logs**: Real-time output from your UDF
```python
# doctest: skip
# Programmatic monitoring
job.status # Check status
job.tail_logs() # Stream logs
job.cancel() # Stop a job
```
### Expect startup delay
Dedicated instances take ~30s to spin up. Plan accordingly—they aren't for quick iterations.
Test your UDF on a small data sample using realtime execution. Once you're confident it works, switch to a batch `engine` to scale up.
### Instance types
| Alias | vCPUs | RAM |
|-------|-------|-----|
| `small` | 2 | 2 GB |
| `medium` | 16 | 64 GB |
| `large` | 64 | 512 GB |
See the full list of AWS / GCP instance types
---
## Combining both
If your jobs need more than 120s or ~4GB RAM each, combine parallel execution with dedicated instances:
```python
# doctest: skip
pool = my_udf.map(inputs, engine="large")
pool.wait()
```
---
## Example use cases
- Climate Dashboard — Processing 20TB of data in minutes
- Dark Vessel Detection — Retrieving 30 days of AIS data
- Satellite Imagery — Processing Maxar's Open Data STAC Catalogs
- Ingesting cropland data for zonal statistics
- Data ingestion for large geospatial files
## See also
- Running UDFs — calling UDFs
- Parallel execution — `.map()` details
- `JobPool` API reference — all JobPool methods
- Caching — how caching works
================================================================================
## Cache invalidation
Path: guide/working-with-udfs/udf-best-practices/cache-invalidation.mdx
URL: https://docs.fused.io/guide/working-with-udfs/udf-best-practices/cache-invalidation
Fused caches UDF results automatically (see Efficient caching). When you need to force-refresh cached results — after updating source data, fixing a bug in a UDF, or redeploying a pipeline — you can invalidate the cache programmatically.
## Python SDK
Call `invalidate_cache()` on any saved UDF object to clear its cached results.
### Full cache
```python
@fused.udf
def udf():
parent = fused.load("udf_to_invalidate")
parent.invalidate_cache()
data = parent()
return data
```
### Single tile
For Tile UDFs, you can invalidate the cache for a specific tile instead of the entire UDF. Pass `z`, `x`, and `y` as keyword arguments:
```python
udf = fused.load("udf_to_invalidate")
udf.invalidate_cache(z=15, x=9647, y=12320)
```
All three tile coordinates (`z`, `x`, `y`) must be provided together. You cannot invalidate by zoom level alone.
## HTTP API with service token
You can also invalidate cache via the HTTP API, authenticated with a Fused Service Account. This is useful for CI/CD pipelines, cron jobs, or any automation that runs outside of Fused.
The endpoint is:
```
DELETE https://www.fused.io/server/v1/realtime-shared//udf-cache/by-id//delete
```
Both values can be looked up with the Python SDK:
```python
@fused.udf
def udf():
my_udf = fused.load("udf_to_invalidate")
udf_id = my_udf.metadata["fused:id"]
client_id = fused.options.realtime_client_id
return pd.DataFrame()
```
These values stay stable and can be stored as environment variables. The service account token should be stored securely as a secret.
### Full cache
```python
fused_service_account_token = os.getenv("FUSED_SERVICE_ACCOUNT_TOKEN")
headers = ",
}
response = requests.delete(
f"https://www.fused.io/server/v1/realtime-shared//udf-cache/by-id//delete",
headers=headers,
)
response.raise_for_status()
```
### Single tile
Append `z`, `x`, and `y` as query parameters to scope the purge to one tile:
```python
response = requests.delete(
f"https://www.fused.io/server/v1/realtime-shared//udf-cache/by-id//delete",
headers=headers,
params=,
)
response.raise_for_status()
```
All three query parameters (`z`, `x`, `y`) must be provided together. The server returns `422 Unprocessable Entity` if only some are present.
## See also
- Efficient caching — how caching works, `cache_max_age`, and common gotchas
- Securing Shared Tokens — creating service accounts and session tokens
- `Udf` API reference — full SDK details
================================================================================
## Efficient caching
Path: guide/working-with-udfs/udf-best-practices/caching.mdx
URL: https://docs.fused.io/guide/working-with-udfs/udf-best-practices/caching
[Image: Efficient Caching diagram]
Fused caches UDF results automatically to make repeated calls faster. Cached calls return instantly and **don't consume Fused Credit Units**—you only pay for compute once, then reuse the result for free.
## Two types of cache
| Type | When it applies | Storage | Default Duration | Speed |
|------|-----------------|---------|-------------|-------|
| UDF cache | UDF call results | S3 | 14 days | Good |
| `@fused.cache` | Functions inside UDFs | mount | 48 hours | Fast |
Both work the same way: store the result of [function + inputs], return cached result on repeat calls. Change the function or inputs → cache miss → recompute.
## UDF cache
Every UDF call is cached automatically. No configuration needed.
The UDF cache is hosted in `us-west-2`. If your users are outside the US, expect a small amount of added latency (~1–2s) for cached responses due to the geographic round trip.
```python
# doctest: skip
my_udf() # First call: runs UDF
my_udf() # Second call: returns cached result
```
**Disable caching** when you need fresh results:
```python
@fused.udf(cache_max_age=0)
def my_udf():
...
# Or at call time
my_udf(cache_max_age=0)
# or
my_udf(cache=False)
```
## @fused.cache
Use `@fused.cache` for expensive operations *inside* a UDF—loading slow file formats, heavy computations that repeat across runs.
```python
@fused.udf
def udf(ship_length: int = 100):
@fused.cache
def load_data(path):
return pd.read_csv(path) # Slow format, cache it
df = load_data("s3://bucket/large_file.csv")
return df[df.Length > ship_length]
```
The CSV loads once and caches. Changing `ship_length` doesn't reload the file—only changing the `path` would.
**When to use it:**
- Loading CSV, Shapefile, or other slow formats
- Expensive computations that don't depend on all UDF parameters
- API calls you don't want to repeat
**When NOT to use it:**
- Very large datasets (>10GB)—consider ingesting to cloud-native formats instead
## `cache_max_age` reference
Control how long cached results stay valid.
**Format:** `30s` (seconds), `10m` (minutes), `24h` (hours), `7d` (days)
**Where you can set it:**
| Context | Example |
|---------|---------|
| UDF definition | `@fused.udf(cache_max_age="24h")` |
| Direct call | `my_udf(cache_max_age="1h")` |
| @fused.cache | `@fused.cache(cache_max_age="30m")` |
| HTTPS endpoint | `udf.fused.io/token.json?cache_max_age=0` |
The endpoint accepts **seconds as a number** (e.g. `cache_max_age=10`). Python accepts human-readable formats like `10s`, `10m`, `24h`.
**Priority:** Call-time param > `@fused.udf()` > default (90 days)
## Common gotchas
### Parent/child UDF changes
When calling one UDF from another, the child won't automatically refresh when the parent changes:
```python
@fused.udf
def child_udf():
parent = fused.load("parent_udf")
data = parent() # Won't re-fetch if parent changes
return data
```
Fix: disable cache on the child so it always calls the parent:
```python
@fused.udf(cache_max_age=0)
def child_udf():
parent = fused.load("parent_udf")
data = parent() # Always gets latest from parent
return data
```
### Invalidate cache
You can invalidate the UDF cache programmatically — including purging specific tiles. See Cache invalidation for details.
### @fused.cache is shared across UDFs
If two UDFs define the same cached function — identical source code, called with the same arguments — the second will reuse the cached result from the first instead of recomputing. This is because the cache key is based on function source code and call arguments, not on which UDF the function belongs to. Here's an example:
**UDF 1**
```python
@fused.udf
def udf():
@fused.cache
def cached_sleep(): # identical source → same cache key
time.sleep(5)
cached_sleep() # populates the cache on first run
return pd.DataFrame()
```
**UDF 2**
```python
@fused.udf
def udf(name: str = "world"):
@fused.cache
def cached_sleep(): # identical source → hits UDF 1's cache entry
time.sleep(5)
cached_sleep() # returns instantly if UDF 1 ran first
return pd.DataFrame()
```
Any change to function source — a comment, print statement, or different call arguments — produces a different hash and causes a cache miss.
To avoid accidental cache sharing, use distinct function names:
```python
@fused.cache
def cached_sleep_udf1():
...
@fused.cache
def cached_sleep_udf2():
...
```
### Realtime vs dedicated instance have separate caches
```python
# doctest: skip
my_udf() # realtime cache
my_udf(engine="small") # different cache (dedicated instance)
```
### Caching with `bounds` in Tile UDFs
When using Tile UDFs, panning the map triggers new UDF calls with different `bounds`. If you cache a function that takes `bounds` as input, each tile creates a separate cache entry.
**This can be useful:** Pan back to a previously viewed area and the cached tiles load instantly.
**Watch out for:** If you're iterating on code, you may accumulate many cache entries. Consider what actually needs to vary with `bounds`:
```python
# Caches per tile - good for expensive tile-specific operations
@fused.cache
def process_tile(bounds):
...
# Caches once - better when data doesn't depend on bounds
@fused.cache
def load_data(path):
return gpd.read_file(path)
gdf = load_data(path)
return gdf[gdf.geometry.intersects(bounds_geom)] # Filter after
```
## Monitor your cache usage
See how much caching is saving you in the **Profile** page in Workbench. The usage dashboard shows cache hits vs actual compute across different time ranges.
[Image: Cache usage in Account page]
## See also
- Cache invalidation — purge cached results via Python or the HTTP API
- Data ingestion — for large datasets, ingest to Parquet/GeoParquet instead of caching
- Running UDFs — calling UDFs
- `Udf` API reference — full API details
================================================================================
## Debugging playbook
Path: guide/working-with-udfs/udf-best-practices/debugging-playbook.mdx
URL: https://docs.fused.io/guide/working-with-udfs/udf-best-practices/debugging-playbook
Practical techniques for diagnosing and fixing UDFs — from slow code to failed parallel jobs.
## Use the inline profiler
Workbench includes a built-in line-by-line profiler. After a run, each line shows its execution time and hit count — no instrumentation needed.
[Image: Workbench inline profiler showing per-line timing]
Things to look for:
- A slow I/O call dominating total runtime
- A loop body running far more times than expected
- A `@fused.cache` function showing a cache miss on every run
## print intermediate results
`print()` output appears directly in the Workbench results panel. Drop prints wherever you need to track what's happening:
```python
# doctest: skip
print(f"task_id= got value=")
```
Anything you `print()` is visible to anyone calling your UDF — don't print secrets, credentials, or environment variables. See Write UDFs securely for guidance.
## Bust the cache
Cached results can mask bugs — a fix won't appear until the cache is invalidated. There are two independent caches:
| Cache | Cleared by |
|-------|-----------|
| UDF cache | `cache=False` at call time, or `cache_max_age="0s"` on the UDF |
| Workbench cache | **Clear cache** button in the Workbench toolbar |
**Clear cache** only clears the Workbench-level cache. Calls via the HTTP endpoint use a separate cache. See Each execution context has its own cache.
Disable the UDF cache at call time:
```python
# doctest: skip
pool = flaky_task.map(task_ids, cache=False)
```
Or permanently during development:
```python
@fused.udf(cache_max_age="0s")
def udf(): ...
```
Force-reset a `@fused.cache` function:
```python
@fused.cache(cache_reset=True)
def load_data(path): ...
```
## Debug parallel runs
`udf.map()` returns a `JobPool`. If any jobs fail, calling `.df()` will raise — use the pool's inspection API instead to understand what happened across all jobs.
The examples below use `flaky_task` — a UDF that sleeps 2s and raises a `ValueError` on ~50% of runs. Try it out →
```python
@fused.udf(cache_max_age="0s")
def udf(task_id: int = 0):
time.sleep(2)
value = int(np.random.default_rng().integers(0, 10))
if value % 2 == 0:
raise ValueError(f"task_id= failed! Got even number: ")
return pd.DataFrame()
```
### Start small
Before scaling to hundreds of inputs, test with 2–3 first. Change `n_tasks` directly in Workbench — once it works at small scale, increase it:
```python
flaky_task = fused.load("flaky_task")
pool = flaky_task.map(list(range(n_tasks)), cache=False) # try n_tasks=2 first
pool.wait()
```
Now use the pool to inspect what happened.
### Check overall status
`pool.status()` returns a count of outcomes. `all_succeeded()` and `any_failed()` give quick boolean checks:
```python
# doctest: skip
pool.status()
# status
# success 5
# error 1
# Name: count, dtype: int64
pool.all_succeeded() # False
pool.any_failed() # True
```
### Inspecting errors
`first_error()` gives you the first failure with full detail — the fastest way to triage. `errors()` returns the list of all failures:
```python
# doctest: skip
pool.first_error()
# Run #3
#
# The UDF returned the following error in line 22:
# ValueError: task_id=3 failed! Got even number: 8
pool.errors()
# [UdfRuntimeError: Run #3 ...]
```
### Check per-job timing
`times()` returns per-job durations — useful for spotting outliers or hung jobs:
```python
# doctest: skip
pool.times()
# [timedelta(seconds=2, microseconds=565825),
# timedelta(seconds=2, microseconds=580730),
# timedelta(seconds=4, microseconds=352142),
# timedelta(seconds=2, microseconds=507098),
# timedelta(seconds=2, microseconds=561703),
# timedelta(seconds=9, microseconds=824293)]
```
### Inspect every result
`results(return_exceptions=True)` returns one entry per job — a DataFrame on success, an exception on failure:
```python
# doctest: skip
mixed = pool.results(return_exceptions=True)
# task 0: DataFrame shape=(1, 3)
# task 1: DataFrame shape=(1, 3)
# task 2: DataFrame shape=(1, 3)
# task 3: UdfRuntimeError: task_id=3 failed! Got even number: 8
# task 4: DataFrame shape=(1, 3)
# task 5: DataFrame shape=(1, 3)
```
 ### Retry failed jobs
`pool.retry()` re-runs only the failed jobs without restarting the whole batch:
```python
# doctest: skip
if pool.any_failed():
pool.retry()
pool.wait()
pool.status()
# status
# success 6
# Name: count, dtype: int64
```
## See also
- Efficient caching
- Scaling out UDFs
- JobPool (class)
- Run UDFs efficiently
================================================================================
## Geospatial processing
Path: guide/working-with-udfs/udf-best-practices/geospatial-single-vs-tile.mdx
URL: https://docs.fused.io/guide/working-with-udfs/udf-best-practices/geospatial-single-vs-tile
# Geospatial processing
There are 2 main ways to work with spatial data in Fused:
## Single UDF
Single UDFs are the default behavior in Fused. The UDF is run 1 time with the current viewport bounds.
[Image: Single UDF Mode]
Characteristics:
- 1 Single UDF is called on the entire Map Viewport
- Panning Map does NOT re-run the UDF
- "Results" Tab shows the output of the unique UDF called
### Single HTTPS Call
A Single UDF is called like any other UDF via a HTTPS request:
```bash
https://udf.ai/fc_/my_udf.csv
```
Replace `fc_` and `my_udf` with your canvas token and UDF name.
Or via the Fused Python SDK:
```python showLineNumbers
single_udf = fused.load("single_udf")
single_udf()
```
There are 2 types of Spatial Single UDFs:
### Single (Viewport)
Will prioritize the current MAP VIEWPORT bounds, regardless of the `bounds` parameter.
```python showLineNumbers
@fused.udf
def udf(bounds: fused.types.Bounds = [-74.38,40.32,-73.31,41.29]):
print(bounds) # This will be the current MAP VIEWPORT bounds, regardless of the `bounds` parameter
return bounds
```
### Single (Parameter)
Will use the `bounds` parameter, regardless of the current MAP VIEWPORT bounds.
```python showLineNumbers
@fused.udf
def udf(bounds: fused.types.Bounds = [-74.38,40.32,-73.31,41.29]):
print(bounds) # This will be the `bounds` parameter, regardless of the current MAP VIEWPORT bounds
return bounds
```
### Example UDF
- Get Isochrone
- Returns an isochrone (how far a person cal walk / drive) polygon for a given point
## Tile UDF
Tile UDFs tile the users viewport into a grid of smaller tiles and running a UDF for each.
[Image: Tile UDF Mode]
Characteristics:
- Multiple Tile UDFs are called to cover the current Map Viewport
- Panning Map re-runs the UDF for each tile
- "Results" Tab shows the output of the _latest_ tile called
### Tile HTTPS Call
A Tile UDF is called by passing Web mercator XYZ tiles through the HTTPS request
**Two ways to call the HTTPS endpoint:**
**1. Dynamic tile server (for map applications)**
```bash
https://udf.ai/fc_/my_udf/run/tiles///?=png
```
Replace `fc_` and `my_udf` with your canvas token and UDF name. Use this template in mapping libraries; `//` is replaced with tile coordinates as users pan and zoom.
Example use cases:
- QGIS
- Felt
- DeckGL
- Mapbox
**2. Specific tile call**
```bash
# Calls a single tile - San Francisco center at zoom 13
https://udf.ai/fc_/my_udf/run/tiles/13/1316/3169?=png
```
Use this to fetch data for one specific tile location.
Or via the Fused Python SDK:
```python showLineNumbers
tile_udf = fused.load("tile_udf")
# With bounds parameter
tile_udf(bounds=bounds)
# With x, y, z parameters
tile_udf(x=1, y=2, z=3)
```
### Example UDF
- Overture Maps Example
- Manipulate _all_ the buildings from the Overture Maps dataset by leveraging Fused ingestion
- Landsat Tile Example
- Returns NDVI tile computed on the fly from Landsat data
## Comparing Single and Tile UDFs
| Feature | Single UDF | Tile UDF |
|---------|------------|-----------|
| UDF Calls | 1 | Multiple |
| Parameters | `bounds` (Optional) | `bounds` or `x`, `y`, `z` |
| Map rendering | Static | Dynamic |
| HTTP Call | Single Call | Tile Server calls or Single Call (specific tile) |
| Runtime Tab display | Unique output of the UDF called | Output of the _latest_ tile called |
| Use Case | Small static data | Calling large dataset through tile server |
## `bounds`
`bounds` is simply a list of 4 coordinates representing the bounds of a geometry. The 4 coordinates represent `[xmin, ymin, xmax, ymax]` of the bounds.
In Fused it is defined with the `fused.types.Bounds` type:
```python showLineNumbers
# doctest: skip
@fused.udf
def udf(bounds: fused.types.Bounds=None):
print(bounds)
>>> [-1.52244399, 48.62747869, -1.50004107, 48.64359255]
```
### `bounds` to `GeoDataFrame`
Converting `bounds` (list of 4 coordinates) to a `GeoDataFrame`:
### Legacy types
Legacy types that might still appear in older UDFs.
#### [Legacy] `fused.types.Tile`
This is a geopandas.GeoDataFrame with `x`, `y`, `z`, and `geometry` columns.
```python showLineNumbers
# doctest: skip
@fused.udf
def udf(bounds: fused.types.Tile=None):
print(bounds)
>>> x y z geometry
>>> 0 327 790 11 POLYGON ((-122.0 37.0, -122.0 37.1, -122.1 37.1, -122.1 37.0, -122.0 37.0))
```
#### [Legacy] `fused.types.TileGDF`
This behaves the same as `fused.types.Tile`.
#### [Legacy] `fused.types.ViewportGDF`
This is a geopandas.geodataframe.GeoDataFrame with a `geometry` column corresponding to the Polygon geometry of the current viewport in the Map.
```python showLineNumbers
# doctest: skip
@fused.udf
def udf(bbox: fused.types.ViewportGDF=None):
print(bbox)
return bbox
>>> geometry
>>> POLYGON ((-122.0 37.0, -122.0 37.1, -122.1 37.1, -122.1 37.0, -122.0 37.0))
```
#### [Legacy] `bbox` object
UDFs defined using the legacy keyword `bbox` are automatically now mapped to `bounds`. Please update your code to use `bounds` directly as this alias will be removed in a future release.
================================================================================
## Run UDFs efficiently
Path: guide/working-with-udfs/udf-best-practices/realtime.mdx
URL: https://docs.fused.io/guide/working-with-udfs/udf-best-practices/realtime
Realtime is the default way to run UDFs—no configuration needed. Every UDF runs in realtime mode unless you explicitly request a batch instance.
This guide covers best practices for calling UDFs from other UDFs and building pipelines. For the full API reference, see the `Udf` class.
## Limits
| Resource | Limit |
|----------|-------|
| Execution time | 120s |
| RAM | ~10GB |
Need more? See Scaling out UDFs.
## Calling another UDF
Load and call UDFs directly:
```python
@fused.udf
def udf():
child = fused.load("child_udf")
result = child(name="hello")
return result
```
[Image: Calling another UDF in workbench]
In Workbench, UDF calls create visual links between parent and child UDFs, making pipelines easy to follow.
For geospatial UDFs, you can pass `bounds` as a bbox list, GeoDataFrame, or tile coordinates. See Reserved parameters.
## Best practices
### Keep results fresh
By default, UDF results are cached. To always get fresh data, disable caching:
```python
@fused.udf(cache_max_age=0)
def udf():
parent = fused.load('parent_udf')
return parent()
```
Setting `cache_max_age=0` means this UDF runs from scratch every time—no caching. Use this when your output depends on frequently changing data.
### Pin to commit hash for production
When loading UDFs from GitHub, pin to a specific commit:
```python
commit_hash = "bdfb4d0"
my_udf = fused.load(f"https://github.com/fusedio/udfs/tree//public/My_UDF/")
result = my_udf()
```
Avoid pointing to `main` branch—your UDF will break when others push changes.
## Warm & cold starts
After inactivity, Fused needs to spin up an instance and load the environment. This **cold start** typically takes **5–15s**.
Once warm, subsequent calls execute within seconds. Instances stay warm for approximately **20 minutes** after the last call. The more active your system is, the more containers remain provisioned—heavy usage keeps the environment hotter.
Keeping Workbench open automatically pings your environment every **2 minutes**, keeping it partially warm with no extra effort.
Fused does not charge for cold start time.
[Image: Cold start vs warm execution]
## When to scale up
| Need | Solution |
|------|----------|
| Run same UDF over multiple inputs | Parallel execution |
| More than 120s or ~10GB | Dedicated instances |
## See also
- Running UDFs — full reference
- `Udf` API reference — all methods and parameters
- Tokens & endpoints — call UDFs via HTTP
- Caching — how caching works
================================================================================
## Write UDFs securely
Path: guide/working-with-udfs/udf-best-practices/security.mdx
URL: https://docs.fused.io/guide/working-with-udfs/udf-best-practices/security
Fused UDFs are flexible, but callers and shared links should be treated with the same care as any public API. The sections below cover secrets, parameters, SQL, paths, and optional canvas passcodes. For **public vs team-only** sharing, session tokens, and HTTPS access rules, see Securing shared tokens.
## Use secrets
Never put passwords or API keys in UDF source. Add them in secrets management, then read them at runtime (for Snowflake, set names like `SNOWFLAKE_USER` and `SNOWFLAKE_PASSWORD` there—see the Snowflake integration guide).
**Do not: hardcode credentials**
Do **not** put real passwords or keys in UDF source. Anyone with repo or UDF access can read them, and they leak in logs and diffs.
**Do: load secrets from secrets management**
Read secrets at runtime with `fused.secret("NAME")` or `fused.secrets["NAME"]` so values stay out of source control.
```python showLineNumbers
@fused.udf
def udf():
conn = snowflake.connector.connect(
user=fused.secrets["SNOWFLAKE_USER"],
password=fused.secrets["SNOWFLAKE_PASSWORD"],
account="your_account_identifier",
warehouse="your_warehouse",
database="your_database",
schema="your_schema",
)
cursor = conn.cursor()
cursor.execute("SELECT CURRENT_VERSION()")
df = cursor.fetch_pandas_all()
cursor.close()
conn.close()
return df
```
### Outputs, logs, and environment
Use `fused.secrets` only inside the UDF (for example to open connections). **Do not** return or print those values.
**`print` statements are also returned to users** — Anything you `print` is also shown to the user as run logs. Treat it like `return`: never print tokens, secret values, full request headers, or anything you would not return.
**Secrets and environment variables** — Do not expose the secrets or environment variables: avoid returning or printing `os.environ`, listing every variable, or similar. Environment variables can include cloud credentials and Fused-managed secrets.
## Narrow parameters
Design the UDF API so callers cannot widen what the code reads or how it queries.
| Prefer | Avoid |
|--------|--------|
| Typed arguments (`limit: int`, `state: str`) | Raw SQL strings from callers |
| A fixed path or table inside the UDF for one-off pipelines | A generic `path` or `sql` parameter (hard to validate, cache, and reason about) |
| Explicit options (`columns`, `order_by` chosen from a small set) | Free-form fragments spliced into queries |
| Serializable **data** (JSON, CSV, numbers, …) | Untrusted pickle; `eval` / `exec` / `compile` on caller input |
## Don’t run caller-supplied code
Parameters should be **data**, not code from callers.
- **`pickle.load` / `pickle.loads`** on untrusted bytes can execute arbitrary code. Do not unpickle caller-controlled input (or unvetted files).
- **`eval` / `exec` / `compile`** on caller-supplied strings — Never. Same for other “run this string as code” patterns.
## DuckDB / SQL patterns
1. **Values (IDs, filters, …)** — Don’t drop them into the SQL with an f-string or `+`. Write `?` where each value goes, then pass the real values in a list: `con.execute("... WHERE x = ?", [value])`. DuckDB treats those as **plain data**, not as extra SQL. For **paths**, fix or strictly validate them—see Do not expose the data source as a parameter.
2. **Column or table names** — You can’t use `?` for names—only for values. Pick allowed names in code (e.g. a Python `set`), reject anything else, then build the small part of the query that contains the name.
(Same pattern in other databases; syntax may differ.)
**Anti-pattern:**
**Safe:**
```python showLineNumbers
@fused.udf
def udf(data_type: str = "type_a"):
path = "s3://bucket/data.parquet"
con = duckdb.connect()
return con.execute(
"SELECT * FROM read_parquet(?) WHERE data_type = ?",
[path, data_type],
).df()
```
**Column name from an allowed list:**
```python showLineNumbers
@fused.udf
def udf(column: str = "data_type"):
path = "s3://bucket/data.parquet"
con = duckdb.connect()
allowed =
if column not in allowed:
raise ValueError("Unsupported column")
query = f'SELECT "" FROM read_parquet(?)'
return con.execute(query, [path]).df()
```
## Do not expose the data source as a parameter
Prefer fixing file paths and table names in the UDF body instead of taking them as arguments. That narrows what the UDF can access and keeps behavior predictable.
A `path` or URL argument lets callers redirect reads to **any** object your runtime can reach (another bucket, a different tenant’s prefix, local files, etc.) unless you maintain a strict allowlist—which is easy to get wrong. **Workbench does not treat path-like parameters as overridable run arguments by default**, to reduce accidental or malicious path substitution. Use fixed locations in code for normal UDFs; the looser `path` example below is only for intentional shared utilities.
**Looser surface area — `path` as a parameter** (reasonable only for a reusable “preview any file”–style tool):
```python showLineNumbers
@fused.udf
def preview_parquet(path: str, number_rows_to_preview: int = 10):
con = duckdb.connect()
return con.execute(
"SELECT * FROM read_parquet(?) LIMIT ?",
[path, number_rows_to_preview],
).df()
```
**Tighter surface area — path fixed inside the UDF:**
```python showLineNumbers
@fused.udf
def udf(number_rows_to_preview: int = 10):
path = "s3://fused-users/fused/my-user/my_file.parquet" # change to your own path
con = duckdb.connect()
return con.execute(
"SELECT * FROM read_parquet(?) LIMIT ?",
[path, number_rows_to_preview],
).df()
```
Predictable inputs improve safety and caching.
## Canvas access and shared tokens
How **public** and **team-only** canvas sharing work, when to split UDFs across canvases, and how **session tokens** (Workbench or service account) apply to UDF URLs are documented in Securing shared tokens.
## Protect endpoints with Canvas passcode
You can require a **canvas-wide passcode** in Canvas settings so viewers must enter it before the canvas loads. **Canvas passcode is only available for canvases that are shared publicly** (not team-only). UDFs on those canvases use the same protection when called through shared links.
[Image: Canvas settings: Passcode protection with Require passcode, set passcode field, and Save]
### Accessing Canvas with passcode
Anyone who opens the shared canvas link is prompted for the passcode before the canvas loads.
### Accessing UDFs with passcode
Opening a UDF as an API requires sending the passcode in an `Authorization` header:
Curl request:
```bash
curl -s \
-H 'authorization: fused-canvas-passcode ' \
"https://udf.ai//my_udf.json"
```
Python request:
```python
response = requests.get(
"https://udf.ai//my_udf.json",
headers=
)
```
## See also
- Securing shared tokens — public vs team-only, session tokens, service accounts
- Shared Tokens
- Secrets Management
- Amazon S3 integration — connect S3 buckets, including SSE-KMS encrypted buckets
================================================================================
## Storage options
Path: guide/working-with-udfs/udf-best-practices/storage.mdx
URL: https://docs.fused.io/guide/working-with-udfs/udf-best-practices/storage
Fused provides two file systems to make files accessible to all UDFs: an S3-backed home directory and a disk. Access is scoped at the organization level.
## Home directory
Fused provisions a private home directory in S3 for your account. Paths look like `s3://fused-users/fused/aman/` and are ideal for large-scale, cloud-native, or globally accessible datasets such as ingested tables, GeoTIFFs, and files that need to be read outside of Fused.
Use the File explorer to browse your home directory and confirm the exact path attached to your account.
[Image: file explorer]
```python showLineNumbers
job = fused.ingest(
input="https://www2.census.gov/geo/tiger/TIGER_RD18/STATE/06_CALIFORNIA/06/tl_rd22_06_bg.zip",
output="s3://fused-users/fused/aman/census/ca_bg_2022/", # change to your own path
).run_batch()
```
## `/mnt/cache` disk
`/mnt/cache` is the path to a mounted disk to store files shared between UDFs. This is where `@fused.cache` and `fused.download` write data. It's ideal for files that UDFs need to read with low-latency, downloaded files, the output of cached functions, access keys, `.env`, and ML model weights.
UDFs may interact with the disk as with a local file system. For example, to list files in the directory:
```python showLineNumbers
@fused.udf
def udf():
for each in os.listdir('/mnt/cache/'):
print(each)
```
### Troubleshooting
If you encounter the following error, it means `/mnt/cache` is not yet configured for your environment. To resolve this issue, please contact the Fused team to enable it.
```text
Error: No such file or directory: '/mnt/cache/'
```
================================================================================
## Un-pythonic aspects of Fused
Path: guide/working-with-udfs/udf-best-practices/unpythonic.mdx
URL: https://docs.fused.io/guide/working-with-udfs/udf-best-practices/unpythonic
Fused UDFs look like Python functions but run in a managed, distributed environment. That environment imposes a few constraints that feel unusual if you're used to writing standard Python scripts.
## Imports must be inside the UDF
In regular Python you put imports at the top of the file. In a Fused UDF they must go **inside** the function body:
Why: Fused serializes and ships your UDF function to a remote worker. Only the function body travels — the surrounding module scope does not. Any name referenced at module level won't exist on the worker when the function runs.
## Fused serialises the outputs
UDFs must return a value that Fused can serialize and send back to the caller. Anything else will fail at return time. See Output formats for the full list of supported types.
Result serialization failed: `ValueError: Return value not in an expected vector format (gpd.GeoDataFrame, pd.DataFrame, gpd.GeoSeries, pd.Series, shapely geometry) Was: `
## Leverage `udf.map()` for multi processing
`@fused.udf` turns your function into a `Udf` object — by default, calling it submits a job to Fused's remote workers, not a local Python call. `udf.map()` gives you flexibility over execution:
- `engine='remote'` (default) — fans out and spins up new UDFs
- `engine='local'` — runs multiple UDFs in parallel using the current UDF's available cores and memory
```python
# doctest: skip
pool = my_udf.map(list_of_inputs)
pool.wait()
results = pool.df()
```
We built `udf.map()` as a simple way to parallelize jobs either locally in your current UDF or remotely by spinning up new compute as you need it on demand.
See Scaling out UDFs.
## Reuse UDFs with `fused.load()`
Reusing a UDF is done with `fused.load()` with a UDF name or URL rather than a Python import:
```python
other_udf = fused.load("https://github.com/fusedio/udfs/tree/main/public/DuckDB_H3_Example")
```
You're not just importing the code — you're importing the whole UDF, which lets you:
- Inspect it: `other_udf.meta`
- Execute it directly: `other_udf(params)`
- Run it in parallel: `other_udf.map(list_of_inputs)`
## Fused environments come with predefined packages
Fused provides a hosted environment with the most common Python packages for data manipulation. See the full list in Dependencies.
Packages not supported? Reach out to `info@fused.io`.
## See also
- Writing UDFs
- Efficient caching
- Scaling out UDFs
================================================================================
## Working as a team
Path: guide/working-with-udfs/udf-best-practices/version-control.mdx
URL: https://docs.fused.io/guide/working-with-udfs/udf-best-practices/version-control
# Working as a team
**Prerequisite:** GitHub integration setup
By connecting a canvas to a GitHub repository, your team can collaborate on UDFs through pull requests, pull the latest changes back into the canvas, and share the canvas via a permanent link tied to your org rather than an individual user.
Here's what we'll do:
1. Save the canvas state as a **checkpoint** and push the UDFs to a shared GitHub repo via a PR
2. Pull any GitHub changes back into the canvas
3. Configure canvas access and generate a shared team link
## Step 1: Create a checkpoint and open a PR
A checkpoint saves the current state of your canvas so you can push it to GitHub or restore it later.
Open your canvas and click the **checkpoint icon** (🕐) in the top toolbar (step 1 below). This opens the **Canvas checkpoints** panel. Click **+ Create checkpoint**, give it a name, and click **Create**.
Once the checkpoint is saved, click **Create a PR** next to it. Fill in the **folder name** (the directory it will be pushed to in the repo), select the **repository**, and confirm the commit message — then click **Create PR** (step 2 below).
Changing the access setting automatically creates a PR on the linked repository to change
### Retry failed jobs
`pool.retry()` re-runs only the failed jobs without restarting the whole batch:
```python
# doctest: skip
if pool.any_failed():
pool.retry()
pool.wait()
pool.status()
# status
# success 6
# Name: count, dtype: int64
```
## See also
- Efficient caching
- Scaling out UDFs
- JobPool (class)
- Run UDFs efficiently
================================================================================
## Geospatial processing
Path: guide/working-with-udfs/udf-best-practices/geospatial-single-vs-tile.mdx
URL: https://docs.fused.io/guide/working-with-udfs/udf-best-practices/geospatial-single-vs-tile
# Geospatial processing
There are 2 main ways to work with spatial data in Fused:
## Single UDF
Single UDFs are the default behavior in Fused. The UDF is run 1 time with the current viewport bounds.
[Image: Single UDF Mode]
Characteristics:
- 1 Single UDF is called on the entire Map Viewport
- Panning Map does NOT re-run the UDF
- "Results" Tab shows the output of the unique UDF called
### Single HTTPS Call
A Single UDF is called like any other UDF via a HTTPS request:
```bash
https://udf.ai/fc_/my_udf.csv
```
Replace `fc_` and `my_udf` with your canvas token and UDF name.
Or via the Fused Python SDK:
```python showLineNumbers
single_udf = fused.load("single_udf")
single_udf()
```
There are 2 types of Spatial Single UDFs:
### Single (Viewport)
Will prioritize the current MAP VIEWPORT bounds, regardless of the `bounds` parameter.
```python showLineNumbers
@fused.udf
def udf(bounds: fused.types.Bounds = [-74.38,40.32,-73.31,41.29]):
print(bounds) # This will be the current MAP VIEWPORT bounds, regardless of the `bounds` parameter
return bounds
```
### Single (Parameter)
Will use the `bounds` parameter, regardless of the current MAP VIEWPORT bounds.
```python showLineNumbers
@fused.udf
def udf(bounds: fused.types.Bounds = [-74.38,40.32,-73.31,41.29]):
print(bounds) # This will be the `bounds` parameter, regardless of the current MAP VIEWPORT bounds
return bounds
```
### Example UDF
- Get Isochrone
- Returns an isochrone (how far a person cal walk / drive) polygon for a given point
## Tile UDF
Tile UDFs tile the users viewport into a grid of smaller tiles and running a UDF for each.
[Image: Tile UDF Mode]
Characteristics:
- Multiple Tile UDFs are called to cover the current Map Viewport
- Panning Map re-runs the UDF for each tile
- "Results" Tab shows the output of the _latest_ tile called
### Tile HTTPS Call
A Tile UDF is called by passing Web mercator XYZ tiles through the HTTPS request
**Two ways to call the HTTPS endpoint:**
**1. Dynamic tile server (for map applications)**
```bash
https://udf.ai/fc_/my_udf/run/tiles///?=png
```
Replace `fc_` and `my_udf` with your canvas token and UDF name. Use this template in mapping libraries; `//` is replaced with tile coordinates as users pan and zoom.
Example use cases:
- QGIS
- Felt
- DeckGL
- Mapbox
**2. Specific tile call**
```bash
# Calls a single tile - San Francisco center at zoom 13
https://udf.ai/fc_/my_udf/run/tiles/13/1316/3169?=png
```
Use this to fetch data for one specific tile location.
Or via the Fused Python SDK:
```python showLineNumbers
tile_udf = fused.load("tile_udf")
# With bounds parameter
tile_udf(bounds=bounds)
# With x, y, z parameters
tile_udf(x=1, y=2, z=3)
```
### Example UDF
- Overture Maps Example
- Manipulate _all_ the buildings from the Overture Maps dataset by leveraging Fused ingestion
- Landsat Tile Example
- Returns NDVI tile computed on the fly from Landsat data
## Comparing Single and Tile UDFs
| Feature | Single UDF | Tile UDF |
|---------|------------|-----------|
| UDF Calls | 1 | Multiple |
| Parameters | `bounds` (Optional) | `bounds` or `x`, `y`, `z` |
| Map rendering | Static | Dynamic |
| HTTP Call | Single Call | Tile Server calls or Single Call (specific tile) |
| Runtime Tab display | Unique output of the UDF called | Output of the _latest_ tile called |
| Use Case | Small static data | Calling large dataset through tile server |
## `bounds`
`bounds` is simply a list of 4 coordinates representing the bounds of a geometry. The 4 coordinates represent `[xmin, ymin, xmax, ymax]` of the bounds.
In Fused it is defined with the `fused.types.Bounds` type:
```python showLineNumbers
# doctest: skip
@fused.udf
def udf(bounds: fused.types.Bounds=None):
print(bounds)
>>> [-1.52244399, 48.62747869, -1.50004107, 48.64359255]
```
### `bounds` to `GeoDataFrame`
Converting `bounds` (list of 4 coordinates) to a `GeoDataFrame`:
### Legacy types
Legacy types that might still appear in older UDFs.
#### [Legacy] `fused.types.Tile`
This is a geopandas.GeoDataFrame with `x`, `y`, `z`, and `geometry` columns.
```python showLineNumbers
# doctest: skip
@fused.udf
def udf(bounds: fused.types.Tile=None):
print(bounds)
>>> x y z geometry
>>> 0 327 790 11 POLYGON ((-122.0 37.0, -122.0 37.1, -122.1 37.1, -122.1 37.0, -122.0 37.0))
```
#### [Legacy] `fused.types.TileGDF`
This behaves the same as `fused.types.Tile`.
#### [Legacy] `fused.types.ViewportGDF`
This is a geopandas.geodataframe.GeoDataFrame with a `geometry` column corresponding to the Polygon geometry of the current viewport in the Map.
```python showLineNumbers
# doctest: skip
@fused.udf
def udf(bbox: fused.types.ViewportGDF=None):
print(bbox)
return bbox
>>> geometry
>>> POLYGON ((-122.0 37.0, -122.0 37.1, -122.1 37.1, -122.1 37.0, -122.0 37.0))
```
#### [Legacy] `bbox` object
UDFs defined using the legacy keyword `bbox` are automatically now mapped to `bounds`. Please update your code to use `bounds` directly as this alias will be removed in a future release.
================================================================================
## Run UDFs efficiently
Path: guide/working-with-udfs/udf-best-practices/realtime.mdx
URL: https://docs.fused.io/guide/working-with-udfs/udf-best-practices/realtime
Realtime is the default way to run UDFs—no configuration needed. Every UDF runs in realtime mode unless you explicitly request a batch instance.
This guide covers best practices for calling UDFs from other UDFs and building pipelines. For the full API reference, see the `Udf` class.
## Limits
| Resource | Limit |
|----------|-------|
| Execution time | 120s |
| RAM | ~10GB |
Need more? See Scaling out UDFs.
## Calling another UDF
Load and call UDFs directly:
```python
@fused.udf
def udf():
child = fused.load("child_udf")
result = child(name="hello")
return result
```
[Image: Calling another UDF in workbench]
In Workbench, UDF calls create visual links between parent and child UDFs, making pipelines easy to follow.
For geospatial UDFs, you can pass `bounds` as a bbox list, GeoDataFrame, or tile coordinates. See Reserved parameters.
## Best practices
### Keep results fresh
By default, UDF results are cached. To always get fresh data, disable caching:
```python
@fused.udf(cache_max_age=0)
def udf():
parent = fused.load('parent_udf')
return parent()
```
Setting `cache_max_age=0` means this UDF runs from scratch every time—no caching. Use this when your output depends on frequently changing data.
### Pin to commit hash for production
When loading UDFs from GitHub, pin to a specific commit:
```python
commit_hash = "bdfb4d0"
my_udf = fused.load(f"https://github.com/fusedio/udfs/tree//public/My_UDF/")
result = my_udf()
```
Avoid pointing to `main` branch—your UDF will break when others push changes.
## Warm & cold starts
After inactivity, Fused needs to spin up an instance and load the environment. This **cold start** typically takes **5–15s**.
Once warm, subsequent calls execute within seconds. Instances stay warm for approximately **20 minutes** after the last call. The more active your system is, the more containers remain provisioned—heavy usage keeps the environment hotter.
Keeping Workbench open automatically pings your environment every **2 minutes**, keeping it partially warm with no extra effort.
Fused does not charge for cold start time.
[Image: Cold start vs warm execution]
## When to scale up
| Need | Solution |
|------|----------|
| Run same UDF over multiple inputs | Parallel execution |
| More than 120s or ~10GB | Dedicated instances |
## See also
- Running UDFs — full reference
- `Udf` API reference — all methods and parameters
- Tokens & endpoints — call UDFs via HTTP
- Caching — how caching works
================================================================================
## Write UDFs securely
Path: guide/working-with-udfs/udf-best-practices/security.mdx
URL: https://docs.fused.io/guide/working-with-udfs/udf-best-practices/security
Fused UDFs are flexible, but callers and shared links should be treated with the same care as any public API. The sections below cover secrets, parameters, SQL, paths, and optional canvas passcodes. For **public vs team-only** sharing, session tokens, and HTTPS access rules, see Securing shared tokens.
## Use secrets
Never put passwords or API keys in UDF source. Add them in secrets management, then read them at runtime (for Snowflake, set names like `SNOWFLAKE_USER` and `SNOWFLAKE_PASSWORD` there—see the Snowflake integration guide).
**Do not: hardcode credentials**
Do **not** put real passwords or keys in UDF source. Anyone with repo or UDF access can read them, and they leak in logs and diffs.
**Do: load secrets from secrets management**
Read secrets at runtime with `fused.secret("NAME")` or `fused.secrets["NAME"]` so values stay out of source control.
```python showLineNumbers
@fused.udf
def udf():
conn = snowflake.connector.connect(
user=fused.secrets["SNOWFLAKE_USER"],
password=fused.secrets["SNOWFLAKE_PASSWORD"],
account="your_account_identifier",
warehouse="your_warehouse",
database="your_database",
schema="your_schema",
)
cursor = conn.cursor()
cursor.execute("SELECT CURRENT_VERSION()")
df = cursor.fetch_pandas_all()
cursor.close()
conn.close()
return df
```
### Outputs, logs, and environment
Use `fused.secrets` only inside the UDF (for example to open connections). **Do not** return or print those values.
**`print` statements are also returned to users** — Anything you `print` is also shown to the user as run logs. Treat it like `return`: never print tokens, secret values, full request headers, or anything you would not return.
**Secrets and environment variables** — Do not expose the secrets or environment variables: avoid returning or printing `os.environ`, listing every variable, or similar. Environment variables can include cloud credentials and Fused-managed secrets.
## Narrow parameters
Design the UDF API so callers cannot widen what the code reads or how it queries.
| Prefer | Avoid |
|--------|--------|
| Typed arguments (`limit: int`, `state: str`) | Raw SQL strings from callers |
| A fixed path or table inside the UDF for one-off pipelines | A generic `path` or `sql` parameter (hard to validate, cache, and reason about) |
| Explicit options (`columns`, `order_by` chosen from a small set) | Free-form fragments spliced into queries |
| Serializable **data** (JSON, CSV, numbers, …) | Untrusted pickle; `eval` / `exec` / `compile` on caller input |
## Don’t run caller-supplied code
Parameters should be **data**, not code from callers.
- **`pickle.load` / `pickle.loads`** on untrusted bytes can execute arbitrary code. Do not unpickle caller-controlled input (or unvetted files).
- **`eval` / `exec` / `compile`** on caller-supplied strings — Never. Same for other “run this string as code” patterns.
## DuckDB / SQL patterns
1. **Values (IDs, filters, …)** — Don’t drop them into the SQL with an f-string or `+`. Write `?` where each value goes, then pass the real values in a list: `con.execute("... WHERE x = ?", [value])`. DuckDB treats those as **plain data**, not as extra SQL. For **paths**, fix or strictly validate them—see Do not expose the data source as a parameter.
2. **Column or table names** — You can’t use `?` for names—only for values. Pick allowed names in code (e.g. a Python `set`), reject anything else, then build the small part of the query that contains the name.
(Same pattern in other databases; syntax may differ.)
**Anti-pattern:**
**Safe:**
```python showLineNumbers
@fused.udf
def udf(data_type: str = "type_a"):
path = "s3://bucket/data.parquet"
con = duckdb.connect()
return con.execute(
"SELECT * FROM read_parquet(?) WHERE data_type = ?",
[path, data_type],
).df()
```
**Column name from an allowed list:**
```python showLineNumbers
@fused.udf
def udf(column: str = "data_type"):
path = "s3://bucket/data.parquet"
con = duckdb.connect()
allowed =
if column not in allowed:
raise ValueError("Unsupported column")
query = f'SELECT "" FROM read_parquet(?)'
return con.execute(query, [path]).df()
```
## Do not expose the data source as a parameter
Prefer fixing file paths and table names in the UDF body instead of taking them as arguments. That narrows what the UDF can access and keeps behavior predictable.
A `path` or URL argument lets callers redirect reads to **any** object your runtime can reach (another bucket, a different tenant’s prefix, local files, etc.) unless you maintain a strict allowlist—which is easy to get wrong. **Workbench does not treat path-like parameters as overridable run arguments by default**, to reduce accidental or malicious path substitution. Use fixed locations in code for normal UDFs; the looser `path` example below is only for intentional shared utilities.
**Looser surface area — `path` as a parameter** (reasonable only for a reusable “preview any file”–style tool):
```python showLineNumbers
@fused.udf
def preview_parquet(path: str, number_rows_to_preview: int = 10):
con = duckdb.connect()
return con.execute(
"SELECT * FROM read_parquet(?) LIMIT ?",
[path, number_rows_to_preview],
).df()
```
**Tighter surface area — path fixed inside the UDF:**
```python showLineNumbers
@fused.udf
def udf(number_rows_to_preview: int = 10):
path = "s3://fused-users/fused/my-user/my_file.parquet" # change to your own path
con = duckdb.connect()
return con.execute(
"SELECT * FROM read_parquet(?) LIMIT ?",
[path, number_rows_to_preview],
).df()
```
Predictable inputs improve safety and caching.
## Canvas access and shared tokens
How **public** and **team-only** canvas sharing work, when to split UDFs across canvases, and how **session tokens** (Workbench or service account) apply to UDF URLs are documented in Securing shared tokens.
## Protect endpoints with Canvas passcode
You can require a **canvas-wide passcode** in Canvas settings so viewers must enter it before the canvas loads. **Canvas passcode is only available for canvases that are shared publicly** (not team-only). UDFs on those canvases use the same protection when called through shared links.
[Image: Canvas settings: Passcode protection with Require passcode, set passcode field, and Save]
### Accessing Canvas with passcode
Anyone who opens the shared canvas link is prompted for the passcode before the canvas loads.
### Accessing UDFs with passcode
Opening a UDF as an API requires sending the passcode in an `Authorization` header:
Curl request:
```bash
curl -s \
-H 'authorization: fused-canvas-passcode ' \
"https://udf.ai//my_udf.json"
```
Python request:
```python
response = requests.get(
"https://udf.ai//my_udf.json",
headers=
)
```
## See also
- Securing shared tokens — public vs team-only, session tokens, service accounts
- Shared Tokens
- Secrets Management
- Amazon S3 integration — connect S3 buckets, including SSE-KMS encrypted buckets
================================================================================
## Storage options
Path: guide/working-with-udfs/udf-best-practices/storage.mdx
URL: https://docs.fused.io/guide/working-with-udfs/udf-best-practices/storage
Fused provides two file systems to make files accessible to all UDFs: an S3-backed home directory and a disk. Access is scoped at the organization level.
## Home directory
Fused provisions a private home directory in S3 for your account. Paths look like `s3://fused-users/fused/aman/` and are ideal for large-scale, cloud-native, or globally accessible datasets such as ingested tables, GeoTIFFs, and files that need to be read outside of Fused.
Use the File explorer to browse your home directory and confirm the exact path attached to your account.
[Image: file explorer]
```python showLineNumbers
job = fused.ingest(
input="https://www2.census.gov/geo/tiger/TIGER_RD18/STATE/06_CALIFORNIA/06/tl_rd22_06_bg.zip",
output="s3://fused-users/fused/aman/census/ca_bg_2022/", # change to your own path
).run_batch()
```
## `/mnt/cache` disk
`/mnt/cache` is the path to a mounted disk to store files shared between UDFs. This is where `@fused.cache` and `fused.download` write data. It's ideal for files that UDFs need to read with low-latency, downloaded files, the output of cached functions, access keys, `.env`, and ML model weights.
UDFs may interact with the disk as with a local file system. For example, to list files in the directory:
```python showLineNumbers
@fused.udf
def udf():
for each in os.listdir('/mnt/cache/'):
print(each)
```
### Troubleshooting
If you encounter the following error, it means `/mnt/cache` is not yet configured for your environment. To resolve this issue, please contact the Fused team to enable it.
```text
Error: No such file or directory: '/mnt/cache/'
```
================================================================================
## Un-pythonic aspects of Fused
Path: guide/working-with-udfs/udf-best-practices/unpythonic.mdx
URL: https://docs.fused.io/guide/working-with-udfs/udf-best-practices/unpythonic
Fused UDFs look like Python functions but run in a managed, distributed environment. That environment imposes a few constraints that feel unusual if you're used to writing standard Python scripts.
## Imports must be inside the UDF
In regular Python you put imports at the top of the file. In a Fused UDF they must go **inside** the function body:
Why: Fused serializes and ships your UDF function to a remote worker. Only the function body travels — the surrounding module scope does not. Any name referenced at module level won't exist on the worker when the function runs.
## Fused serialises the outputs
UDFs must return a value that Fused can serialize and send back to the caller. Anything else will fail at return time. See Output formats for the full list of supported types.
Result serialization failed: `ValueError: Return value not in an expected vector format (gpd.GeoDataFrame, pd.DataFrame, gpd.GeoSeries, pd.Series, shapely geometry) Was: `
## Leverage `udf.map()` for multi processing
`@fused.udf` turns your function into a `Udf` object — by default, calling it submits a job to Fused's remote workers, not a local Python call. `udf.map()` gives you flexibility over execution:
- `engine='remote'` (default) — fans out and spins up new UDFs
- `engine='local'` — runs multiple UDFs in parallel using the current UDF's available cores and memory
```python
# doctest: skip
pool = my_udf.map(list_of_inputs)
pool.wait()
results = pool.df()
```
We built `udf.map()` as a simple way to parallelize jobs either locally in your current UDF or remotely by spinning up new compute as you need it on demand.
See Scaling out UDFs.
## Reuse UDFs with `fused.load()`
Reusing a UDF is done with `fused.load()` with a UDF name or URL rather than a Python import:
```python
other_udf = fused.load("https://github.com/fusedio/udfs/tree/main/public/DuckDB_H3_Example")
```
You're not just importing the code — you're importing the whole UDF, which lets you:
- Inspect it: `other_udf.meta`
- Execute it directly: `other_udf(params)`
- Run it in parallel: `other_udf.map(list_of_inputs)`
## Fused environments come with predefined packages
Fused provides a hosted environment with the most common Python packages for data manipulation. See the full list in Dependencies.
Packages not supported? Reach out to `info@fused.io`.
## See also
- Writing UDFs
- Efficient caching
- Scaling out UDFs
================================================================================
## Working as a team
Path: guide/working-with-udfs/udf-best-practices/version-control.mdx
URL: https://docs.fused.io/guide/working-with-udfs/udf-best-practices/version-control
# Working as a team
**Prerequisite:** GitHub integration setup
By connecting a canvas to a GitHub repository, your team can collaborate on UDFs through pull requests, pull the latest changes back into the canvas, and share the canvas via a permanent link tied to your org rather than an individual user.
Here's what we'll do:
1. Save the canvas state as a **checkpoint** and push the UDFs to a shared GitHub repo via a PR
2. Pull any GitHub changes back into the canvas
3. Configure canvas access and generate a shared team link
## Step 1: Create a checkpoint and open a PR
A checkpoint saves the current state of your canvas so you can push it to GitHub or restore it later.
Open your canvas and click the **checkpoint icon** (🕐) in the top toolbar (step 1 below). This opens the **Canvas checkpoints** panel. Click **+ Create checkpoint**, give it a name, and click **Create**.
Once the checkpoint is saved, click **Create a PR** next to it. Fill in the **folder name** (the directory it will be pushed to in the repo), select the **repository**, and confirm the commit message — then click **Create PR** (step 2 below).
Changing the access setting automatically creates a PR on the linked repository to change shared_token.json. The access change takes effect only after the PR is merged.
The canvas is now accessible at a permanent URL in the format:
```
https://fused.io/canvas/fc_/
```
This link is scoped to your team. Anyone outside the team — or accessing it in incognito — will see:
```
Error loading canvas fc_/:
```
## What this enables
- **Stable canvas URL** — the link is tied to the org, not an individual user. It stays the same when team members rotate.
- **GitHub-based collaboration** — multiple people can contribute changes through PRs. Pull updates into the canvas whenever you're ready to reflect them.
- **Works with AI coding tools** — clone the repo locally, ask Claude Code to make changes, open a PR, merge it, then pull into the canvas.
## Calling team UDFs
```python
# Tracks main — always latest
my_udf = fused.load("team/my_udf")
my_udf()
```
Pin to a specific commit to avoid breaking changes when `main` updates:
```python
# doctest: skip
# Pinned to a specific commit
✅ my_udf = fused.load("https://github.com/org/repo//my_udf")
# Follows main — may break if main changes
❌ fused.load("team/my_udf")
❌ fused.load("https://github.com/org/repo/main/my_udf")
```
See all ways to load a UDF.
## See also
- Calling UDFs — how to call UDFs from other UDFs
- Git Integration — how to integrate your own repositories with Fused
- Canvas checkpoints — more on saving and restoring canvas state
================================================================================
## Why Fused
Path: guide/working-with-udfs/why-fused.mdx
URL: https://docs.fused.io/guide/working-with-udfs/why-fused
# Why Fused
At Fused, our mission is to help get things done, fast. We want every team to be able to get from **Analytics to Action** as quickly as they can.
We also deeply believe AI is changing the way we work. So here's Notebook LLM telling you all about Fused in 5min:
## Our core beliefs
We believe every Analytics team should have the tools to:
- 🌍 Answer the big picture problems first;
- 💡 Iterate on their analysis when new data & algorithms becomes available;
- 🏃 Ship a first version rather than getting it perfect;
- 📊 Visualize & report their work to anyone in their team.
## User Defined Functions
A lot of the tools Analytics teams have today slow the process down:
- Python dependency management gets in the way of getting work done.
- A lot of the scientific Python tooling focused more on getting the result down to 10 decimal places rather than answering the big picture
That's why we built Fused around User Defined Functions (UDFs).
[Image: udf pipeline]
UDFs are the DNA of analytics. They are Python functions that can be called from anywhere:
- 🐍 No environment setup: Just start writing Python immediately.
- 🔗 Shareable as HTTPS endpoints in 2 clicks: Ship your work to the rest of the team
- 🔄 Iterable: Edit your code, Save, and see the results downstream immediately.
- 🚀 Scales with your hardware requirements: From running a subset of data to analyzing the entire world.
## UDFs are the DNA of analytics
Making every process of your Analytics a UDF makes it faster:
- **Data needs to be ingested constantly**: UDFs can be edited as datasets change & evolve. They get updated when you save them.
- **New algorithms come and go**: UDFs allow you to iterate on existing data and swap out just what you need.
- **Reporting & Visualization evolve**: UDFs can take your analysis and render it in dynamic ways.
## From your laptop to the World
Look, we know that many Analytics projects start in a notebook on a laptop.
- 💻 Start by running UDFs locally, then in 2 lines of code scale to datasets the size of the world
- 🌍 UDFs can be called from anywhere: From a notebook, a frontend application or integration platforms
- 🔀 Work locally or in Workbench, our browser based IDE interchangeably
## Efficiently Scaling
Because Fused is built for scale:
- ☁️ Serverless computing: No servers to provision or keep running — Fused spins up compute when your code runs and shuts it down when it's done, so you only pay for the processing you actually use
- ⚡️ Caching makes recurring calls faster & cheaper
## Get started using UDFs right now
Check out:
- ⚡️ The Getting Started guide: Learn how to use UDFs in 5 minutes
- 📚 Writing UDFs: Everything you need to know about building UDFs
- 🎓 Our Examples: Real world examples of how to use UDFs
================================================================================
## Writing UDFs
Path: guide/working-with-udfs/writing-udfs.mdx
URL: https://docs.fused.io/guide/working-with-udfs/writing-udfs
[Image: udf anatomy]
Follow these steps to write a User Defined Function (UDF).
- Decorate a function with `@fused.udf`
- Declare the function logic
- Optionally cache parts of the function
- Set typed parameters to dynamically run based on inputs
- Return a vector table or raster
- Save the UDF
## `@fused.udf` decorator
First decorate a Python function with `@fused.udf` to tell Fused to treat it as a UDF.
## Function declaration
Next, structure the UDF's code. Declare import statements within the function body, express operations to load and transform data, and define a return statement. This UDF is called `udf` and returns a `pd.DataFrame` object.
```python showLineNumbers
@fused.udf # <- Fused decorator
# highlight-start
def udf(name: str = "Fused"): # <- Function declaration
return pd.DataFrame(!']})
# highlight-end
```
The UDF Builder in Workbench imports the `fused` module automatically. To write UDFs outside of Workbench, install the Fused Python SDK with `pip install fused` and import it with `import fused`.
Placing import statements within a UDF function body (known as "local imports") is not a common Python practice, but there are specific reasons to do this when constructing UDFs. UDFs are distributed to servers as a self-contained units, and each unit needs to import all modules it needs for its execution. UDFs may be executed across many servers (10s, 100s, 1000s), and any time lost to importing unused modules will be multiplied.
An exception to this convention is for modules used for function annotation, which need to be imported outside of the function being annotated.
## `@fused.cache` decorator
Use the @fused.cache decorator to persist a function's output across runs so UDFs run faster.
```python showLineNumbers
@fused.udf # <- Fused decorator
def udf(bounds: fused.types.Bounds = None, name: str = "Fused"):
# highlight-start
@fused.cache # <- Cache decorator
def structure_output(name):
return pd.DataFrame(!']})
# highlight-end
df = structure_output(name)
return df
```
## Typed parameters
UDFs resolve input parameters to the types specified in their function annotations.
This example shows the `bounds` parameter typed as `fused.types.Bounds`
and `name` as a string.
```python showLineNumbers
# doctest: skip
@fused.udf
def udf(
bounds: fused.types.Bounds = None, # <- Typed parameters
name: str = "Fused"
):
```
To write UDFs that run successfully as both `File` and `Tile`, set `bounds` as the first parameter, with `None` as its default value. This enables the UDF to be invoked successfully both as `File` (when `bounds` isn't passed) and as `Tile`. For example:
```python showLineNumbers
@fused.udf
def udf(bounds: fused.types.Bounds = None):
...
return ...
```
### Supported types
Fused supports a wide range of parameter types for UDFs. Parameters without a specified type are handled as strings by default.
| Type | Description | Serialization Format |
|------|-------------|----------------------|
| `str` | String values | Any string value |
| `int` | Integer values | Numeric strings or integers |
| `float` | Floating point values | Numeric strings or floats |
| `bool` | Boolean values | Strings "true"/"false" (case-insensitive) |
| `list` | List of values | JSON-serialized list |
| `dict` | Dictionary of key-value pairs | JSON-serialized dict strings |
| `tuple` | Tuple of values | JSON-serialized list |
| `uuid.UUID` | UUID values | UUID strings |
| `pd.DataFrame` | Pandas DataFrame | JSON-serialized table strings |
| `gpd.GeoDataFrame` | GeoPandas GeoDataFrame | GeoJSON strings or bbox arrays |
| `shapely.Geometry` | Shapely geometry objects | WKT strings |
| `fused.types.Bounds` | Bounding box as `[minx, miny, maxx, maxy]` | Bbox array or GeoJSON |
| `fused.types.Bbox` | Bounding box as Shapely geometry | Bbox array or GeoJSON |
| `fused.types.TileXYZ` (Legacy) | Mercantile tile coordinates | Bbox array or GeoJSON |
| `fused.types.TileGDF` (Legacy) | GeoDataFrame with x/y/z tile columns | Bbox array or GeoJSON |
| `fused.types.ViewportGDF` (Legacy) | GeoDataFrame for viewport (no x/y/z) | Bbox array or GeoJSON |
The Map Builder runs the UDF as a Map Tile if the first parameter is typed as `fused.types.Bounds`.
### `pd.DataFrame` as JSON
Pass tables and geometries as serialized UDF parameters in HTTPS calls. Serialized JSON and GeoJSON parameters can be casted as a `pd.DataFrame` or `gpd.GeoDataFrame`. Note that while Fused requires import statements to be declared within the UDF signature, libraries used for typing must be imported at the top of the file.
```python showLineNumbers
# doctest: skip
@fused.udf
def udf(
gdf: gpd.GeoDataFrame = None,
df: pd.DataFrame = None
):
```
## Reserved parameters
When running a UDF with `fused.run`, it's possible to specify the map tile Fused will use to structure the `bounds` object by using the following reserved parameters.
### With `x`, `y`, `z` parameters
```python showLineNumbers
overture_udf = fused.load("UDF_Overture_Maps_Example")
overture_udf(x=5241, y=12662, z=15)
```
### Passing a `GeoDataFrame`
```python showLineNumbers
# doctest: skip
bounds = gpd.GeoDataFrame.from_features(,"geometry":,"id":1}]})
overture_udf(bounds=bounds)
```
### Passing a bounding box list
You can also pass a list of 4 points representing `[min_x, min_y, max_x, max_y]`
```python showLineNumbers
# doctest: skip
overture_udf(bounds=[-122.349, 37.781, -122.341, 37.818])
```
### Import functions from other UDFs
UDFs can import functions from other UDFs with `fused.load` in the UDFs GitHub repo or private GitHub repos. Here the commit SHA `05ba2ab` pins the UDF to specific commit for version control (see pinning to commit hash).
```python showLineNumbers
common = fused.load("https://github.com/fusedio/udfs/tree/b672adc/public/common/")
```
## Return values
UDFs can return the following types of objects. Fused will try to convert the returned object to the requested file format.
### Tables
- `pd.DataFrame`, `pd.Series`, `gpd.GeoDataFrame`, `gpd.GeoSeries`, `shapely.Geometry`
- Arrow-compatible objects (e.g., from DuckDB)
### Arrays
- `numpy.ndarray`, `xarray.Dataset`, `xarray.DataArray`
- `bytes` or `io.BytesIO` are treated as raster images and returned as-is with the raster MIME type.
For the default `png` format (when rendered in workbench), there are some additional limitations:
- Arrays must be 2D or higher, 1D arrays are not supported (prefer returning lists for 1D array instead).
- Rasters without spatial metadata should indicate their tile bounds
When calling the UDF directly (or using the `npy` format), those restrictions
do not apply to `numpy.ndarray`, and numpy arrays as return value are supported in general.
### Simple Python objects
- `int`, `float`, `str`, `list`, `tuple`, `set`, `np.integer`, `np.floating`, `NoneType`
`str` is handled as HTML by default. Other types are encoded as JSON.
### Dictionaries
`dict` objects are useful for returning multiple values, e.g., dictionaries of raster numpy arrays. Dictionary values can be any of the types above, while keys must be strings.
## Save UDFs
UDFs exported from the Map Builder or saved locally are formatted as a `.zip` file containing associated files with the UDFs code, `utils` Module, metadata, and `README.md`.
```
└── Sample_UDF
├── README.MD # Description and metadata
├── Sample_UDF.py # UDF code
└── meta.json # Fused metadata
```
### In Python: `.to_fused()`
When outside of Workbench, save UDF to your local filesystem with `my_udf.to_directory('Sample_UDF')` and to the Fused cloud with `my_udf.to_fused()`.
This will allow you to access your UDF using a token, from a GitHub commit, or directly import it in Workbench from a GitHub URL. See the `Udf.to_fused()` API reference for the full signature and parameters.
### In Workbench: Saving through Github
You can also save your UDFs directly through GitHub as personal, team or community UDF. Check out the Contribute to Fused to see more.
## Update tags and metadata
Modify the UDF's metadata to manage custom tags that persist across the local filesystem, the Fused Cloud, and your team's GitHub repo.
```python showLineNumbers
# Assumging my_udf was loaded or created above
my_udf.metadata['my_company:tags']=['tag_1', 'tag_2']
# Push to Fused
my_udf.to_fused()
# You can reload your UDF and see the updated metadata
fused.load('my_udf').metadata
```
## Security
URL and tool inputs should be treated as untrusted: narrow parameters, validate identifiers, and bind query values. See Security best practices for UDFs.
## Debug UDFs
#### UDF Builder
A common approach to debug UDFs is to show intermediate results in the UDF Builder runtime panel with `print` statements.
#### HTTPS requests
When using HTTPS requests, any error messages are included in the `X-Fused-Metadata` response header. These messages can be used to debug. To inspect the header on a browser, open the Developer Tools network tab.
[Image: network]
================================================================================
# QUICKSTART
## Data Analytics
Path: quickstart/data-analytics.mdx
URL: https://docs.fused.io/quickstart/data-analytics
# Data Analytics
Quick links for data analysts using Fused.
## Getting Started
- Write your first UDF
- Workbench intro
- Using AI to build
## Explore & Transform Data
- Read data
- Caching for faster iteration
## Build Visualizations
- Interactive charts
- Dashboards
- Standalone maps
## Export & Share
- Download data
- Share via tokens & endpoints
- MCP servers (AI tools)
## Examples
- Zonal stats
- Interactive charts
- Site selection analysis
- Canvas gallery
================================================================================
## Data Engineering
Path: quickstart/data-engineering.mdx
URL: https://docs.fused.io/quickstart/data-engineering
# Data Engineering
Quick links for data engineers using Fused.
## Connect Your Data
- Local files (drag & drop)
- Cloud storage (S3/GCS)
- Snowflake, BigQuery
## Data Formats
- Reading data
- Writing data
## Turn Data into APIs
- Shared tokens & endpoints
- Calling UDFs as API
- Download options
## Execution
- Realtime execution
- Scaling out UDFs — parallel execution and dedicated instances
## Advanced Setup
- Environment variables & secrets
- Dependencies
- Git integration
- On-prem setup
## Examples
- Realtime filtering
- Dark vessel detection (AIS ingestion)
================================================================================
## Data Science
Path: quickstart/data-science.mdx
URL: https://docs.fused.io/quickstart/data-science
# Data Science
Quick links for data scientists using Fused.
## Getting Started
- Write your first UDF
- Using AI to build
## Working with Data
- Read data
- Write data
## Execution & Performance
- Caching
- Scaling out UDFs — parallel execution and dedicated instances
## Building Outputs
- Interactive charts
- Dashboards
## Examples
- Zonal stats
- PDF scraping
- Web scraping
================================================================================
## Geospatial
Path: quickstart/geospatial.mdx
URL: https://docs.fused.io/quickstart/geospatial-cheatsheet
# Geospatial
Quick links for geospatial workflows in Fused.
## Data Sources
- STAC catalogs
- Google Earth Engine
- Cloud storage (S3/GCS)
## Reading & Writing
- Reading geospatial data
- Writing geospatial data
- Data ingestion (large datasets)
## Spatial Processing
- Geospatial Single vs Tile
## H3 Hexagonal Analytics
- Why H3
- Resolution guide
- Converting to H3
- Aggregations
- Joining datasets
- H3 visualization
## Export & Integrations
- Geospatial exports (DeckGL, Felt, etc.)
- Standalone maps
## Examples
- Zonal statistics
- Climate dashboard
- Dark vessel detection
- Satellite imagery
- Canvas gallery
================================================================================
# EXAMPLES
## Detecting Land-Cover Change from Space with AI Embeddings
Path: examples/ai-change-detection.mdx
URL: https://docs.fused.io/examples/ai-change-detection
This canvas does change detection on top of an AI embedding dataset instead of raw satellite imagery — and because every pixel is already a 64-dimensional vector, the detection itself is just a cosine distance between this year's vector and last year's. No image-processing code, no imagery to download, no infrastructure to stand up: the whole thing is a handful of serverless UDFs that read only the two years you asked for. Draw a box anywhere on Earth, pick a year, and three synchronized maps show you the landscape, its structure, and where things changed.
## Try it out
**Open the Canvas →**
The canvas uses public data so it runs out-of-the-box. If you want to tweak the UDFs — adjust the color stretch, add a threshold mask,
## What you can do with it
This canvas is useful whenever you need to quickly answer questions like:
- **Which fields were harvested or rotated?** Bright pixels in the change map appear where the crop cycle shifted year to year.
- **Where did new development happen?** Roads, buildings, and cleared land all register as high-change areas.
- **How stable is this landscape?** Dark areas in the change map haven't changed meaningfully in years.
The dataset covers the whole globe from 2017 to 2025, so you can explore any region — not just a pre-selected area.
## How the canvas is organized
The canvas has one control node that feeds three analysis nodes. Change the AOI or the year in the first node, and all three maps update automatically.
### 1 · Select area + year
Draw a bounding box on the satellite basemap and pick a year (2017–2025). The widget ships pre-loaded with an AOI over Adana, Turkey — a good starting point because the agricultural fields there show clear seasonal patterns. Click **Set parameters** to broadcast your selection to the three nodes below.
### 2 · RGB (embedding bands 0–2)
Renders the first three of the 64 embedding bands as a false-color RGB image for the chosen year. Think of this as a "what does this place look like to the model" view — a baseline to orient yourself before looking at the change map. Bands are stretched on their own 1–99th percentiles so the image is always well-exposed regardless of the area.
### 3 · PCA of the full embedding
All 64 embedding dimensions are compressed to three using PCA (NumPy SVD on a pixel sample), then mapped to RGB. The dominant variance in the landscape — field boundaries, crop types, bare soil — pops out in this view in ways that raw satellite bands often don't show clearly. Stretched on 2–98th percentiles.
### 4 · Cosine-distance change map
This is the core of the canvas. For each pixel, it computes the cosine distance between the 64-dimensional embedding vector in year Y and year Y−1. The result is rendered with the magma colormap: **bright = large change, dark = stable**.
The key thing is that it compares *embedding vectors*, not raw pixel brightness. That means it picks up semantic change — a field going from fallow to irrigated crops — rather than lighting differences between two satellite passes. Only the two years being compared are read from the store, so queries stay fast.
## About the data
The canvas reads from the **AlphaEarth Foundations (AEF)** mosaic published by Taylor Geospatial Labs on Source Cooperative. The store is a public, anonymous GeoZarr — no credentials needed.
| Property | Value |
|---|---|
| Dataset | AlphaEarth Foundations (AEF) embedding mosaic |
| Publisher | Taylor Geospatial Labs via Source Cooperative |
| Format | GeoZarr v3, EPSG:4326, int8 |
| Coverage | Global |
| Years available | 2017–2025 |
| Embedding size | 64 dimensions per pixel |
## See also
- **Temporal Pixel Analysis** — plot NDVI time-series curves for individual fields over Sentinel-2 imagery, rather than a spatial change map.
- **Geospatial processing guide** — how tile-based UDFs work under the hood.
- **Caching in Fused** — why repeated queries on the same AOI return so fast.
================================================================================
## Letting Anyone Explore Airbnb on the Fly
Path: examples/airbnb-explore-on-the-fly.mdx
URL: https://docs.fused.io/examples/airbnb-explore-on-the-fly
This example shows how to load, visualize, and interactively explore Airbnb listing data from San Francisco — nearly 8,000 points covering locations, property types, capacity, reviews, and pricing — using a Fused Canvas with an AI-powered chat widget that lets anyone ask questions and reshape the visualization in real time.
*Walkthrough: Exploring Airbnb data with a Fused AI widget. Try the Canvas*
Airbnb publishes detailed listing data for cities around the world, but exploring it usually means downloading CSVs and writing one-off scripts. With Fused, you can load the dataset into a Canvas, visualize it on a map, and attach an AI chat widget so anyone — technical or not — can ask questions and get instant visual answers.
## Building the canvas
### 1. Load the Airbnb dataset
The `airbnb_data` UDF reads a Parquet file containing ~7,800 San Francisco Airbnb listings from S3. Each row includes the listing's location, neighbourhood, property type, capacity, review scores, and pricing. The data is cached so subsequent runs load instantly.
```python
@fused.udf
def udf():
@fused.cache
def load_data():
return pd.read_parquet("s3://fused-sample/demo_data/airbnb_listings_sf.parquet")
df = load_data()
print(df.head())
print(df.dtypes)
print(df.shape)
return df
```
### 2. Connect a Widget Builder to visualize the data
The `airbnb_data` UDF returns a DataFrame. To visualize it, we connect it to a widget by drawing an edge from the UDF node to the widget node in the Canvas.
We use a `widget-builder` here because it wraps any chart type and layers on an AI panel — so users can modify the visualization with natural language without touching JSON. In this example we plot a bar chart of the top 15 neighbourhoods by average price:
```json
} GROUP BY neighbourhood_cleansed ORDER BY value DESC LIMIT 15",
"title": "Top 15 Neighbourhoods"
}
},
"aiBuilderMode": true,
"aiPanel": "right"
}
}
```
Notice the `}` in the SQL — this is the widget template syntax. Because the widget is connected to the `airbnb_data` UDF via an edge, the name inside `}` resolves automatically to that UDF's output. You just reference the UDF by name and the widget handles the rest.
- **`aiBuilderMode: true`** — activates the built-in AI panel so users can describe changes in natural language.
- **`aiPanel: "right"`** — positions the AI chat on the right side of the widget.
The AI panel rewrites the inner widget definition based on your prompt. Try things like:
- *"Switch to a pie chart of property types"*
- *"Show a histogram of review scores"*
- *"Map the most expensive listings"*
- *"Show average price by room type as a horizontal bar chart"*
See the AI-driven widget guide for all available props and widget types.
### 3. Explore the data interactively
With the AI panel enabled, anyone can reshape the visualization without writing code. Ask for ratings distributions, price comparisons across neighbourhoods, capacity breakdowns — the AI rewrites the widget definition on the fly, and the chart updates instantly. This turns a static dashboard into a conversational data exploration tool.
### 4. Share with anyone
The Canvas can be shared as a link or as a standalone widget. Share the full Canvas for the complete experience (map + widget + AI chat), or share just the widget for a focused, embeddable view that anyone can interact with — no Fused account required.
## Try it out
Open the Fused Canvas to explore the live Airbnb dataset, or go straight to the interactive widget to ask questions directly.
================================================================================
## AIS Dark Vessel Detection
Path: examples/ais-dark-vessels.mdx
URL: https://docs.fused.io/examples/ais-dark-vessels
_A complete example show casing how to use Fused to ingest data into a geo-partitioned, cloud friendly format, process images & vectors and use UDFs to produce an analysis_
### Requirements
- Access to Fused
- Access to a Jupyter Notebook
- Installing `fused` with `[all]` dependencies (mainly to have `pandas` & `geopandas`):
```bash showLineNumbers
pip install "fused[all]"
```
## 1. The problem: Detecting illegal boats
Monitoring what happens at sea isn't the easiest task. Shores are outfitted with radars and each ship has a transponder to publicly broadcast their location (using Automatic Identification System, AIS), but ships sometimes want to hide their location when taking part in illegal activities.
Global Fishing Watch has reported on "dark vessels" comparing Sentinel 1 radar images to public AIS data and matching the two to compare where boats report being versus where they _actually_ are.
In this example, we're going to showcase a basic implementation of a similar analysis to identify _potential_ dark vessels, all in Fused.
[Image: Dark Vessel Detection workflow]
Here's the result of our analysis, running in real time in Fused:
For the nerds out there, we're using the Ground Range Detected product, not the Radiometrically Terrain Corrected because we're looking at boats in the middle of the ocean, so terrain shouldn't be any issue.
- This dataset is available as Cloud Optimized GeoTiff through a STAC Catalog, meaning we can directly use this data as is.
### 3.2 - Writing a UDF to open each AIS dataset
The rest of the logic is write a UDF to open each file, read it as a CSV and write it to parquet.
```python showLineNumbers
@fused.udf()
def read_ais_from_noaa_udf(datestr:str='2023_03_29', overwrite:bool=False):
# This is the specific URL where daily AIS data is available
url=f'https://coast.noaa.gov/htdata/CMSP/AISDataHandler//AIS_.zip'
# This is our local mount file path
path=fused.file_path(f'/AIS//')
daily_ais_parquet = f'/.parquet'
# Skipping any existing files
if os.path.exists(daily_ais_parquet) and not overwrite:
print(f' exist')
return pd.DataFrame()
# Download ZIP file to mounted disk
r=requests.get(url)
if r.status_code == 200:
with zipfile.ZipFile(io.BytesIO(r.content), 'r') as z:
with z.open(f'AIS_.csv') as f:
df = pd.read_csv(f)
# MMSI is the unique identifier of each boat. This is a simple clean up for demonstration
df['MMSI'] = df['MMSI'].astype(str)
df.to_parquet(daily_ais_parquet)
print(f"Saved ")
return pd.DataFrame()
else:
return pd.DataFrame(']})
```
We can run this UDF a single time to make sure it works:
```python showLineNumbers
# doctest: skip
single_ais_month = fused.run(read_ais_from_noaa_udf, datestr="2024_09_01")
>>> Saved /mnt/cache/AIS/2024_09/01.parquet
```
To recap what we've done so far:
- Build a UDF that takes a date, fetches a `.zip` file from NOAA's AISDataHandler portal and saves it to our UDFs' mount (so other UDFs can access it)
- Run this UDF 1 time for a specific date
### 3.3 - Run this UDF over a month of AIS data
Next step: Run this for a whole period!
Since each UDF takes a few seconds to run per date, we're going to use `fused.submit()` to call a large numbers of UDFs all at once that will each run over a single date.
With a bit of Python gymnastics we can create a `DataFrame` of all the dates we'd like to process. Preparing to get all of September 2024 would look like this:
```python showLineNumbers
# doctest: skip
# Run this locally - not in Workbench
date_ranges = pd.DataFrame()
print(f"")
print(date_ranges.head())
>>> date_ranges.shape=(30, 1)
datestr
0 2024_09_01
1 2024_09_02
2 2024_09_03
3 2024_09_04
4 2024_09_05
```
`fused.submit()` requires inputs as a list or `DataFrame`, in which case columns should have the argument names that our UDF expects, in this case `datestr`. We also recommend you always do a first run with `debug_mode=True` to test your submit job:
```python showLineNumbers
# doctest: skip
fused.submit(
read_ais_from_noaa_udf,
date_ranges,
debug_mode=True
)
>>> Saved /mnt/cache/tmp/AIS/2024_09/01.parquet
|status | file_path
-------------------------------------------------
0 |Done | /mnt/cache/tmp/AIS/2024_09/01.parquet
```
`debug_mode=True` runs the 1st value inside `date_ranges` with `fused.run()`. This allows you to make sure your UDF + arg_list combo is working properly.
Now that we've seen our UDF is working we can run all 30 jobs in parallel by removing `debug_mode=True`:
```python showLineNumbers
fused.submit(read_ais_from_noaa_udf, date_ranges)
```
We've now unzipped, opened & saved 30 days of data!
`fused.submit()` has more parameters you can control allowing you to change the number of `max_workers`, `engine` or the retry policies. Also take a look at the technical docs for more details.
One handy way to make sure our data is in the right place is to check it in the Workbench File Explorer. In the search bar type: `file:///mount/AIS/2024_09/`:
[Image: Pool Runner live results]
You'll see all our daily files! Notice how each file is a few 100 Mb. These files are still big individual files, i.e. would take a little while to read.
### 3.4 - Ingest 1 month of AIS data into a geo-partitioned format
These individual parquet files are now store on our mount disk. We could save them directly onto cloud storage but before that we can geo-partition them to make them even faster to read. This will make us reduce the time it takes to access our data from minutes to seconds.
Fused provides a simple way to do this with the ingestion process.
[Image: A simple overview of Geoparquet benefits]
_Image credit from the Cloud Native Geo slideshow_
To do this we need a few things:
- **Our input dataset**: in this case our month of AIS data.
- **A target cloud bucket**: We're going to create a bucket to store our month of geo-partitioned AIS data in parquet files
- A target number of chunks to partition our data in. For now we're going to keep it at 500
- Latitude / Longitude columns to determine the location of each point
```python showLineNumbers
ais_daily_parquets = [f'file:///mnt/cache/AIS//.parquet' for day in range_of_ais_dates]
job = fused.ingest(
ais_daily_parquets,
's3://fused-users/fused/demo_user/AIS_2024_ingester/prod_2024_09',
target_num_chunks=500,
lonlat_cols=('LON','LAT')
)
```
We'll send this job to a large instance using `job.run_batch()` as we latency doesn't matter much (we can wait a few extra seconds) and we'd rather have a larger machine & a larger storage:
```python showLineNumbers
# doctest: skip
job.run_batch(
instance_type='r5.8xlarge', # We want why big beefy machine to do the partitioning in parallel, so large amounts of CPUs
disk_size_gb=999 # Set a large amount of disk because this job will open each output parquet file to calculate centroid
)
```
Running this in a notebook gives us a link to logs so we can follow the progress of the job on the offline machine:
[Image: Workbench run remote logs]
Following the link shows us the live logs of what our job is doing:
[Image: Workbench run remote logs]
We can once again check that our geo-partitioned images are available using File Explorer. This time because our files are a lot faster to read we can even see the preview in the map view:
Our AIS data is ready to be use for the entire month of September 2024. To narrow down our search, we now need to get a Sentinel 1 image. Since these images are taken every 6 to 12 days depending on the region, we'll find a Sentinel 1 image and then narrow our AIS data to just a few minutes before and after the acquisition time of the Sentinel 1 image.
## 4. Retrieving Sentinel 1 images
Sentinel 1 images are free & open, so thankfully for us others have already done the work of turning the archive into cloud native formats (and continue to maintain the ingestion as new data comes in).
We're going to use the Microsoft Planetary Computer Sentinel-1 Ground Range Detected dataset, because it offers:
- Access through a STAC Catalog helping us only get the data we need and nothing else
- Images are in Cloud Optimized Geotiff giving us tiled images that load even faster
- Examples of how to access the data so most of our work will be copy pasta
Most of the following section was written in Workbench's Map Builder rather than in Jupyter Notebooks.
We'll have the code in code blocks, you can run these anywhere but as we're looking at images, it's helpful to have Map Builders' live map updated as you write your code.
Map Builder is deprecated and hidden by default. To follow along you can re-enable it under Workbench Preferences → **Deprecated features** → **Enable map view**. For new work, use the Fused Map widget instead — see the Widget API for all available widgets.
Let's start with a basic UDF just returning our area of interest:
```python showLineNumbers
@fused.udf
def udf(
bounds: fused.types.Bounds,
):
common = fused.load("https://github.com/fusedio/udfs/tree/fbf5682/public/common/")
# Convert bounds to GeoDataFrame using Fused common function
bounds = common.bounds_to_gdf(bounds)
return bounds
```
The code above demonstrates a basic User-Defined Function (UDF) that utilizes Fused's common functions. These utilities provide a some general functions for geospatial operations and transformations.
The utility function `bounds_to_gdf` is mentioned above is defined as:
```python
def bounds_to_gdf(bounds_list, crs=4326):
box = shapely.box(*bounds_list)
return gpd.GeoDataFrame(geometry=[box], crs=crs)
```
This function converts a bounding box into a GeoDataFrame .
This UDF simply returns our Map viewport as a `gpd.GeoDataFrame`, this is a good starting point for our UDF returning Sentinel 1 images
While you can do this anywhere around the continental US (our AIS dataset covered shores around the US, so we want to limit ourselves there), if you want to follow along this is the area of interest we'll be using. You can overwrite this in the UDF directly:
```python showLineNumbers
@fused.udf
def udf(
bounds: fused.types.Bounds,
):
# Define our specific bounds
specific_bounds = [-93.90425364, 29.61879782, -93.72767384, 29.7114987]
common = fused.load("https://github.com/fusedio/udfs/tree/b672adc/public/common/")
bounds = common.bounds_to_gdf(specific_bounds)
return bounds
```
Following the Microsoft Planetary Computer examples for getting Sentinel-1 we can add a few of the imports we need and call the STAC catalog:
```python showLineNumbers
@fused.udf
def udf(
bounds: fused.types.Bounds,
):
# Define our specific bounds and convert to GeoDataFrame
specific_bounds = [-93.90425364, 29.61879782, -93.72767384, 29.7114987]
common = fused.load("https://github.com/fusedio/udfs/tree/b672adc/public/common/")
bounds = common.bounds_to_gdf(specific_bounds)
catalog = pystac_client.Client.open(
"https://planetarycomputer.microsoft.com/api/stac/v1",
# Details as to why we need to sign it are addressed here: https://planetarycomputer.microsoft.com/docs/quickstarts/reading-stac/#Searching
modifier=planetary_computer.sign_inplace,
)
return bounds
```
We already have a bounding box, but let's narrow down our search to the first week of September:
```python showLineNumbers
@fused.udf
def udf(
bounds: fused.types.Bounds,
):
time_of_interest="2024-09-03/2024-09-04"
specific_bounds = [-93.90425364, 29.61879782, -93.72767384, 29.7114987]
common = fused.load("https://github.com/fusedio/udfs/tree/b672adc/public/common/")
bounds = common.bounds_to_gdf(specific_bounds)
catalog = pystac_client.Client.open(
"https://planetarycomputer.microsoft.com/api/stac/v1",
# Details as to why we need to sign it are addressed here: https://planetarycomputer.microsoft.com/docs/quickstarts/reading-stac/#Searching
modifier=planetary_computer.sign_inplace,
)
items = catalog.search(
collections=["sentinel-1-grd"],
bbox=bounds.total_bounds,
datetime=time_of_interest,
query=None,
).item_collection()
print(f"")
return bounds
```
This print statement should return something like:
```bash
Returned 15 Items
```
This will be the number of unique Sentinel 1 images covering our `bounds` and `time_of_interest`.
We can now use the `odc` package to load the first image & we'll use the VV polarisation from Sentinel 1 (VH could also work, and it would be good to iterate on this to visually assess which one would work best. We're keeping it simple for now, but feel free to test out both!).
We'll get an `xarray.Dataset` object back that we can simply open & return as a `uint8` array:
```python showLineNumbers
@fused.udf
def udf(
bounds: fused.types.Bounds,
):
time_of_interest="2024-09-03/2024-09-04"
bands = ["vv"]
# Convert bounds to GeoDataFrame for STAC operations
specific_bounds = [-93.90425364, 29.61879782, -93.72767384, 29.7114987]
common = fused.load("https://github.com/fusedio/udfs/tree/b672adc/public/common/")
bounds = common.bounds_to_gdf(specific_bounds)
catalog = pystac_client.Client.open(
"https://planetarycomputer.microsoft.com/api/stac/v1",
# Details as to why we need to sign it are addressed here: https://planetarycomputer.microsoft.com/docs/quickstarts/reading-stac/#Searching
modifier=planetary_computer.sign_inplace,
)
items = catalog.search(
collections=["sentinel-1-grd"],
bbox=bounds.total_bounds,
datetime=time_of_interest,
query=None,
).item_collection()
print(f"")
ds = odc.stac.load(
items,
crs="EPSG:3857",
bands=bands,
resolution=10, # We want to use the native Sentinel 1 resolution which is 10m
bbox=bounds.total_bounds,
).astype(float)
da = ds[bands[0]].isel(time=0)
image = da.values * 1.0
return image.astype('uint8')
```
Which gives us a Sentinel 1 image over our area of interest:
[Image: Notebook run remote print]
We've simplified the process quite a bit here, you could also:
- Instead of loading `image.astype('uint8')`, do a more controlled calibration and conversation to dB
- Select a more specific image rather than the 1st one in our stack
- Use a different band or band combination
- Use Radiometrically Terrain Corrected images
### 4.1 Cleaning our Sentinel 1 UDF
Before adding any new functionality, we're going to clean our UDF up a bit more:
- Move some of the functionality into separate functions
- Adding common error catching (so our UDF doesn't fail if no Sentinel 1 images are found within our AOI + date range if it's too narrow)
- Add a cache decorator to code functions that retrieve data to speed up the UDF & reduce costs.
This will allow us to keep our UDF more readable (by abstracting code away) and more responsive. Cached functions store their result to disk, which makes a common query a lot more responsive and less expensive by using less compute
Here's our cleaned up UDF:
```python showLineNumbers
@fused.udf
def udf(
bounds: fused.types.Bounds,
bands: list=["vv"],
resolution: int=10,
time_of_interest: str="2024-09-03/2024-09-10",
):
da = get_data(bounds, time_of_interest, resolution, bands)
image = da.values * 1.0
return image.astype('uint8')
@fused.cache
def get_data(
bounds: fused.types.Bounds,
time_of_interest: str,
resolution: int,
bands: list,
data_name: str="sentinel-1-grd"
):
"""
Getting Sentinel Data from MPC
Resolution is defined in meters as we're using EPSG:3857
"""
# Convert bounds to GeoDataFrame
common = fused.load("https://github.com/fusedio/udfs/tree/b672adc/public/common/")
bounds = common.bounds_to_gdf(bounds)
if resolution < 10:
print("Resolution shouldn't be lower than Sentinel 1 or 2 native resolution. Bumping to 10m")
resolution = 10
print(f"")
catalog = pystac_client.Client.open(
"https://planetarycomputer.microsoft.com/api/stac/v1",
# Details as to why we need to sign it are addressed here: https://planetarycomputer.microsoft.com/docs/quickstarts/reading-stac/#Searching
modifier=planetary_computer.sign_inplace,
)
items = catalog.search(
collections=[data_name],
bbox=bounds.total_bounds,
datetime=time_of_interest,
query=None,
).item_collection()
if len(items) < 1:
print(f'No items found. Please either zoom out or move to a different area')
else:
print(f"Returned Items")
def odc_load(bbox,resolution, time_of_interest):
ds = odc.stac.load(
items,
crs="EPSG:3857",
bands=bands,
resolution=resolution,
bbox=bounds.total_bounds,
).astype(float)
return ds
ds=odc_load(bounds,resolution, time_of_interest)
da = ds[bands[0]].isel(time=0)
return da
```
## 5. Simple boat detection in Sentinel 1 radar images
Now that we have a Sentinel 1 image over a Area of Interest and time range, we can write a simple algorithm to return bounding boxes of the boats in the image. We're going to keep this very basic as we're optimizing for:
- **Speed of execution**: We want our boat detection algorithm to run in a few seconds at most while we're iterating. Especially at first when we're developing our pipeline, we want a fast feedback loop
- **Simplicity**: We're focused on demo-ing how to build an end-to-end pipeline with Fused in this example, not making the most thorough analysis possible. This should be a baseline for you to build upon!
Radar images over calm water tend to look black (as all the radar signal is reflect _away_ from the sensor), while (mostly metallic) boats reflect back to the sensor appearing like bright spots in our image. A simple "boat detecting" algorithm is thus to do a 2D convolution and threshold the output to a certain pixel value:
```python showLineNumbers
@fused.udf
def udf(
bounds: fused.types.Bounds,
bands: list=["vv"],
resolution: int=10,
time_of_interest: str="2024-09-03/2024-09-10",
):
da = get_data(bounds, time_of_interest, resolution, bands)
image = da.values * 1.0
convoled_image = quick_convolution(np.array(image), kernel_size=2)
return convoled_image.astype('uint8')
@fused.cache
def get_data(
bounds: fused.types.Bounds,
time_of_interest: str,
resolution: int,
bands: list,
data_name: str="sentinel-1-grd"
):
"""
Getting Sentinel Data from MPC
Resolution is defined in meters as we're using EPSG:3857
"""
# Convert bounds to GeoDataFrame
common = fused.load("https://github.com/fusedio/udfs/tree/b672adc/public/common/")
bounds = common.bounds_to_gdf(bounds)
if resolution < 10:
print("Resolution shouldn't be lower than Sentinel 1 or 2 native resolution. Bumping to 10m")
resolution = 10
print(f"")
catalog = pystac_client.Client.open(
"https://planetarycomputer.microsoft.com/api/stac/v1",
# Details as to why we need to sign it are addressed here: https://planetarycomputer.microsoft.com/docs/quickstarts/reading-stac/#Searching
modifier=planetary_computer.sign_inplace,
)
items = catalog.search(
collections=[data_name],
bbox=bounds.total_bounds,
datetime=time_of_interest,
query=None,
).item_collection()
if len(items) < 1:
print(f'No items found. Please either zoom out or move to a different area')
else:
print(f"Returned Items")
def odc_load(bounds,resolution, time_of_interest):
ds = odc.stac.load(
items,
crs="EPSG:3857",
bands=bands,
resolution=resolution,
bbox=bounds.total_bounds,
).astype(float)
return ds
ds=odc_load(bounds,resolution, time_of_interest)
da = ds[bands[0]].isel(time=0)
return da
def quick_convolution(input_array, kernel_size):
shifted_images = []
# Shifting the image in all combinations of directions (x, y) with padding
for x in [-kernel_size, 0, kernel_size]: # Shift left (kernel_size), no shift (0), right (kernel_size)
for y in [-kernel_size, 0, kernel_size]: # Shift up (kernel_size), no shift (0), down (kernel_size)
shifted = pad_and_shift_image(input_array, x, y, pad_value=0, kernel_size=kernel_size)
shifted_images.append(shifted)
stacked_image = np.stack(shifted_images)
return stacked_image.std(axis=0)
def pad_and_shift_image(img, x_shift, y_shift, pad_value=0, kernel_size: int = 3):
"""Pad and shift an image by x_shift and y_shift with specified pad_value."""
padded_img = np.pad(img, pad_width=kernel_size, mode='constant', constant_values=pad_value)
shifted_img = np.roll(np.roll(padded_img, y_shift, axis=0), x_shift, axis=1)
return shifted_img[kernel_size:-kernel_size, kernel_size:-kernel_size]
```
This returns a filtered image highlighting the brightest spots and reducing the natural speckle of the radar image
[Image: Workbench run remote logs]
This is now relatively simple to vectorise (turn into a vector object, from image to polygons):
```python showLineNumbers
@fused.udf
def udf(
bounds: fused.types.Bounds,
bands: list=["vv"],
resolution: int=10,
time_of_interest: str="2024-09-03/2024-09-10",
):
common = fused.load("https://github.com/fusedio/udfs/tree/b672adc/public/common/")
bounds_gdf = common.bounds_to_gdf(bounds)
da = get_data(bounds, time_of_interest, resolution, bands)
image = da.values * 1.0
convoled_image = quick_convolution(np.array(image), kernel_size=2)
gdf_predictions = vectorise_raster(
raster=convoled_image.astype("uint8"),
bounds=bounds_gdf,
threshold=200 # Taking a high threshold in 0-255 range to keep only very bright spots
)
# Merging close polygons together into a single polygon so 1 polygon <-> 1 boat
buffer_distance = 0.0001 # eyeballed a few meters in EPSG:4326 (degrees are annoying to work with ¯\_(ツ)_/¯)
merged = gdf_predictions.geometry.buffer(buffer_distance).unary_union.buffer(
-buffer_distance/2
)
merged_gdf = gpd.GeoDataFrame(geometry=[merged], crs=bounds.crs).explode()
return merged_gdf
@fused.cache
def get_data(
bounds: fused.types.Bounds,
time_of_interest: str,
resolution: int,
bands: list,
data_name: str="sentinel-1-grd"
):
"""
Getting Sentinel Data from MPC
Resolution is defined in meters as we're using EPSG:3857
"""
common = fused.load("https://github.com/fusedio/udfs/tree/b672adc/public/common/")
bounds = common.bounds_to_gdf(bounds)
if resolution < 10:
print("Resolution shouldn't be lower than Sentinel 1 or 2 native resolution. Bumping to 10m")
resolution = 10
print(f"")
catalog = pystac_client.Client.open(
"https://planetarycomputer.microsoft.com/api/stac/v1",
# Details as to why we need to sign it are addressed here: https://planetarycomputer.microsoft.com/docs/quickstarts/reading-stac/#Searching
modifier=planetary_computer.sign_inplace,
)
items = catalog.search(
collections=[data_name],
bbox=bounds.total_bounds,
datetime=time_of_interest,
query=None,
).item_collection()
if len(items) < 1:
print(f'No items found. Please either zoom out or move to a different area')
else:
print(f"Returned Items")
def odc_load(bounds,resolution, time_of_interest):
ds = odc.stac.load(
items,
crs="EPSG:3857",
bands=bands,
resolution=resolution,
bbox=bounds.total_bounds,
).astype(float)
return ds
ds=odc_load(bounds,resolution, time_of_interest)
da = ds[bands[0]].isel(time=0)
return da
def quick_convolution(input_array, kernel_size):
shifted_images = []
# Shifting the image in all combinations of directions (x, y) with padding
for x in [-kernel_size, 0, kernel_size]: # Shift left (kernel_size), no shift (0), right (kernel_size)
for y in [-kernel_size, 0, kernel_size]: # Shift up (kernel_size), no shift (0), down (kernel_size)
shifted = pad_and_shift_image(input_array, x, y, pad_value=0, kernel_size=kernel_size)
shifted_images.append(shifted)
stacked_image = np.stack(shifted_images)
return stacked_image.std(axis=0)
def pad_and_shift_image(img, x_shift, y_shift, pad_value=0, kernel_size: int = 3):
"""Pad and shift an image by x_shift and y_shift with specified pad_value."""
padded_img = np.pad(img, pad_width=kernel_size, mode='constant', constant_values=pad_value)
shifted_img = np.roll(np.roll(padded_img, y_shift, axis=0), x_shift, axis=1)
return shifted_img[kernel_size:-kernel_size, kernel_size:-kernel_size]
@fused.cache
def vectorise_raster(raster, bounds, threshold: float = 0.5):
from rasterio import features
transform = rasterio.transform.from_bounds(*bounds.total_bounds, raster.shape[1], raster.shape[0])
shapes = features.shapes(
source=raster.astype(np.uint8),
mask = (raster > threshold).astype('uint8'),
transform=transform
)
gdf = gpd.GeoDataFrame(
geometry=[shapely.geometry.shape(shape) for shape, shape_value in shapes],
crs=bounds.crs
)
return gdf
```
And that's how we have turned our Sentinel 1 image into a vector `gpd.GeoDataFrame` of bright objects:
[Image: Workbench run remote logs]
## 6. Retrieving AIS data for our time of Interest
To get our AIS data, we now need to retrieve the exact moment our Sentinel 1 images were acquired. We can use this information to only keep AIS points within just a few minutes around that time.
```python showLineNumbers@fused.udf
def udf(
bounds: fused.types.Bounds,
bands: list=["vv"],
resolution: int=10,
time_of_interest: str="2024-09-03/2024-09-10",
):
common = fused.load("https://github.com/fusedio/udfs/tree/b672adc/public/common/")
bounds_gdf = common.bounds_to_gdf(bounds)
da = get_data(bounds, time_of_interest, resolution, bands)
image = da.values * 1.0
convoled_image = quick_convolution(np.array(image), kernel_size=2)
gdf_predictions = vectorise_raster(
raster=convoled_image.astype("uint8"),
bounds=bounds_gdf,
threshold=200 # Using higher threshold to make sure only bright spots are taken
)
# Merging close polygons together
buffer_distance = 0.0001 # eyeballed value in EPSG:4326 so need to use degrees. I don't like degrees
merged = gdf_predictions.geometry.buffer(buffer_distance).unary_union.buffer(
-buffer_distance/2
)
merged_gdf = gpd.GeoDataFrame(geometry=[merged], crs=bounds.crs).explode()
# Keeping metadata close by for merging with AIS data
merged_gdf['S1_acquisition_time'] = da['time'].values
return merged_gdf
@fused.cache
def get_data(
bounds: fused.types.Bounds,
time_of_interest: str,
resolution: int,
bands: list,
data_name: str="sentinel-1-grd"
):
"""
Getting Sentinel Data from MPC
Resolution is defined in meters as we're using EPSG:3857
"""
common = fused.load("https://github.com/fusedio/udfs/tree/b672adc/public/common/")
bounds = common.bounds_to_gdf(bounds)
if resolution < 10:
print("Resolution shouldn't be lower than Sentinel 1 or 2 native resolution. Bumping to 10m")
resolution = 10
print(f"")
catalog = pystac_client.Client.open(
"https://planetarycomputer.microsoft.com/api/stac/v1",
# Details as to why we need to sign it are addressed here: https://planetarycomputer.microsoft.com/docs/quickstarts/reading-stac/#Searching
modifier=planetary_computer.sign_inplace,
)
items = catalog.search(
collections=[data_name],
bbox=bounds.total_bounds,
datetime=time_of_interest,
query=None,
).item_collection()
if len(items) < 1:
print(f'No items found. Please either zoom out or move to a different area')
else:
print(f"Returned Items")
def odc_load(bounds,resolution, time_of_interest):
ds = odc.stac.load(
items,
crs="EPSG:3857",
bands=bands,
resolution=resolution,
bbox=bounds.total_bounds,
).astype(float)
return ds
ds=odc_load(bounds,resolution, time_of_interest)
da = ds[bands[0]].isel(time=0)
return da
def quick_convolution(input_array, kernel_size):
shifted_images = []
# Shifting the image in all combinations of directions (x, y) with padding
for x in [-kernel_size, 0, kernel_size]: # Shift left (kernel_size), no shift (0), right (kernel_size)
for y in [-kernel_size, 0, kernel_size]: # Shift up (kernel_size), no shift (0), down (kernel_size)
shifted = pad_and_shift_image(input_array, x, y, pad_value=0, kernel_size=kernel_size)
shifted_images.append(shifted)
stacked_image = np.stack(shifted_images)
return stacked_image.std(axis=0)
def pad_and_shift_image(img, x_shift, y_shift, pad_value=0, kernel_size: int = 3):
"""Pad and shift an image by x_shift and y_shift with specified pad_value."""
padded_img = np.pad(img, pad_width=kernel_size, mode='constant', constant_values=pad_value)
shifted_img = np.roll(np.roll(padded_img, y_shift, axis=0), x_shift, axis=1)
return shifted_img[kernel_size:-kernel_size, kernel_size:-kernel_size]
@fused.cache
def vectorise_raster(raster, bounds, threshold: float = 0.5):
from rasterio import features
transform = rasterio.transform.from_bounds(*bounds.total_bounds, raster.shape[1], raster.shape[0])
shapes = features.shapes(
source=raster.astype(np.uint8),
mask = (raster > threshold).astype('uint8'),
transform=transform
)
gdf = gpd.GeoDataFrame(
geometry=[shapely.geometry.shape(shape) for shape, shape_value in shapes],
crs=bounds.crs
)
return gdf
```
`merged_gdf` now returns a column called `S1_acquisition_time` with the time the Sentinel 1 image was taken.
If we save and call this UDF with a token we can call it from anywhere, from a Jupyter Notebook or from another UDF. Let's create a new UDF in Workbench:
```python showLineNumbers
# This is a new UDF
@fused.udf
def udf(
bounds: fused.types.Bounds=None,
time_of_interest: int="2024-09-03/2024-09-10",
):
@fused.cache()
def get_s1_detection(
time_of_interest=time_of_interest,
bounds=bounds):
return fused.run(
"fsh_673giUH9R6KqWFCOQtRfb3",
time_of_interest=time_of_interest,
bounds=bounds,
)
s1_detections = get_s1_detection()
print(f"Found Unique Sentinel 1 detections")
# We want to keep AIS data only right around the time the S1 image was acquired
s1_acquisition_date = s1_detections['S1_acquisition_time'].values[0]
s1_acquisition_month = str(s1_acquisition_date.astype('datetime64[M]'))
s1_acquisition_month_day_hour_min = s1_acquisition_date.astype('datetime64[s]').astype(str).replace('T', ' ')
print(f"Sentinel 1 image was acquired at : ")
return s1_detections
```
This prints out:
```bash
Found 16 Unique Sentinel 1 detections
Sentinel 1 image was acquired at : 2024-09-04 00:19:09
```
We can now create another UDF that will take this `s1_acquisition_month_day_hour_min` date + a bounding box in input and returns all the AIS points in that time + area.
We're going to leverage code from the community for this part, namely reading the AIS data from a geo-partitioned GeoParquet. Fused allows us to easily re-use any code we want and freeze it to a specific commit so it doesn't break our pipelines (read more about this here)
We can use this bit of code called `table_to_tile` which will either load the AIS data or the bounding box depending on our zoom level to keep our UDF fast & responsive.
You could write a GeoParquet reader from scratch or call a UDF that you have that already does this, you don't have to use this option. But we want to show you how you can re-use bits of code from others here.
```python showLineNumbers
@fused.udf
def udf(
bounds: fused.types.Bounds = None,
s1_acquisition_month_day_hour_min:str = '2024-09-04T00:19:09.175874',
time_delta_in_hours: float = 0.1, # by default 6min (60min * 0.1)
min_zoom_to_load_data: int = 14,
ais_table_path: str = "s3://fused-users/fused/demo_user/AIS_2024_ingester/prod_2024_09", # This is the location where we had ingested our geo-partitioned AIS data
):
"""Reading AIS data from Fused partitioned AIS data from NOAA (data only available in US)"""
from datetime import datetime, timedelta
# Load the utils module
common = fused.load("https://github.com/fusedio/udfs/tree/b672adc/public/common/")
zoom = common.estimate_zoom(bounds)
sentinel1_time = pd.to_datetime(s1_acquisition_month_day_hour_min)
time_delta_in_hours = timedelta(hours=time_delta_in_hours)
month_date = sentinel1_time.strftime('%Y_%m')
monthly_ais_table = f"prod_/"
print(f"")
@fused.cache
def getting_ais_from_s3(bounds, monthly_table):
return common.table_to_tile(
bounds,
table=monthly_ais_table,
use_columns=None,
min_zoom=min_zoom_to_load_data
)
ais_df = getting_ais_from_s3(bounds, monthly_ais_table)
if ais_df.shape[0] == 0:
print("No AIS data within this bounds & timeframe. Change bounds or timeframe")
return ais_df
if zoom > min_zoom_to_load_data:
print(f"Zoom is | Only showing bounds")
return ais_df
print(f"")
ais_df['datetime'] = pd.to_datetime(ais_df['BaseDateTime'])
mask = (ais_df['datetime'] >= sentinel1_time - time_delta_in_hours) & (ais_df['datetime'] <= sentinel1_time + time_delta_in_hours)
filtered_ais_df = ais_df[mask]
print(f'')
return filtered_ais_df
```
In workbench Map Builder we can now see the output of both of our UDF:
[Image: Notebook run remote print]
We can now see that 1 of these boats doesn't have an associated AIS point (in red).
You can change the styling of your layers in the Visualize tab to make them look like the screenshot above
Now all we need to do is merge these 2 datasets together and keep all the boats that don't match an AIS point.
## 7. Merging the 2 datasets together
We can expand the UDF we had started in section 6. to call our AIS UDF by passing a bounding box + `s1_acquisition_month_day_hour_min`.
We'll get the AIS data and join it with the Sentinel 1 detected boats by using geopandas `sjoin_nearest` to get the nearest distance of each boat to an AIS point.
Any point with the closest AIS point >100m from the Sentinel 1 boat will be considered a potentiel "dark vessel".
```python showLineNumbers
@fused.udf
def udf(
bounds: fused.types.Bounds=None,
time_of_interest: str="2024-09-03/2024-09-10",
ais_search_distance_in_meters: int=10,
):
@fused.cache()
def get_s1_detection(
time_of_interest=time_of_interest,
bounds=bounds):
return fused.run(
"fsh_673giUH9R6KqWFCOQtRfb3",
time_of_interest=time_of_interest,
bounds=bounds,
)
s1_detections = get_s1_detection()
print(f"Found Unique Sentinel 1 detections")
# We want to keep AIS data only right around the time the S1 image was acquired
s1_acquisition_date = s1_detections['S1_acquisition_time'].values[0]
s1_acquisition_month = str(s1_acquisition_date.astype('datetime64[M]'))
s1_acquisition_month_day_hour_min = s1_acquisition_date.astype('datetime64[s]').astype(str).replace('T', ' ')
print(f"Sentinel 1 image was acquired at : ")
@fused.cache()
def get_ais_from_s1_date(s1_acquisition_month_day_hour_min=s1_acquisition_month_day_hour_min, bounds=bounds):
return fused.run("fsh_FI1FTq2CVK9sEiX0Uqakv", s1_acquisition_month_day_hour_min=s1_acquisition_month_day_hour_min, bounds=bounds)
ais_gdf = get_ais_from_s1_date()
# Making sure both have the same CRS
s1_detections.set_crs(ais_gdf.crs, inplace=True)
# Buffering AIS points to leverage spatial join
ais_gdf['geometry'] = ais_gdf.geometry.buffer(0.005)
joined = s1_detections.to_crs(s1_detections.estimate_utm_crs()).sjoin_nearest(
ais_gdf.to_crs(s1_detections.estimate_utm_crs()),
how="inner", # Using left, i.e. s1 as keys
distance_col='distance_in_meters',
)
# Dark vessels will be unique S1 points that don't have an AIS point within 10m
potential_dark_vessels = joined[joined['distance_in_meters'] > ais_search_distance_in_meters]
print(f"Found potential dark vessels")
# back to EPSG:4326
potential_dark_vessels.to_crs(s1_detections.crs, inplace=True)
return potential_dark_vessels
```
And now we have a UDF that takes a `time_of_interest` and bounding box and returns potential dark vessel:
[Image: potential dark vessel detection]
## Limitations & Next steps
This is a simple analysis, that makes a lot of relatively naive assumptions (for ex: all bright spots in SAR are boats for example, which only works in open water and not near the shore or around solid structures like ocean wind mills or oil rigs). There's a lot of ways in which it could be improved but provides a good starting point.
This could be improved in a few ways:
- Masking out any shore or known areas with static infrastructure (to limit potential false positives around coastal wind mill farms)
Example of the Block Island Wind Farm in Rhode Island showing up as false positive "potential dark vessel": Wind mills appear as bright spots but don't have any AIS data associated to them
(`bounds=[-71.08534386325134,41.06338103121641,-70.89011235861962,41.15718153299125]` & `s1_acquisition_month_day_hour_min = "2024-09-03T22:43:33"`)
- Using a more sophisticated algorithm to detect boats. The current algorithm is naive, doesn't return bounding boxes but rather general shapes.
- Return more information derived from AIS data: Sometimes boats go dark for a certain period of time only, making it possible to tie a boat that was dark for a certain time to a known ship when it does have it's AIS on.
- Running this over all the coast of the continental US and/or over a whole year. This would be closer to the Global Fishing Watch dark vessel detection project.
If you want to take this a bit further check out:
- Running UDFs at scale with `run_batch()`. You could use this to run this pipeline over a larger area or over a much longer time series (or both!) to find out more potentiel dark vessels
- More about Fused core concepts like chosing between running UDFs based on Tile or File
================================================================================
## Create a branded text to image pipeline
Path: examples/branded-text-to-image.mdx
URL: https://docs.fused.io/examples/branded-text-to-image
# Create a branded text to image pipeline
**Define your brand's visual style once and share it with your whole team — anyone can generate on-brand images from a text prompt without a design tool or local setup. The Canvas can be scoped to your organization, so external users can't access it, the style library version-controls through GitHub, and API keys never leave the platform.**
Turn a text description into a brand-consistent image in one click — or feed an existing sketch through the same style system to get a polished, on-brand version. Define your visual style once; everyone on the team uses the same guidelines automatically.
The pipeline was built on Fused Workbench and uses widgets to display generated images inline. The image on the Widgets docs page is an example of an image made using this exact technique.
Try it out on the Canvas →
## How the pipeline works
[Image: Diagram showing the image-to-image and text-to-image pipelines: source image plus transform prompt, or style library plus text prompt, both feed an AI model via OpenRouter running on Fused, outputting to a Canvas widget]
*This diagram was itself generated using the pipeline — prompt: "Cartoon version of how the pipeline works for image to image pipeline", style: `technical_blogpost`.*
```text
A clean hand-drawn technical diagram illustration, white background, black ink only.
Style: marker-drawn boxes and arrows, slightly rough edges, imperfect lines — like a
whiteboard diagram drawn by a skilled designer. NOT isometric, NOT 3D, NOT photorealistic.
Typography: bold hand-lettered titles in a casual but clean marker style.
Labels inside boxes use a clean sans-serif or handwritten font, medium weight.
Fused brand accent: use #E5FF44 (bright yellow-green) ONLY for:
- The "FUSED" box or any box representing Fused itself
- Underlines on main section titles
- Key arrow highlights
Other colors could be used but should only be supplementary and used sparingly.
Layout rules:
- Clear left-to-right or top-to-bottom flow
- Boxes have thin rounded borders, consistent sizing
- Arrows are clean, single-headed, slightly curved
- Labels are short: 1-3 words max per item
- Generous whitespace between elements
- If two panels, divide with a single vertical black line
Do NOT add: drop shadows, gradients, textures, background colors, decorative elements.
The diagram should look like it could be recreated on a whiteboard in 10 minutes.
```
A central **style library** UDF holds your brand guidelines as named style prompts. Both the text-to-image and image-to-image generators pull from it at runtime, so every image — regardless of who generated it or what prompt they wrote — automatically follows the same visual rules.
### Text-to-image
Type a description of what you want to create and submit. The AI model receives your prompt wrapped in the style guidelines and returns a brand-consistent image displayed directly in a Canvas widget.
[Image: Canvas showing the "Create an image" interface with a prompt input on the left and the generated branded diagram output on the right]
### Image-to-image
Provide an existing image — a hand-drawn sketch, a rough diagram, a photo — and a short prompt describing the transformation. The model applies your brand style while preserving the structure and composition of the source.
[Image: Before and after: raw sketches on the left, polished branded illustrations on the right]
*Left: raw sketches. Right: the same content transformed into a consistent branded illustration style — no manual design work.*
## Why run this on Fused?
You could wire up OpenRouter locally in a script, but running it on Fused gives you:
- **Secure secrets management** — API keys are stored as Fused secrets, never in code or environment variables. The key never touches team members' machines.
- **Team sharing** — share the Canvas URL with anyone in your org. They open a browser, type a prompt, and get an on-brand image — no Python environment, no local setup, no credential sharing. Access stays within your organization.
- **Response caching** — identical prompt + style combinations return instantly without re-calling the API. Running the same prompt twice costs nothing extra.
- **One style update, everywhere** — edit the style library once and every future generation picks up the change automatically.
- **Fast iteration** — tweak prompts, switch styles, and compare outputs in the browser in seconds.
Add your key once as a Fused secret named `openrouter_api_key`:
1. Go to **Workbench → Preferences → Secrets**
2. Click **Add secret**, name it `openrouter_api_key`, paste your key
3. The pipeline reads it automatically — no code changes needed
Team members with Canvas access can generate images without ever seeing or handling the key.
## Customize your brand style
The style library UDF returns a DataFrame where each column is a named style. Each value is a detailed visual prompt the AI model uses alongside whatever the user types. Adding a new style is just adding a new column:
```python
@fused.udf
def udf(color: str = "#E5FF44"):
return pd.DataFrame( only for key highlights and the focal element.
Clear left-to-right flow, generous whitespace, 1-3 word labels per box.
"""],
"youtube_thumbnail": ["""
YouTube thumbnail, 16:9. Pure black background. Ultra-bold condensed all-caps
sans-serif headline. First lines in white, last line in bright lime green (#E5FF44).
No people, no logos, no gradients — type fills the frame edge to edge.
"""],
"crime_blogpost": [f"""
Hand-drawn sketch inked into a polished brand illustration. White background,
black ink line art, ONE accent color: as wide highlighter swipes.
Crime scene diagram aesthetic. Bold all-caps labels, chunky arrows.
"""],
# Add your own style here
"my_brand": [f"""
Describe your brand visual style here. Include: color palette (use for
accents), typography style, layout rules, illustration technique, and tone.
Be specific — the more precise the style prompt, the more consistent the output.
"""],
})
```
The `color` parameter propagates your brand accent across all styles at once — change `#E5FF44` to your primary color and every style updates in one place.
## See also
- Widgets — how image output widgets work on the Canvas
- Secrets management — storing API keys securely
- `@fused.cache` — avoid duplicate API charges
- Working as a team
- Using AI inside a UDF
================================================================================
## Canvas Gallery
Path: examples/canvas-gallery.mdx
URL: https://docs.fused.io/examples/canvas-gallery
# Canvas Gallery
Explore example Fused Canvases to see what's possible with Fused.
================================================================================
## Climate Dashboard
Path: examples/climate-dashboard.mdx
URL: https://docs.fused.io/examples/climate-dashboard
# Building a Climate dashboard
We're going to build an interactive dashboard of global temperature data, after processing 1TB of data in a few minutes!
### Install `fused`
```bash
pip install "fused[all]"
```
Read more about installing Fused here.
In a notebook:
```python
# doctest: skip
from fused.api import NotebookCredentials
credentials = NotebookCredentials()
print(credentials.url)
```
Follow the link to authenticate.
Read more about authenticating in Fused.
Each file being about 140MB a quick back of the envelope calculation gives us:
```python
# doctest: skip
recent_days = [day for day in available_days if day.split('datestr=')[1][:7] in recent_months]
len(recent_days) * 140 / 1000 # size in GB of files we'll process
```
```bash
1005.62
```
Fused allows us to run a UDF in parallel. So we'll process 1 month of data across hundreds of jobs:
```python
results = fused.submit(
udf,
recent_months,
max_workers=250,
collect=False
)
```
See a progress bar of jobs running:
```python
# doctest: skip
results.wait()
```
See how long all the jobs took:
```python
# doctest: skip
results.total_time()
```
```bash
>>> datetime.timedelta(seconds=40, ...)
```
**We just processed 20 years of worldwide global data, over 1TB in 40s!!**
We can now write a UDF that gets all the monthly data and aggregates it by month:
```python
@fused.udf(cache_max_age='0s')
def udf():
monthlys = fused.api.list(fused.file_path(f"monthly_climate/"))
con = duckdb.connect()
result = con.execute(
"""
SELECT
LEFT(datestr, 7) AS month,
ROUND(AVG(daily_mean_temp), 2) AS monthly_mean_temp
FROM read_parquet(?)
GROUP BY month
ORDER BY month
""",
[monthlys],
).df()
return result
```
Instead of running this locally, we'll open it in Workbench, Fused's web-based IDE:
```python
# Save to Fused
udf.to_fused("monthly_mean_temp")
# Load again to get the Workbench URL
loaded_udf = fused.load("monthly_mean_temp")
```
Return `loaded_udf` in a notebook and you'll get a URL that takes you to Workbench:
```python
# doctest: skip
loaded_udf
```
Click on the link to open the UDF in Workbench. Click "+ Add to UDF Builder"
[Image: Monthly temperature aggregation in Workbench]
### Interactive graph (with AI)
You can use the AI Chat to help you vibe code an interactive timeseries of your data
Simply ask the AI:
```
Make an interactive graph of the monthly temperature data
```
You can then share your graph:
- Save (`Cmd + S` on MacOS or click the "Save" button)
- Click "URL" button to see deployed graph!
Any time you make an update, your graph will automatically update!
================================================================================
## Run ComfyUI workflows in Fused
Path: examples/comfyui-fused-workflows.mdx
URL: https://docs.fused.io/examples/comfyui-fused-workflows
# Run ComfyUI workflows in Fused
**Using Fused to cache, orchestrate & reuse pipelines on top of ComfyUI to make easily repeatable image generation workflows.**
ComfyUI is a powerful node-based tool for diffusion model pipelines — but sharing, scheduling, and caching those runs requires orchestration outside ComfyUI. Fused acts as that layer: it calls ComfyUI (via Comfy Cloud or a self-hosted GPU), caches results so identical runs are instant, stores outputs to S3, and makes everything shareable as a live link.
Add your key once as a Fused secret named `COMFY_API_KEY`:
1. Go to **Workbench → Integrations & secrets → Personal/Team secrets**
2. Click **Add new secret**, name it `COMFY_API_KEY`, paste your key
3. All UDFs on the canvas read it automatically — no code changes needed
## Adapt this to your own workflow
The pattern is the same for any ComfyUI workflow:
1. **Export the API JSON** from ComfyUI (**Graph → Export (API)**). You can start from an existing shared workflow — for example, the Images to Video graph or the Text to Image graph on Comfy Cloud. Open it in ComfyUI, then [Image: ComfyUI Graph menu with Export (API) highlighted]
2. **Upload the JSON to S3** (or any URL Fused can reach via `sign_url`).
3. **Update the input and output nodes** to match your workflow. Node IDs are the top-level keys in the exported JSON.
4. **Write a `@fused.cache` helper** that loads the workflow, patches those nodes, submits, polls, and uploads the result.
5. **Write a thin `@fused.udf` wrapper** that calls the helper and returns a signed URL or array. Use `engine='small'` if the job runs longer than 120 seconds — see batch jobs.
6. **Add a widget** (JSON) to expose parameters as form controls on the canvas.
The two pipelines below — **Images to Video** and **Text to Image** — are concrete examples of this pattern, both living on the same canvas.
Open the Canvas →
## Deep dive: Images to Video
[Image: Fused Canvas showing the Images to Video pipeline with three panels: Important Notes, Input Parameters, and Process & Output]
The goal is to generate b-roll footage: given a **scene image** (the background environment) and a **product image**, the SeedDance 2 Fast model running on Comfy Cloud produces a cinematic product video. Fused acts as the processing engine — it loads the workflow JSON, uploads the inputs, triggers the Comfy Cloud API, polls for completion, saves the output to S3, and returns a signed URL, all from a single UDF. The result is cached, the API key stays secret, and the output is instantly shareable.
### The Fused UDF
The UDF is split into two parts: a `@fused.cache` helper that runs the expensive GPU job, and a thin `@fused.udf` wrapper that refreshes the signed URL. The wrapper uses `engine='small'`, which runs it as a batch job — necessary because video generation can take several minutes, well beyond the 120-second limit of realtime UDFs.
```python
from urllib.parse import urlsplit
@fused.cache
def run_comfy_job(
workflow_s3_path, scene_image_path, product_image_path,
text_prompt, vid_duration, seed, s3_base
):
from pathlib import Path
BASE_URL = "https://cloud.comfy.org"
headers =
workflow = requests.get(fused.api.sign_url(workflow_s3_path)).json()
def _upload_to_comfy(image_path: str) -> str:
if image_path.startswith("s3://"):
img_bytes = requests.get(fused.api.sign_url(image_path)).content
fname = image_path.split("/")[-1]
else:
fname = Path(image_path).name
img_bytes = Path(image_path).read_bytes()
resp = requests.post(
f"/api/upload/image",
headers=headers,
files=,
)
resp.raise_for_status()
return resp.json()["name"]
workflow["3"]["inputs"]["image"] = _upload_to_comfy(scene_image_path)
workflow["2"]["inputs"]["image"] = _upload_to_comfy(product_image_path)
workflow["1"]["inputs"]["model.prompt"] = text_prompt
workflow["1"]["inputs"]["model.duration"] = int(vid_duration)
workflow["1"]["inputs"]["seed"] = seed
api_key = fused.secrets["COMFY_API_KEY"]
prompt_id = requests.post(
f"/api/prompt",
headers=,
json=},
).json()["prompt_id"]
history =
for _ in range(120):
job = requests.get(f"/api/job//status", headers=headers).json()
if job.get("status") in ("failed", "cancelled", "error"):
raise RuntimeError(f"Comfy job failed: ")
if job.get("status") in ("success", "completed"):
resp = requests.get(f"/api/history_v2/", headers=headers)
if resp.status_code == 200 and resp.text.strip():
history = resp.json().get(prompt_id, )
break
time.sleep(5)
first_video_s3_path = None
for node_outputs in history.get("outputs", ).values():
for media_key in ("images", "video", "audio"):
for file_info in node_outputs.get(media_key, []):
data = requests.get(
f"/api/view",
headers=headers,
params=,
).content
local_tmp = f"/tmp/"
with open(local_tmp, "wb") as f:
f.write(data)
s3_path = s3_base + file_info["filename"]
fused.api.upload(local_tmp, s3_path)
first_video_s3_path = s3_path
return first_video_s3_path
@fused.udf(engine='small')
def images_to_video(
workflow_s3_path: str = "s3://fused-users/fused/aman/comfyui-brole-workflow.json",
scene_image_path: str = "s3://fused-users/fused/aman/reference_scene.png",
product_image_path: str = "s3://fused-users/fused/aman/think-pad-product.png",
text_prompt: str = "Use @image1 to match the scene...",
vid_duration: str = "5",
seed: int = 387457956,
s3_base: str = "s3://fused-users/fused/aman/comfyui-text-to-image/",
):
video_s3_path = run_comfy_job(
workflow_s3_path, scene_image_path, product_image_path,
text_prompt, vid_duration, seed, s3_base
)
signed_url = fused.api.sign_url(video_s3_path)
source_type = mimetypes.guess_type(urlsplit(signed_url).path)[0] or "video/mp4"
return f"""
"""
```
```python
@fused.udf(cache_max_age="0s")
def text_to_image(
text_prompt: str = "A beautiful sunset over mountains",
workflow_s3_path: str = "s3://fused-users/fused/aman/01_get_started_text_to_image.json",
seed: int = 0,
output_dir: str = "./outputs",
):
from PIL import Image
BASE_URL = "https://cloud.comfy.org"
headers =
workflow = requests.get(fused.api.sign_url(workflow_s3_path)).json()
workflow["104:90"]["inputs"]["text"] = text_prompt
workflow["104:92"]["inputs"]["seed"] = seed
prompt_id = requests.post(
f"/api/prompt",
headers=,
json=,
).json()["prompt_id"]
history =
for _ in range(30):
resp = requests.get(f"/api/history_v2/", headers=headers)
if resp.status_code == 200 and resp.text.strip():
history = resp.json().get(prompt_id, )
if history.get("status", ).get("completed"):
break
time.sleep(2)
outputs = history.get("outputs", )
def _download(filename, output_type="output"):
return requests.get(
f"/api/view",
headers=headers,
params=,
).content
os.makedirs(output_dir, exist_ok=True)
first_image = None
s3_base = "s3://fused-users/fused/aman/comfyui-text-to-image/"
for node_outputs in outputs.values():
for media_key in ("images", "video", "audio"):
for file_info in node_outputs.get(media_key, []):
data = _download(file_info["filename"], file_info.get("type", "output"))
local_path = os.path.join(output_dir, file_info["filename"])
with open(local_path, "wb") as f:
f.write(data)
s3_path = s3_base + file_info["filename"]
fused.api.upload(local_path, s3_path)
if media_key == "images" and first_image is None:
first_image = data
arr = np.array(Image.open(io.BytesIO(first_image)).convert("RGB"))
return np.moveaxis(arr, -1, 0)
```
The IDs `"104:90"` and `"104:92"` above are specific to this z-image-turbo workflow. Check the top-level keys in your own exported API JSON to find the correct IDs for your text prompt and seed nodes.
---
## Why run this on Fused?
- **`@fused.cache`** — identical inputs return instantly; no GPU charges for repeat runs.
- **`fused.secrets`** — your Comfy Cloud API key lives in Fused secrets, never in code.
- **`fused.api.sign_url`** — reference images and workflow JSONs on S3 without making them public.
- **S3 output storage** — results are saved directly to S3 and accessible via signed URL; no manual download steps.
- **Version controlled** — UDFs are plain Python files you can track in git alongside your workflow JSONs.
- **Canvas** — organize multiple pipelines in one view and share the whole thing with one link.
- **Widgets** — expose parameters as sliders, inputs, and dropdowns without touching Python.
- **Embed links** — any UDF output is a live HTTPS endpoint you can embed in docs, dashboards, or Notion.
## See also
- `@fused.cache` — result caching reference
- Secrets management — storing API keys
- Widgets — building canvas controls
- Sharing canvas dashboards — sharing your work
- Branded text to image — another generative AI pipeline on Fused
================================================================================
## Creating Charts
Path: examples/creating-charts.mdx
URL: https://docs.fused.io/examples/creating-charts
# Interactive Charts
Create interactive charts from any data with AI assistance.
### Prompts Used
```text
Open this dataset as a table and return the first 10 rows: https://survey.stackoverflow.co/datasets/stack-overflow-developer-survey-2024.zip
```
```text
Looking at the dataset, how popular was Python in 2024? Give me the percentage of Python users and total user count
```
```text
How does this compare to the previous year?
```
```text
Show me the evolution of Python popularity over the last 5 years in a table
```
```text
Make this into a simple interactive dashboard. Show only the Python percentage users and total user count into a nice beautiful graph. Make sure to center the y-axis at 0.
```
---
## More Examples
- Climate Dashboard — processing 1TB of weather data
- Analytics is Changing (Again) — blog post on vibe coding
================================================================================
## From a Google Sheet to a Google Slides infographic
Path: examples/gdrive-to-slides-infographic.mdx
URL: https://docs.fused.io/examples/gdrive-to-slides-infographic
The Fused **Google Drive integration** lets a UDF reach straight into your Drive — read any file, list any folder, write back, all with one OAuth grant. This example uses it to take a CSV sitting in Drive, render it as an editorial infographic with an AI image model, and drop the result as a new slide into an existing Google Slides deck. The same pattern works for any Drive file: Sheets, Docs, PDFs, images — once you're connected, it's all one filesystem.
## Try it out
**Open the Fused Canvas →**
The Canvas references your own Google Drive and your own OpenRouter key, so **fork it into your workspace** before running: open the Canvas → click **⋮** → **Make a copy**, then work in your copy.
- **Connect Google Drive** — Workbench → **Integrations & Secrets** → **Google Drive** → **Connect**, then use the Picker to grant access to the spreadsheet folder you want to read *and* the Slides decks you want to publish into. With the `drive.file` scope, Fused only sees files you explicitly grant — a deck won't appear in the picker on the last node until you've added it via the Picker.
- **Add an OpenRouter API key** — get one from OpenRouter, then Workbench → **Integrations & Secrets** and add it as `openrouter_api_key`.
## How the Canvas is organized
The Canvas is organized in **three parts**, end-to-end: take the airline travel CSV sitting in Drive, turn it into an editorial infographic with an image model, and insert it as a new slide in your deck. Each part is a self-contained piece of the pipeline with its own widget — you walk through them top-to-bottom and the parameters flow forward automatically.
### Part 1 · Pick data from Google Drive
Lists every CSV / XLSX you've granted Drive access to and lets you pick one — the file streams straight into a `pandas` DataFrame, no intermediate copy. Built from a `dropdown` and a `sql-table` widget.
### Part 2 · Generate the infographic
Pick a style reference, type a title, click **Generate**. An image model on OpenRouter renders the chart in that style and the PNG is saved to your Drive. Built from a `gallery-input` for the style picker and a `form` so the generator only fires on submit.
### Part 3 · Publish into a Google Slides deck
Pick a deck, set the insert position, click **Publish**. A new slide lands in the deck with the title from Part 2 and the infographic as a full-bleed image, then an embedded preview renders right below the form. Built from a `dropdown`, a `number-input`, and a `form`.
Slides decks only appear in the picker once they've been explicitly granted via the Drive Picker. Open **Integrations & Secrets** → **Google Drive** → **Picker** and add the deck you want before refreshing the Part 3 widget.
Part 2 sets a canvas parameter once the infographic preview renders. If you click Publish *before* the preview shows up, that parameter is still empty and the slide will land with just a title and no image. Wait for the infographic to appear, then publish.
## Why Fused
Wiring Drive, OpenRouter, and the Slides API together yourself usually means a separate script (probably a few of them), OAuth dance per service, somewhere to host it, and somewhere to host the generated PNG. On Fused, the three integrations are already connected, the UDFs run in the same managed environment, and the widgets give you the UI for free — no separate frontend, no intermediate storage, no glue server. Fork the Canvas, point it at your file, and you have a working tool.
## See also
- **Google Drive integration** — connect Drive, grant file access via the Picker, and the `gdrive://` path scheme used here.
- **Widget API reference** — every widget type used on this Canvas, with full prop reference.
- **Will you be late to your meetings?** — same Google integration story for Calendar, with an AI agent on top.
- **Joining messy data for AI Agents** — multi-source pipeline (Snowflake + Sheets + S3) exposed to an agent.
================================================================================
## Will You Be Late to Your Meetings?
Path: examples/google-calendar-meetings.mdx
URL: https://docs.fused.io/examples/google-calendar-meetings
This example shows how to connect Google Calendar to a Fused pipeline that calculates travel time between appointments and flags meetings you're likely to be late for — then exposes the result to AI agents like Claude.
*Walkthrough: Checking whether you'll make your meetings on time using Fused and Claude. Try the Canvas →*
Knowing your next meeting starts in 30 minutes doesn't help if the commute takes 45. Calendar apps show times but ignore the real world — where you are, how long it takes to get between locations, and whether the gap between back-to-back meetings is actually enough. With Fused, you can pull your Google Calendar events, compute routing and travel times, and surface schedule conflicts to an AI agent.
## Building the canvas
### 1. Pull events from Google Calendar
[Image: Fetching Google Calendar events in Fused Canvas]
The `gcal_today_events` UDF connects to the Google Calendar API and loads the day's events — meetings, blocks, and appointments — into a DataFrame with titles, start/end times, and locations.
Setting `cache_max_age=0` disables caching so the UDF always pulls the latest calendar data on every run — ensuring real-time updates when you reschedule meetings.
```python
@fused.udf(cache_max_age=0)
def udf(
calendar_url="https://calendar.google.com/calendar/u/3?cid=bWF4LmZ1c2VkLnRlc3RpbmdAZ21haWwuY29t", # replace with your calendar URL
date: str = "2026-04-08", # replace with your date or leave empty for today
):
from datetime import datetime
from urllib.parse import urlparse, parse_qs
google_api_key = fused.secrets["google_maps_api"] # set in Fused Secrets
parsed_url = urlparse(calendar_url)
cid_param = parse_qs(parsed_url.query).get("cid", [None])[0]
if not cid_param:
return pd.DataFrame()
calendar_id = base64.b64decode(cid_param).decode("utf-8")
if date:
today = datetime.strptime(date, "%Y-%m-%d").date()
else:
today = datetime.utcnow().date()
time_min = datetime.combine(today, datetime.min.time()).isoformat() + "Z"
time_max = datetime.combine(today, datetime.max.time()).isoformat() + "Z"
url = f"https://www.googleapis.com/calendar/v3/calendars//events"
params =
response = requests.get(url, params=params)
data = response.json()
events = data.get("items", [])
if not events:
return pd.DataFrame("]})
event_list = []
for event in events:
event_list.append().get("dateTime", event.get("start", ).get("date")),
"end": event.get("end", ).get("dateTime", event.get("end", ).get("date")),
"description": event.get("description", ""),
"location": event.get("location", ""),
})
return pd.DataFrame(event_list)
```
```python
@fused.udf(cache_max_age=0)
def udf(date: str = "2026-04-08"):
from geopy.geocoders import Nominatim
gcal = fused.load("gcal_today_events")
data = gcal(date=date)
@fused.cache
def geocode_location(location):
if not location or not str(location).strip():
return None, None
geocoder = Nominatim(user_agent="fused_geocoder")
result = geocoder.geocode(str(location), timeout=10)
time.sleep(0.2)
if result:
return result.latitude, result.longitude
return None, None
lats, lons = [], []
for location in data["location"].fillna(""):
lat, lon = geocode_location(location)
lats.append(lat)
lons.append(lon)
data["latitude"] = lats
data["longitude"] = lons
return data
```
```python
@fused.udf
def udf(date: str = "2026-04-08"):
"""
Computes driving routes between consecutive meetings on a given day.
Returns a GeoDataFrame with one row per consecutive meeting pair, including
route geometry, distance, duration, and on-time status.
"""
from shapely.geometry import LineString
from datetime import datetime
geocode = fused.load("gcal_events_geocode")
meetings_df = geocode(date=date)
meetings_df = meetings_df[
(meetings_df["latitude"].notna()) & (meetings_df["longitude"].notna())
].reset_index(drop=True)
google_maps_api = fused.secrets["google_maps_api"] # set in Fused Secrets
def format_time_range(start_str, end_str):
start_time = datetime.fromisoformat(start_str.replace("Z", "+00:00")).strftime("%H:%M")
end_time = datetime.fromisoformat(end_str.replace("Z", "+00:00")).strftime("%H:%M")
return f" - "
@fused.cache()
def get_route(origin_lat, origin_lon, dest_lat, dest_lon):
url = "https://routes.googleapis.com/directions/v2:computeRoutes"
headers =
payload = }},
"destination": }},
"travelMode": "DRIVE",
"routingPreference": "TRAFFIC_AWARE",
}
response = requests.post(url, headers=headers, json=payload)
data = response.json()
if "routes" in data and len(data["routes"]) > 0:
return data["routes"][0]
return None
def decode_polyline(encoded, origin_lon, origin_lat, dest_lon, dest_lat):
coords = polyline.decode(encoded)
return [(lon, lat) for lat, lon in coords]
routes_data = []
for i in range(len(meetings_df) - 1):
origin = meetings_df.iloc[i]
destination = meetings_df.iloc[i + 1]
route = get_route(
origin["latitude"], origin["longitude"],
destination["latitude"], destination["longitude"],
)
if route:
if "polyline" in route and "encodedPolyline" in route["polyline"]:
geometry_coords = decode_polyline(
route["polyline"]["encodedPolyline"],
origin["longitude"], origin["latitude"],
destination["longitude"], destination["latitude"],
)
else:
geometry_coords = [
(origin["longitude"], origin["latitude"]),
(destination["longitude"], destination["latitude"]),
]
routes_data.append()
routes_gdf = gpd.GeoDataFrame(routes_data, geometry="geometry", crs="EPSG:4326")
def parse_end_minutes(time_range):
end = time_range.split(" - ")[1].strip()
h, m = map(int, end.split(":"))
return h * 60 + m
def parse_start_minutes(time_range):
start = time_range.split(" - ")[0].strip()
h, m = map(int, start.split(":"))
return h * 60 + m
def parse_duration_seconds(duration_str):
return int(str(duration_str).replace("s", "").strip())
routes_gdf["gap_minutes"] = (
routes_gdf["to_time"].apply(parse_start_minutes)
- routes_gdf["from_time"].apply(parse_end_minutes)
)
routes_gdf["travel_minutes"] = routes_gdf["duration"].apply(
lambda d: round(parse_duration_seconds(d) / 60)
)
routes_gdf["buffer_minutes"] = routes_gdf["gap_minutes"] - routes_gdf["travel_minutes"]
routes_gdf["status"] = routes_gdf["buffer_minutes"].apply(
lambda b: "On Time" if b is not None and b >= 0 else "Will Be Late"
)
return routes_gdf
```
### 3. Expose to an AI agent
Only the final `nyc_meeting_routes` UDF is made **visible** on the Canvas — the upstream `gcal_today_events` and `gcal_events_geocode` UDFs are hidden. This means the agent only sees the schedule analysis tool, not the intermediate geocoding or calendar-fetching steps. The agent gets a clean interface: it can query meeting routes and lateness status without needing to understand the pipeline internals.
Return only a small amount of data from the exposed UDF so the agent's context isn't overloaded.
The Canvas publishes the visible UDF as an agent-callable endpoint via its OpenAPI specification. See Expose your Canvas to agents for how visible vs. hidden UDFs map to the OpenAPI tool list.
[Image: Canvas OpenAPI specification for agents]
### 4. Connect an AI agent
Once the Canvas is shared and its OpenAPI spec is available, you can connect an AI agent to it. Here's how to set up Claude Code:
1. **Teach Claude Code about Fused.** Paste the Fused skills into Claude Code so it understands how to interact with Fused endpoints. Tell it: "always use these skills when working with Fused."
2. **Give it the OpenAPI spec.** In the Canvas, click **Share** → **OpenAPI** and copy the `.api.json` URL (it looks like `https://udf.ai/fc_.api.json`). Paste it into Claude Code so the agent knows which tools are available and what parameters they accept.
3. **Ask questions.** The agent can now query the schedule analysis directly:
- *"Will I make all my meetings on time today?"*
- *"Which meeting am I most likely to be late to?"*
- *"How much buffer do I have between my 2pm and 3pm?"*
[Image: Querying the Fused API with Claude Code]
### 5. Adjust and re-check
After editing your calendar in Google Calendar — moving a meeting, adding buffer time — re-run the pipeline to verify the updated schedule works. Because `cache_max_age=0` is set on the calendar and geocoding UDFs, the pipeline always pulls the latest events from Google Calendar.
## Build it yourself
To run this with your own calendar you need:
**Google Maps API** — for geocoding and routing:
1. Get an API key from the Google Cloud Console
2. Enable the Routes API and Calendar API
In Fused Workbench, go to **Preferences** → **Environment** → **Secrets management** (docs) and add your API key with the name **`google_maps_api`**. The pipeline references it as `fused.secrets["google_maps_api"]`.
**Google Calendar** — must be publicly accessible:
1. Open Google Calendar → click **⋮** next to your calendar → **Settings and sharing**
2. Under **Access permissions**, check **Make available to public**
3. Copy the **Calendar ID** (under *Integrate calendar*) and paste it into the `calendar_url` parameter of the `gcal_today_events` UDF in the Canvas
## Try it out
Open the Fused Canvas to explore the live pipeline. It connects to Google Calendar, calculates travel time between your events, and flags conflicts — ready for you to query with an AI agent.
First, make a copy of the Canvas. Then follow the Share Modal guide to publish it. Once shared, click **Share** → **OpenAPI** to get the OpenAPI specification you can hand to any AI agent.
================================================================================
## Serving Live Team Data as an MCP Tool
Path: examples/live-data-mcp-endpoint.mdx
URL: https://docs.fused.io/examples/live-data-mcp-endpoint
Your team's automation writes fresh data somewhere every day. This example shows how to wrap that data in a Fused UDF so any agent — on any machine — can query it with a single command, without sharing credentials. The entire project — writing UDFs, testing, deploying, connecting — runs from Claude Code.
This is the pattern behind daily-digest, an internal Fused tool where a Claude routine scrapes AI market signals daily, writes them to a Notion page, and a Fused canvas exposes them as queryable MCP tools for the whole team.
## How it works
```
Automation (Claude routine, cron job, script…)
→ writes structured JSON to a Notion page
↓
Fused Canvas (always-on HTTP endpoint)
→ get_latest_signals — returns the N most recent entries
→ get_by_date — filters by a specific date
↓
Team agents (any machine, no Notion access needed)
fused claude add-mcp signals-canvas
→ "What are this week's top AI signals?"
```
The canvas sits between the data store and the agents. The Notion token and page ID stay inside Fused; consumers only need the canvas token. The endpoint URL is stable — if the Notion page structure changes, only the UDF needs updating, not every agent consuming it.
## Set up the Fused skill in Claude Code
Before writing any UDFs, install the Fused plugin. It teaches Claude Code how to use the `fused` CLI so you can push, test, and manage the canvas without leaving your editor:
```bash
fused claude plugin add
```
Once installed, you can ask Claude to run UDFs locally, push changes, manage secrets, and register MCP endpoints — all via `fused` commands.
## Building the canvas
### `get_latest_signals`
The primary tool — returns the N most recent entries from the shared Notion store.
This UDF reads from Notion. Set `NOTION_TOKEN` and `SIGNALS_PAGE_ID` in Fused Secrets before deploying. The UDF uses the `notion-client` package.
```python
# get_latest_signals
@fused.udf
def udf(n: int = 5):
"""
Returns the N most recent signals from the team signals store.
Use when the user asks about recent highlights, what's new this week,
or the latest updates — not for questions about a specific past date.
n: number of signals to return (default 5, max 20)
"""
from notion_client import Client
notion = Client(auth=fused.secrets["NOTION_TOKEN"])
blocks = notion.blocks.children.list(
block_id=fused.secrets["SIGNALS_PAGE_ID"]
)["results"]
code_blocks = [b for b in blocks if b["type"] == "code"]
if not code_blocks:
return pd.DataFrame()
signals = json.loads(code_blocks[0]["code"]["rich_text"][0]["text"]["content"])
df = pd.DataFrame(signals)
df["date"] = pd.to_datetime(df["date"])
return df.sort_values("date", ascending=False).head(min(n, 20))
```
### `get_by_date`
A companion tool for historical lookups — lets agents answer questions about a specific day:
```python
# get_by_date
@fused.udf
def udf(date: str = "2026-05-28"):
"""
Returns signals for a specific date (YYYY-MM-DD).
Use when the user references a particular past date.
For recent or latest signals, use get_latest_signals instead.
date: ISO date string (e.g. "2026-05-20")
"""
from notion_client import Client
notion = Client(auth=fused.secrets["NOTION_TOKEN"])
blocks = notion.blocks.children.list(
block_id=fused.secrets["SIGNALS_PAGE_ID"]
)["results"]
code_blocks = [b for b in blocks if b["type"] == "code"]
if not code_blocks:
return pd.DataFrame()
signals = json.loads(code_blocks[0]["code"]["rich_text"][0]["text"]["content"])
df = pd.DataFrame(signals)
df["date"] = pd.to_datetime(df["date"]).dt.date.astype(str)
return df[df["date"] == date]
```
Both UDFs read the same Notion page. The canvas wires them together, and the MCP endpoint exposes both as distinct tools. The docstrings tell agents which one to pick.
## Test and deploy from Claude Code
With the Fused skill installed, the full workflow runs from Claude Code.
### Test locally
Ask Claude to run the UDF before pushing it:
```bash
fused run "" get_latest_signals.py --engine local
```
The `--engine local` flag runs in your environment — no network call, no Fused compute. Use it to catch import errors and logic bugs before deploying.
### Push to Fused
Put both UDFs in a directory and push the canvas:
```bash
fused canvas push ./signals-canvas/
```
This creates (or updates) a canvas named `signals-canvas` with both UDFs. Any UDFs missing from the local directory are removed from the remote canvas, so the canvas always reflects what's in the directory.
### Set secrets
Add the Notion credentials to Fused Secrets so the UDFs can authenticate:
```bash
fused secrets set NOTION_TOKEN your_token_here
fused secrets set SIGNALS_PAGE_ID your_page_id_here
```
### Register the MCP with Claude Code
Once the canvas is live, register it as an MCP server:
```bash
fused claude add-mcp signals-canvas
```
Claude Code can now discover and call both tools. Share the canvas name with teammates — they run the same command to connect.
## Update the endpoint
When the UDF needs changing, edit the file locally and push again:
```bash
fused canvas push ./signals-canvas/
```
The endpoint updates immediately. Agents connected to it get the new behavior on the next call — no reconnection needed.
## Using it from Claude Code
Once connected, Claude picks the right tool based on the query:
- *"What are the top 3 AI signals from this week?"* → calls `get_latest_signals(n=3)`
- *"Were there any notable open-source releases yesterday?"* → calls `get_latest_signals(n=10)`, filters in reasoning
- *"What was in the digest on May 20th?"* → calls `get_by_date(date="2026-05-20")`
## Why not connect agents directly to Notion?
The Notion MCP server exists and works. The Fused layer earns its place in three specific situations:
- **You don't want to share Notion credentials.** The `NOTION_TOKEN` lives in Fused Secrets. Each teammate connects via a canvas token — revokable independently of the Notion setup.
- **The endpoint needs to stay stable.** If you restructure the Notion page, only the UDF changes. Any agent connected to the canvas continues working without reconfiguration.
- **The raw Notion structure is noisy.** A UDF normalizes field names, drops internal columns, and enforces a clean schema — so agents get predictable output rather than "whatever Notion returns."
If you own the workspace end-to-end and only one agent reads from it, direct Notion MCP is simpler. The Fused layer is worth adding when multiple people or agents consume the same endpoint.
## See also
- Building UDFs for Agents
- Connecting AI to Data
- Fused Secrets
- Tokens & endpoints
- Querying Overture Maps with an AI Agent — a more complex MCP example with multiple tools
================================================================================
## Maxar Satellite Imagery
Path: examples/maxar-satellite-imagery.mdx
URL: https://docs.fused.io/examples/maxar-satellite-imagery
_A guide showing how to use Fused to get all of Maxar's Open Data from all the available STAC catalogs and explore the imagery_
### Requirements
- Access to Fused
## Summary
Working with Fused UDFs also give you the option to easily use functions defined in other UDFs. In practice this means we've created a `common` public UDF that contains some functions we've found useful when working with any type of data.
You can explore it yourself by directly reading the code in Github. If you see any functions you'd like to use, we strongly recommend you use `fused.load()` and pass the latest commit hash at the time you want to use it (see pinning to commit hash):
```python
commit_hash = "fbf5682" # Latest commit hash of https://github.com/fusedio/udfs/blob/main/public/common at time of writing
common = fused.load(f"https://github.com/fusedio/udfs/tree//public/common/")
```
Each Maxar Event itself contains multiple collections. We created a simple function that loops over all the available `UNIQUE_ID/collection.json`, reads them an appends them into a single GeoDataFrame:
Looking at the `WildFires-LosAngeles-Jan-2025/collections.json` file:
```json
,
],
"extent": ,
"temporal":
},
"title": "Los Angeles Wildfires 2025",
"description": "Driven by strong Santa Ana winds, multiple wildfires are burning in the Los Angeles, California, area. More than 40,000 acres and more than 12,300 structures have burned; at least 19 people have died.",
"license": "CC-BY-NC-4.0"
}
```
So we create `stac_to_gdf_maxar` to:
- Loop over all the `UNIQUE_ID/collection.json` files
- Read each `collection.json` file
- Extract the metadata & extent of each collection
- Convert the `extent` into a GeoDataFrame
- Concat all into a single GeoDataFrame
Once again, you can directly read the code in Github to see exactly how we do this
You can easily rename your UDFs in Workbench. Rename this UDF to `Maxar_Open_Data_STAC_single_catalog` so we can call it later directly by name.
Make sure to save your UDF with `Cmd + S` (or `Ctrl + S` on Windows / Linux) or in the Workbench UI for these changes to take effect.
And here we get all the images for the Los Angeles Wildfires 2025 event:
[Image: Single collection Maxar STAC]
## Aggregating all available data
### Getting all `events`
To be able to explore all of Maxar's Open Data Program we now need to run this specific UDF over all the available events.
We'll do this in 2 steps:
- Fetch all the event names
- Use `fused.submit()` to fetch all the STAC Collections for each event name
```python showLineNumbers
@fused.udf
def udf():
from pystac import Catalog
@fused.cache
def getting_stac_collection(stac_url = "https://maxar-opendata.s3.amazonaws.com/events/catalog.json"):
root_catalog = Catalog.from_file(stac_url)
collections = root_catalog.get_collections()
return [collection.id for collection in collections]
collections = getting_stac_collection()
print(f"")
return collections
```
Let's break this UDF down:
- We're using `@fused.cache` to cache the Catalog request so our UDF doesn't need to do this request each time we execute it. It prevents being rate limited and doing the same request over and over against the same endpoint
- We're returning a list (`collections`) so if you run this in Workbench you'll notice nothing shows up on the map! That's also why we print the first 5 rows.
Read through the Best Practices for more handy tips on how to write efficient and easy to debug UDFs
This UDF returns a list of all the available event names currently accessible through Maxar's Open STAC Catalog:
```python
# doctest: skip
>>> print(f"")
['BayofBengal-Cyclone-Mocha-May-23', 'Belize-Wildfires-June24', 'Brazil-Flooding-May24', 'Cyclone-Chido-Dec15', 'Earthquake-Myanmar-March-2025']
```
[Image: Maxar STAC Events]
### Preparing `fused.submit()` to run in parallel
We're going to use `fused.submit()` to run our first UDF in parallel. To do this we need a few things:
- Prepare our inputs (in this case the name of all the `events`). We recommend doing this as a dataframe as it's simple to read & work with
- Pass our first UDF to `fused.submit()`
```python showLineNumbers
@fused.udf
def udf():
from pystac import Catalog
@fused.cache
def getting_stac_collection(stac_url = "https://maxar-opendata.s3.amazonaws.com/events/catalog.json"):
root_catalog = Catalog.from_file(stac_url)
collections = root_catalog.get_collections()
return [collection.id for collection in collections]
collections = getting_stac_collection()
collections_df = pd.DataFrame()
dfs_out = fused.submit(
"Maxar_Open_Data_STAC_single_catalog",
collections_df,
debug_mode=True # Using debug to run just the 1st event at first
)
print(f"")
return dfs_out
```
Let's unpack this:
- We're calling the UDF called `"Maxar_Open_Data_STAC_single_catalog"` that we renamed earlier over `collections_df`. At the time of writing this example this represents 46 events.
- We use `fused.submit(..., debug_mode = True)` to run only the 1st value from `collections_df`. This allows us to test that our `fused.submit()` job is written correctly.
`fused.submit()` allows you to run a single over a list / dataframe of inputs in parallel. Under the hood Fused spins up many realtime instances (see technical docs for details) that will each run the given UDF (in this case `"Maxar_Open_Data_STAC_single_catalog"`) all at the same time.
This is a powerful way to scale a process with just a single function call.
Read the dedicated Docs section on `fused.submit()` for more
[Image: Maxar submit debug mode]
### Getting all Maxar open data
Once we're confident that our `fused.submit()` job setup is correct, we can remove `debug_mode=True` (it's set to `False` by default) and run our UDF across all events.
We can also increase the number of `max_workers`, as we have 46 events and the default `max_workers` is set to 32. We can ask Fused server to thus spin up more instances for us so this parallel job is even faster:
```python showLineNumbers
@fused.udf
def udf():
from pystac import Catalog
@fused.cache
def getting_stac_collection(stac_url = "https://maxar-opendata.s3.amazonaws.com/events/catalog.json"):
root_catalog = Catalog.from_file(stac_url)
collections = root_catalog.get_collections()
return [collection.id for collection in collections]
collections = getting_stac_collection()
collections_df = pd.DataFrame()
dfs_out = fused.submit(
"Maxar_Open_Data_STAC_single_catalog",
collections_df,
max_workers=50, # Increasing the number of max_workers as we have more than events than the default value
)
print(f"")
return dfs_out
```
After a few seconds, we get back a `GeoDataFrame` containing all the Maxar open data STAC catalogs:
[Image: Maxar submit all STACs]
This allows us to do a few different things:
- Explore _all_ of the available Maxar Open Data on a map directly. This helps us see what data Maxar has available that might be of interest, to compare image quality across areas for example.
- Offer a wide variety of high resolution imagery to query against. For example retrieving as much the cloud free imagery as possible
## Choosing 1 Event to display
With access to all the images from Maxar, we can navigate the map and choose any image we'd like to display. Let's select one and display it in Workbench.
First we can use the Runtime Tab to find the URL of an image we'd like to display:
```python showLineNumbers
@fused.udf
def udf(
bounds: fused.types.Bounds,
path: str = "https://maxar-opendata.s3.amazonaws.com/events/Emilia-Romagna-Italy-flooding-may23/ard/33/031111210233/2023-05-23/1050010033C95B00-visual.tif",
chip_len=256,
display_extent: bool = True
):
from shapely.geometry import box
from rasterio.session import AWSSession
# Getting just bounds of image so we can zoom to layer
if display_extent:
print("Returning extent")
with rasterio.Env(session=AWSSession()):
with rasterio.open(path) as src:
bbox_gdf = gpd.GeoDataFrame(geometry=[box(*src.bounds)],crs=src.crs)
bbox_gdf.to_crs(4326, inplace=True)
return bbox_gdf
# Otherwise reading the GeoTiff
else:
print("Returning image")
common = fused.load("https://github.com/fusedio/udfs/tree/fbf5682/public/common/")
tiles = common.get_tiles(bounds)
arr = common.read_tiff(tiles, path, output_shape=(chip_len, chip_len))
print(f"")
return arr
```
Unpacking this UDF:
- This UDF takes :
- a `bounds` object. This allows us to pass the current Workbench Map Viewport to our UDF
- `path` represents the path on S3 to one of the images we want to display
- `chip_len`: The size of the chip size we'd like our image to display in
These images can be loaded using `bounds` and Tile mode because Maxar has provided these images as Cloud Optimized Geotiffs. This allows us to leverage their tiles & overviews and only load the data we need as we pan around the map
We can check this by reading the metadata in CLI with `gdalinfo` and see that each band has `Block`, meaning is tiled:
```bash
gdalinfo /vsis3/maxar-opendata/events/Cyclone-Chido-Dec15/ard/38/300200022120/2024-06-11/104001009713BA00-visual.tif
>>>
Driver: GTiff/GeoTIFF
...
Band 1 Block=512x512 Type=Byte, ColorInterp=Red
Overviews: 8704x8704, 4352x4352, 2176x2176, 1088x1088, 544x544, 272x272
Mask Flags: PER_DATASET
Overviews of mask band: 8704x8704, 4352x4352, 2176x2176, 1088x1088, 544x544, 272x272
Band 2 Block=512x512 Type=Byte, ColorInterp=Green
Overviews: 8704x8704, 4352x4352, 2176x2176, 1088x1088, 544x544, 272x272
Mask Flags: PER_DATASET
Overviews of mask band: 8704x8704, 4352x4352, 2176x2176, 1088x1088, 544x544, 272x272
Band 3 Block=512x512 Type=Byte, ColorInterp=Blue
Overviews: 8704x8704, 4352x4352, 2176x2176, 1088x1088, 544x544, 272x272
Mask Flags: PER_DATASET
Overviews of mask band: 8704x8704, 4352x4352, 2176x2176, 1088x1088, 544x544, 272x272
```
Running the above UDF we can for now return the extent of the image:
[Image: maxar return img extent]
This allows us to introduce 2 concepts in Workbench:
- 1. Zoom to layer
- 2. Tile / File modes
### 1. Setting a default view in Workbench
After getting the extent of our image, we're going to Zoom to layer and set this view as the default view:
This allows us to to any change we want to this UDF or pan anywhere on the map and always be able to zoom back to this default view!
### 2. Displaying the image
Now we can edit our UDF to return the image by changing `display_extent` to `False`:
```python showLineNumbers
@fused.udf
def udf(
bounds: fused.types.Bounds,
path: str = "https://maxar-opendata.s3.amazonaws.com/events/Emilia-Romagna-Italy-flooding-may23/ard/33/031111210233/2023-05-23/1050010033C95B00-visual.tif",
chip_len=256,
display_extent: bool = False
):
from shapely.geometry import box
from rasterio.session import AWSSession
# Getting just bounds of image so we can zoom to layer
if display_extent:
print("Returning extent")
with rasterio.Env(session=AWSSession()):
with rasterio.open(path) as src:
bbox_gdf = gpd.GeoDataFrame(geometry=[box(*src.bounds)],crs=src.crs)
bbox_gdf.to_crs(4326, inplace=True)
return bbox_gdf
# Otherwise reading the GeoTiff
else:
print("Returning image")
common = fused.load("https://github.com/fusedio/udfs/tree/fbf5682/public/common/")
tiles = common.get_tiles(bounds)
arr = common.read_tiff(tiles, path, output_shape=(chip_len, chip_len))
print(f"")
return arr
```
This change returns the image instead of the extent, but it returns the image all at once, because Workbench is set to "Single" mode by default
[Image: File mode array return]
If you reproduce this yourself and pan around the map you'll notice:
- We see the whole image but with a relatively low resolution.
- Nothing changes as we pan around the map (resolution doesn't change)
We can change this by setting Workbench to "Tile" mode:
Under the hood, switching to "Tile" mode tells Workbench to run this UDF not only 1 times, but by breaking it up into Mercantile tiles. This is why you see the image being broken up into a grid of tiles.
These different modes don't change _what_ code is being executed, as our `udf` didn't change. It's only changing what geospatial parameters are being passed:
- "File" mode passes the `bounds` of the current viewport (run 1 time§)
- "Tile" mode passes the `bounds` of the current viewport broken up into a grid of tiles (run 1 per each tile)
## Next steps
We've shown you how to:
- Use `fused.submit()` to run a UDF in parallel
- Use `@fused.cache` to cache requests to reduce costs and improve performance
- Use Workbench to display images in different modes
If you want to go a bit further you could:
- Explore the Best Practices to make the most of UDFs or learn handy tips to use Workbench as its fullest
- Go more in depth with "File" & "Tile" modes in Workbench
- Dive into the different ways Fused allows you to use caching to improve performance
================================================================================
## Join and Expose Messy Data to AI Agents
Path: examples/messy-data-agents.mdx
URL: https://docs.fused.io/examples/messy-data-agents
This example shows how to join data scattered across Snowflake, Google Sheets, and S3 into a single Fused pipeline, then expose the combined result to AI agents so they can answer business questions across all sources at once.
*Walkthrough: Letting AI agents talk to your data no matter where it's from. Try the Canvas →*
Real-world data rarely lives in one place. Supplier lists sit in Snowflake, store metadata in Google Sheets, and review scores land in S3 as CSVs. Manually consolidating these sources before every analysis is slow and brittle. With Fused, you can join disparate datasets inside a UDF pipeline and expose the combined result to AI agents — no manual consolidation required.
## Building the canvas
### 1. Connect multiple data sources
Each data source is loaded by its own UDF in the Canvas. Fused can pull data from virtually anywhere — a database, a spreadsheet, a file on S3 — and the examples below are just three of the many connectors you can use.
#### Snowflake — supplier records
The `all_suppliers` UDF reads supplier records (name, address, phone, account balance) from Snowflake's TPCH_SF1 sample dataset — anyone with a Snowflake account can reproduce this. Store your Snowflake credentials using `fused.secrets[]` so the UDF can authenticate. See the Snowflake integration guide for setup details.
```python
@fused.udf
def udf(limit: int = 100):
conn = snowflake.connector.connect(
user="DEMO_APP_USER", # change this to your user id
password=fused.secrets["snowflake_demo_access_token"], # make sure to have this secret set in Fused Secrets
account="DINFVZH-WOB67667",
warehouse="COMPUTE_WH",
database="SNOWFLAKE_SAMPLE_DATA",
schema="TPCH_SF1",
)
cur = conn.cursor()
cur.execute("SELECT * FROM SUPPLIER LIMIT %s;", (limit,))
results = cur.fetch_pandas_all()
cur.close()
conn.close()
return results
```
```python
@fused.udf
def udf(
sheet_id: str = "1_utccObv7uSk-Ew92Yu3tW3roYCaZ8Shn3xhMelk24A", # replace with your sheet ID
sheet_name: str = "supplier_feedback" # replace with your sheet name
):
url = f"https://docs.google.com/spreadsheets/d//gviz/tq?tqx=out:csv&sheet="
df = pd.read_csv(url)
return df
```
```python
@fused.udf
def udf():
from shapely.geometry import Point
path = 's3://fused-asset/demos/supplier_customer_joining/supplier_locations.csv' # Demo data available on public Fused bucket
df = pd.read_csv(path)
col_map =
lat_col = col_map.get('latitude') or col_map.get('lat')
lon_col = col_map.get('longitude') or col_map.get('lon') or col_map.get('lng')
geometry = [Point(xy) for xy in zip(df[lon_col], df[lat_col])]
gdf = gpd.GeoDataFrame(df, geometry=geometry, crs='EPSG:4326')
return gdf
```
```python
@fused.udf
def udf(
num_reviews_min: float = 0,
num_reviews_max: float = 9999,
avg_rating_min: float = 0.0,
avg_rating_max: float = 5.0,
sentiment: str = "All",
nps_min: float = -100.0,
nps_max: float = 100.0,
store_type: str = "All",
staff_headcount_min: float = 0,
staff_headcount_max: float = 9999,
):
suppliers_udf = fused.load("all_suppliers")
feedback_udf = fused.load("suppliers_feedback_gdrive")
locations_udf = fused.load("supplier_locations_csv")
df_sup = suppliers_udf()
df_fb = feedback_udf()
df_loc = locations_udf()
# Normalize supplier IDs to a plain integer join key
def extract_int(s):
m = re.search(r"\d+", str(s))
return int(m.group()) if m else None
df_sup["_join_key"] = df_sup["S_SUPPKEY"].astype(int)
df_fb["_join_key"] = df_fb["supplier_id"].apply(extract_int)
df_loc["_join_key"] = df_loc["supplier_ref"].apply(extract_int)
# Merge all three on the common key
df_merged = (
df_sup
.merge(df_fb, on="_join_key", how="left", suffixes=("", "_fb"))
.merge(df_loc, on="_join_key", how="left", suffixes=("", "_loc"))
)
df_merged = df_merged.drop(columns=["_join_key", "S_ADDRESS"])
gdf = gpd.GeoDataFrame(df_merged, geometry="geometry", crs="EPSG:4326")
# Apply filters
mask = (
(gdf["num_reviews"].fillna(0) >= num_reviews_min) &
(gdf["num_reviews"].fillna(0) <= num_reviews_max) &
(gdf["avg_rating"].fillna(0) >= avg_rating_min) &
(gdf["avg_rating"].fillna(0) <= avg_rating_max) &
(gdf["net_promoter_score"].fillna(0) >= nps_min) &
(gdf["net_promoter_score"].fillna(0) <= nps_max) &
(gdf["staff_headcount"].fillna(0) >= staff_headcount_min) &
(gdf["staff_headcount"].fillna(0) <= staff_headcount_max)
)
if sentiment != "All":
mask &= gdf["sentiment"].str.lower() == sentiment.lower()
if store_type != "All":
mask &= gdf["store_type"] == store_type
return gdf[mask]
```
### 4. Connect an AI agent
Once the Canvas is shared and its OpenAPI spec is available, you can connect an AI agent to it. Here's how to set up Claude Code:
1. **Teach Claude Code about Fused.** Paste the Fused skills into Claude Code so it understands how to interact with Fused endpoints. Tell it: "always use these skills when working with Fused."
2. **Give it the OpenAPI spec.** In the Canvas, click **Share** → **OpenAPI** and copy the `.api.json` URL (it looks like `https://udf.ai/fc_.api.json`). Paste it into Claude Code so the agent knows which tools are available and what parameters they accept.
3. **Ask questions.** The agent can now query the combined dataset directly.
For more details, see the Expose your Canvas to agents guide.
### 5. Ask business questions
Once connected, an AI agent can query the combined dataset directly. For example:
- *"Which stores have the highest ratings?"*
- *"Show me the bottom-performing suppliers."*
- *"Compare average review scores across regions."*
The agent draws answers from all three sources at once — no manual data wrangling needed.
## Try it out
Open the Fused Canvas to explore the live pipeline. The Canvas connects to all three data sources, joins them, and exposes the result to an AI agent — ready for you to query.
First, make a copy of the Canvas. Then follow the Share Modal guide to publish it. Once shared, click **Share** → **OpenAPI** to get the OpenAPI specification you can hand to any AI agent.
================================================================================
## Monthly Median Composites, One Machine per Month
Path: examples/monthly-median-composite.mdx
URL: https://docs.fused.io/examples/monthly-median-composite
Cloud-free monthly composites are normally a batch job you kick off and come back to tomorrow. This canvas turns them into something you watch happen: every calendar month in your date range gets its own machine, all of them run at once, and the month grid fills in as each one publishes. Draw an AOI, pick a five-year range, press **Run pipeline** — the run in the screenshot below finished 37 monthly composites in **6.2 seconds of wall time** off **61.5 seconds of actual work**, because the work was spread across 37 machines instead of queued on one.
## Try it out
**Open the Canvas →**
A 12-month range over a few square kilometres returns in a couple of seconds. Widen to five years once you've seen the shape of it — the wall-clock time barely moves, since each extra month is an extra machine rather than an extra turn in a queue.
## 1 · Request
The widget is a MapLibre map with a **Draw box** tool; if you don't draw anything, the pipeline uses the current map view. Alongside it: a start and end date, an **Output** toggle (`NDVI median` or `RGB median`), a max cloud-cover percentage, and `Scenes / month` — leave that at `0` to composite every scene in the month, or set a small number to sample evenly across it.
**Run pipeline** packs all of that into a single JSON `pipeline_request` parameter and broadcasts it to the three nodes below, along with a `run_id` timestamp so a re-run is never mistaken for the previous one.
## 2 · Scene search
This UDF queries Fused's partitioned Sentinel-2 L2A STAC index (`s3://fused-asset/stac/sentinel-2-l2a/partitioned_2015_2025/`) for scenes whose footprint intersects your AOI, then filters on the date range and the cloud-cover limit and drops duplicate product URIs.
Rather than resolving each STAC item's assets, it derives the COG URLs directly from the product URI — mission, date, and MGRS tile parse straight into a `sentinel-cogs.s3.us-west-2.amazonaws.com` path. The output is a flat `(scene_id, datetime, band, url, cloud_cover)` table: Red, NIR and SCL for NDVI mode, plus Green and Blue for RGB.
## 3 · Monthly fan-out
The interesting node. Before any pixels move, it builds a plan from the request alone: it expands the date range into `YYYY-MM` labels, computes the output raster shape (10 m/px, capped at 640 px on the long edge), and hashes the whole request spec into a 16-character key. That key is the object-storage prefix — `fd://monthly_median/` — which means the same AOI, dates and settings always resolve to the same location.
Scenes are grouped by month, then each month becomes one argument dict and the whole list is handed to `.map()`:
```python
# doctest: skip
result = month_udf.map(
args, # one dict per calendar month
engine="remote",
max_workers=len(args), # one machine per month, all at once
worker_concurrency=1,
cache_max_age="30d",
max_retry=1,
).df()
```
`max_workers=len(args)` with `worker_concurrency=1` is what flattens the wall clock: 37 months means 37 machines, each doing one month's worth of work. On its own machine, each month reads its scenes with windowed rasterio reads across a 12-thread pool, masks clouds using the Sentinel-2 SCL classification band, computes NDVI as `(NIR − Red) / (NIR + Red)`, and takes a `nanmedian` across the stack — so a pixel that was clouded in half the month's passes still gets a value from the other half.
Each machine then publishes three small objects for its month and exits: a colorized PNG for display, a second grayscale PNG holding the quantized NDVI values, and a JSON status blob with scene count, valid-pixel coverage, elapsed seconds, and which worker ran it. Nothing is returned through the pipeline — the results go to object storage, which is what lets the view read them independently.
## 4 · Month grid
The output node recomputes the same plan from the same request, so it knows every month's storage path before a single composite exists. It signs a URL for each one and hands the browser a self-contained page, which then polls object storage once a second and swaps each card from a "queued" placeholder to the real image the moment its machine finishes. That's why the grid fills in progressively rather than appearing all at once.
Click any month to enlarge it; hover the enlarged image to read the median NDVI at that pixel, decoded client-side from the values PNG. The footer keeps a running tally, and when the last month lands it reports the wall time against the summed worker time — the number quoted at the top of this page.
This node sets `cache_max_age="0s"` deliberately. The page embeds signed URLs that expire an hour after signing, so a cached copy would eventually hand you a grid of broken images.
## About the data
| Property | Value |
|---|---|
| Imagery | Sentinel-2 L2A COGs, AWS Open Data (anonymous) |
| Scene catalog | Fused STAC index, partitioned 2015–2025 |
| Bands | Red (B04), NIR (B08), SCL — plus Green (B03) and Blue (B02) in RGB mode |
| Cloud masking | SCL classes 0, 1, 3, 7–11 |
| NDVI display range | −0.2 (built-up / bare soil) to 0.8 (dense vegetation) |
## See also
- **NDVI Time Series for Farm Fields** — the same Sentinel-2 index sampled per field centroid to produce time-series curves, rather than monthly rasters.
- **AI Change Detection** — year-over-year change from embeddings instead of a composited spectral index.
- **Parallel execution with fused.submit** — the fan-out primitive behind `.map()`.
================================================================================
## Making Overture Buildings Data Accessible to Agents
Path: examples/overture-buildings-agents.mdx
URL: https://docs.fused.io/examples/overture-buildings-agents
This example shows how to turn Fused UDF pipelines into agentic workflows: ask questions over massive datasets while compute stays behind the scenes and agents see only the scoped outputs needed to query, compare, and visualize results.
[[Image: Overture building release comparison canvas]](https://www.fused.io/canvas/fc_fused/Overture_building_release_comparison)
*Overture Building Release Comparison canvas. Try it out →*
Overture Maps ships frequent global building-footprint releases, but the data is huge: hundreds of gigabytes of geometry per release, far too much for anyone to manually diff across versions. With agentic workflows, we can flip the approach: instead of building one-off analyses for every question about data quality, expose the dataset to an agent that can query, compare, and visualize changes across releases on demand.
The key is to give the agent scoped analytics: structured summaries and interactive widgets that are easy to parse and render, while the heavy geometry and compute stay behind the scenes. By packaging these analytics as bounded MCP tools, the agent does the analytical lifting and humans stay in the loop through shareable visualizations.
We want to analyse how Overture's building dataset evolves across releases — by asking simple questions in plain language, without touching the raw data directly.
This example will help you:
- Scope UDFs as agent-friendly MCP tools with clear parameters and bounded outputs
- Join together multiple UDFs, turning a Fused Canvas into an MCP server
- Build a shareable chatbot that answers analytical questions with interactive widgets
## Getting Data
We compare two data sources across Philadelphia:
- **Philadelphia's official building footprints** — the city's authoritative layer, served from Philadelphia's ArcGIS Feature Server: polygons with height, address, and name.
```python
PHILLY_BOUNDS = (-75.27943327075063, 39.87237043855194, -74.95729745028228, 40.13778135004081)
CHUNK_SIZE = 0.02
CACHE_VERSION = "1"
PHILLY_URL = (
"https://services.arcgis.com/fLeGjb7u4uXqeF9q/arcgis/rest/services/"
"LI_BUILDING_FOOTPRINTS/FeatureServer/0/query"
)
OUT_COLS = [
"objectid",
"approx_hgt",
"building_name",
"address",
"value",
"geometry",
]
@fused.udf
def udf(bounds: str = "[-75.158176,39.938397,-75.155727,39.939866]"):
from shapely.geometry import box
def empty():
return gpd.GeoDataFrame(
columns=["objectid", "geometry"],
geometry="geometry",
crs="EPSG:4326",
)
bounds = tuple(map(float, json.loads(bounds) if isinstance(bounds, str) else bounds))
layer_minx, layer_miny, layer_maxx, layer_maxy = PHILLY_BOUNDS
minx = max(bounds[0], layer_minx)
miny = max(bounds[1], layer_miny)
maxx = min(bounds[2], layer_maxx)
maxy = min(bounds[3], layer_maxy)
if minx >= maxx or miny >= maxy:
return empty()
eps = 1e-12
col_start = int((minx - layer_minx) // CHUNK_SIZE)
col_end = int(((maxx - layer_minx) - eps) // CHUNK_SIZE)
row_start = int((miny - layer_miny) // CHUNK_SIZE)
row_end = int(((maxy - layer_miny) - eps) // CHUNK_SIZE)
frames = []
for row in range(row_start, row_end + 1):
for col in range(col_start, col_end + 1):
gdf = _load_philly_chunk(f":", CACHE_VERSION)
if gdf is not None and not gdf.empty:
frames.append(gdf)
if not frames:
return empty()
gdf = gpd.GeoDataFrame(
pd.concat(frames, ignore_index=True),
geometry="geometry",
crs="EPSG:4326",
)
if "objectid" in gdf.columns:
gdf = gdf.drop_duplicates("objectid")
gdf = gdf[gdf.intersects(box(*bounds))].copy()
if gdf.empty:
return empty()
gdf["value"] = gdf["approx_hgt"].fillna(0).astype(float)
keep = [c for c in OUT_COLS if c in gdf.columns]
return gdf[keep].reset_index(drop=True)
@fused.cache(
cache_max_age="7d",
cache_folder_path="philly_building_chunks",
cache_storage="auto",
)
def _load_philly_chunk(chunk_id, cache_version=CACHE_VERSION):
bounds = _chunk_bounds(chunk_id)
envelope = ,
}
features = []
page_size = 2000
max_features = 50000
for offset in range(0, max_features, page_size):
response = requests.get(
PHILLY_URL,
params=,
timeout=30,
)
response.raise_for_status()
batch = response.json().get("features", [])
if not batch:
break
features.extend(batch)
if len(batch) < page_size:
break
if not features:
return gpd.GeoDataFrame(
columns=["objectid", "geometry"],
geometry="geometry",
crs="EPSG:4326",
)
return gpd.GeoDataFrame.from_features(
,
crs="EPSG:4326",
)
def _chunk_bounds(chunk_id):
col, row = map(int, str(chunk_id).split(":"))
minx = PHILLY_BOUNDS[0] + col * CHUNK_SIZE
miny = PHILLY_BOUNDS[1] + row * CHUNK_SIZE
return (
minx,
miny,
min(minx + CHUNK_SIZE, PHILLY_BOUNDS[2]),
min(miny + CHUNK_SIZE, PHILLY_BOUNDS[3]),
)
```
```python
PHILLY_BOUNDS = (-75.27943327075063, 39.87237043855194, -74.95729745028228, 40.13778135004081)
CHUNK_SIZE = 0.02
CACHE_VERSION = "1"
OUT_COLS = ["id", "overture_name", "height", "geometry"]
@fused.udf
def udf(
bounds: str = "[-75.158176,39.938397,-75.155727,39.939866]",
overture_release: str = "2026-02-18-0",
):
from shapely.geometry import box
empty = lambda: gpd.GeoDataFrame(
columns=["id", "geometry"],
geometry="geometry",
crs="EPSG:4326",
)
bounds = tuple(map(float, json.loads(bounds) if isinstance(bounds, str) else bounds))
layer_minx, layer_miny, layer_maxx, layer_maxy = PHILLY_BOUNDS
minx = max(bounds[0], layer_minx)
miny = max(bounds[1], layer_miny)
maxx = min(bounds[2], layer_maxx)
maxy = min(bounds[3], layer_maxy)
if minx >= maxx or miny >= maxy:
return empty()
eps = 1e-12
col_start = int((minx - layer_minx) // CHUNK_SIZE)
col_end = int(((maxx - layer_minx) - eps) // CHUNK_SIZE)
row_start = int((miny - layer_miny) // CHUNK_SIZE)
row_end = int(((maxy - layer_miny) - eps) // CHUNK_SIZE)
frames = []
for row in range(row_start, row_end + 1):
for col in range(col_start, col_end + 1):
gdf = _load_chunk(f":", overture_release, CACHE_VERSION)
if gdf is not None and not gdf.empty:
frames.append(gdf)
if not frames:
return empty()
gdf = gpd.GeoDataFrame(
pd.concat(frames, ignore_index=True),
geometry="geometry",
crs="EPSG:4326",
)
if "id" in gdf.columns:
gdf = gdf.drop_duplicates("id")
gdf = gdf[gdf.intersects(box(*bounds))].reset_index(drop=True)
if gdf.empty:
return empty()
keep = [c for c in OUT_COLS if c in gdf.columns]
return gdf[keep]
@fused.cache(
cache_max_age="30d",
)
def _load_chunk(chunk_id, overture_release, cache_version=CACHE_VERSION):
minx, miny, maxx, maxy = _chunk_bounds(chunk_id)
overture = fused.load("UDF_Overture_Maps_Example")
gdf = overture(
bounds=[minx, miny, maxx, maxy],
release=overture_release,
overture_type="building",
theme="buildings",
)
if gdf is None or gdf.empty:
return gdf
if "names" in gdf.columns:
gdf["overture_name"] = gdf["names"].apply(
lambda v: v.get("primary", "") if isinstance(v, dict) else ("" if v is None else str(v))
)
else:
gdf["overture_name"] = ""
if "id" not in gdf.columns:
gdf["id"] = ""
keep = [c for c in OUT_COLS if c in gdf.columns]
return gdf[keep].reset_index(drop=True)
def _chunk_bounds(chunk_id):
col, row = map(int, str(chunk_id).split(":"))
minx = PHILLY_BOUNDS[0] + col * CHUNK_SIZE
miny = PHILLY_BOUNDS[1] + row * CHUNK_SIZE
return (
minx,
miny,
min(minx + CHUNK_SIZE, PHILLY_BOUNDS[2]),
min(miny + CHUNK_SIZE, PHILLY_BOUNDS[3]),
)
```
```python
@fused.udf
def udf(
map_bounds: str = "[-75.158176,39.938397,-75.155727,39.939866]",
overture_release: str = "2026-02-18-0",
):
load_overture = fused.load("load_overture_buildings")
load_philly = fused.load("load_philly_buildings")
gdf_overture = load_overture(
bounds=map_bounds,
overture_release=overture_release,
).reset_index(drop=True)
gdf_philly = load_philly(bounds=map_bounds).reset_index(drop=True)
if len(gdf_philly) == 0:
return _empty_result()
if len(gdf_overture) == 0:
gdf_philly["iou"] = 0.0
gdf_philly["gers_id"] = ""
return _finalize(gdf_philly, overture_release)
gdf_overture["area_overture"] = gdf_overture.geometry.area
gdf_philly["area_philly"] = gdf_philly.geometry.area
gdf_philly["philly_idx"] = gdf_philly.index
intersections = gpd.overlay(
gdf_philly[["philly_idx", "area_philly", "geometry"]],
gdf_overture[["id", "area_overture", "geometry"]],
how="intersection",
keep_geom_type=True,
make_valid=True,
)
if len(intersections) == 0:
gdf_philly["iou"] = 0.0
gdf_philly["gers_id"] = ""
return _finalize(gdf_philly, overture_release)
intersections["inter_area"] = intersections.geometry.area
intersections["iou"] = intersections["inter_area"] / (
intersections["area_philly"]
+ intersections["area_overture"]
- intersections["inter_area"]
)
best = (
intersections.sort_values(["philly_idx", "iou"], ascending=[True, False])
.drop_duplicates("philly_idx")
.loc[:, ["philly_idx", "iou", "id"]]
)
gdf_philly = gdf_philly.merge(best, on="philly_idx", how="left")
gdf_philly["iou"] = gdf_philly["iou"].fillna(0.0)
gdf_philly["gers_id"] = gdf_philly["id"].fillna("")
return _finalize(gdf_philly, overture_release)
def _finalize(gdf_philly, overture_release):
gdf = gdf_philly.copy()
drop_cols = [c for c in ["philly_idx", "id", "area_philly"] if c in gdf.columns]
if drop_cols:
gdf = gdf.drop(columns=drop_cols)
gdf["release"] = overture_release
ordered = ["release"] + [c for c in gdf.columns if c != "release"]
return gdf[ordered].reset_index(drop=True)
def _empty_result():
return gpd.GeoDataFrame(
columns=["release", "gers_id", "iou", "geometry"],
geometry="geometry",
crs="EPSG:4326",
)
```
```python
ALL_BOUNDS =
RELEASES = [
"2026-02-18-0",
"2026-01-21-0",
"2025-05-21-0",
"2025-04-23-0",
"2025-03-19-1",
"2025-01-22-0",
"2024-12-18-0",
]
@fused.udf
def udf():
single_udf = fused.load("compute_iou")
@fused.cache
def run_all_bounds_summary(labels_key: str, releases_key: str):
labels = list(ALL_BOUNDS.keys())
bounds_list = list(ALL_BOUNDS.values())
arg_list = []
combo_index = []
for nb_idx, (label, bounds) in enumerate(zip(labels, bounds_list)):
for release in RELEASES:
arg_list.append()
combo_index.append((nb_idx, release))
pool = single_udf.map(arg_list, max_workers=20)
pool.wait()
results = pool.results()
summary_rows = []
for (nb_idx, release), result in zip(combo_index, results):
label = labels[nb_idx]
if result is None or not isinstance(result, pd.DataFrame) or len(result) == 0:
continue
matched = result["iou"] > 0
matched_df = result.loc[matched]
release_query = (
result["release_query"].iloc[0]
if "release_query" in result.columns and len(result) > 0
else release
)
summary_rows.append()
columns = [
"neighborhood", "release", "release_query",
"philly_buildings", "matched_buildings", "match_rate",
"mean_iou_matched", "median_iou_matched",
]
if not summary_rows:
return pd.DataFrame(columns=columns)
return pd.DataFrame(summary_rows, columns=columns)
labels_key = ",".join(ALL_BOUNDS.keys())
releases_key = ",".join(RELEASES)
return run_all_bounds_summary(labels_key=labels_key, releases_key=releases_key)
```
## UDFs as Composable Building Blocks for Agents
Since each UDF is a standalone Python function with a stable HTTPS endpoint, it can be exposed as an LLM tool. But, the goal is to make UDFs agent-callable without overwhelming the context window. Fused can process large datasets (multi-GB geometry, millions of rows) inside UDFs, but it rarely makes sense to pass those raw intermediates back to an agent.
Instead, we scope tools: create downstream "tool UDFs" that call upstream pipeline UDFs, but return only the small, bounded result needed for a specific question or visualization. Internal pipeline UDFs handle the heavy lifting so the raw geometry never has to be passed to an agent directly.
**Why "small outputs" matter:**
- LLMs work best when tool responses are compact and structured.
- Large payloads quickly consume LLM context and slow down tool calling.
- Practical rule of thumb: keep tool outputs to a few MB at most (and ideally far smaller), returning summaries, aggregates, IDs, and links instead of raw features.
**Size and shape guidelines for agent-facing UDFs:**
- Return tables with tens to hundreds of rows, not millions.
- Prefer aggregations (by neighborhood, release, metric) over raw geometries.
- If geometry is required, return small samples or pre-rendered artifacts (tiles, images, widgets) rather than full feature collections.
- Make responses deterministic and bounded: clear limits, pagination, and explicit max rows / max bytes.
Pipeline UDFs remain internal; agent-facing tool UDFs act as the safe, small, stable interface.
## Exposing Results to Agents
The Fused Canvas itself becomes a shared MCP server — click **Share → Open API** in Workbench to generate an MCP-compatible endpoint. AI tools like Claude, Cursor, or any MCP-capable client can connect to this endpoint and discover your UDFs as callable tools.
See Expose your canvas to agents for more on organizing and securing agent-facing canvases.
This is the agentic development workflow: data engineers write UDFs that shrink the world, and every team — from analysts to product managers — asks questions through whatever interface they prefer. The answers are always interactive, always current, and always shareable.
## Connecting MCP Server to AI
Once the Canvas is shared, connect any AI agent to it. Here's how to set up Claude Code:
1. **Teach Claude Code about Fused.** Paste the Fused skills into Claude Code so it understands how to interact with Fused endpoints. Tell it: "always use these skills when working with Fused."
2. **Give it the OpenAPI spec.** In the Canvas, click **Share → OpenAPI** and copy the `.api.json` URL (it looks like `https://udf.ai/fc_.api.json`). Paste it into Claude Code so the agent knows which tools are available and what parameters they accept.
3. **Ask questions.** The agent can now query the Overture release data directly:
- *"Which release has the lowest IoU across all neighborhoods?"*
- *"Which neighborhood has seen the biggest increase in match rate?"*
- *"Show me the trend of IoU over time for Center City."*
[Image: AI agent querying Overture building release data]
For more details on connecting agents, see Connect an AI agent.
================================================================================
## Querying Overture Maps Data with an AI Agent
Path: examples/overture-maps-mcp-agent.mdx
URL: https://docs.fused.io/examples/overture-maps-mcp-agent
This example shows how to wrap Overture Maps Foundation open data as MCP tools on a Fused Canvas, so an AI agent can query buildings, places, and more by location or GERS ID without pulling raw geospatial data into the chat context. Explore the Canvas.
To connect any canvas to Claude Code via MCP, see Connecting AI to Data.
## Why AI Helps
Overture exposes two different entry points into the data, and the right one depends on what the user is asking:
- **STAC catalog** - best when the question starts from a place, address, bounding box, release, or theme.
- **Registry** - best when the question starts from a specific GERS ID and needs feature history or an exact lookup.
The agent's job is to understand that intent and choose the right MCP tool automatically. That means the same chatbot can answer questions like *"Are there any named buildings at Times Square, New York?"*, *"When was GERS ID `0039aaa8-f0d9-45bb-90c5-d8a6781c4fbd` first introduced?"*, and *"How many building features are in the latest release?"* without the user needing to know which data path to use.
## How It's Built
We build four UDFs, each scoped to one job, and publish them from a single Fused Canvas as an MCP server. Each UDF automatically becomes an HTTP endpoint, and the Canvas publishes an OpenAPI spec that any agent can load to discover available tools. Each tool returns only what the agent needs — bounded row counts, a fixed column set — while S3 reads, parquet scans, and geometry decoding stay inside Fused.
[Image: Fused Canvas showing the four Overture MCP tools]
- **STAC catalog as the entry point** — all tools read from `catalog.json` at `stac.overturemaps.org`, the authoritative index of releases, themes, and parquet file locations. No hardcoded S3 paths.
- **`collections.parquet` for bbox queries** — a lightweight spatial index is queried first to find only the parquet partitions that intersect the requested bbox, before reading any data.
- **Binary search on the GERS registry** — Overture publishes a registry manifest of 50 sorted files; a binary search on `max_id` pinpoints the single file containing the requested ID.
- **Address geocoding built in** — a plain address string is geocoded via Nominatim and converted to a bbox automatically, so the agent never handles coordinates directly.
## The Data Source
Overture Maps Foundation publishes open releases of global geospatial data across two entry points: a STAC catalog for browsing releases, themes, and querying features by location; and a registry at `s3://overturemaps-us-west-2/registry` for looking up any feature by its GERS ID. The six themes available are:
| Theme | Description |
|---|---|
| `buildings` | Building footprints globally |
| `places` | Points of interest, businesses, amenities |
| `transportation` | Road network segments |
| `addresses` | Address points |
| `base` | Land cover, water, land use |
| `divisions` | Administrative boundaries |
## Creating MCP Tools
The four UDFs below cover the full range of questions an agent might ask about Overture data — from catalog discovery to location queries to feature history.
### `overture_list_releases`
Lists every available release from `catalog.json`.
```
release is_latest schema_version num_themes
2026-04-15.0 True 6
2026-03-18.0 False TBD 6
```
### `overture_stac_search`
Browses themes, types, and feature counts for a given release.
```
theme type features
addresses address 472,884,309
base bathymetry 59,963
base infrastructure 149,530,606
base land 73,017,393
base land_cover 123,302,114
base land_use 54,159,685
base water 64,677,485
buildings building 2,542,597,608
buildings building_part 3,905,964
divisions division 4,597,236
divisions division_area 1,074,405
divisions division_boundary 87,804
places place 75,495,994
transportation connector 409,764,747
transportation segment 344,140,478
```
### `overture_bbox_query`
Queries features by bounding box or address (geocoded automatically). Supports all themes, returns up to `max_rows` features (default 200).
`address="Times Square, New York"`, `theme="buildings"`:
```
id type subtype class name
54b78e32-a00c-4c8e-870b-a1279c6835ba building
0039aaa8-f0d9-45bb-90c5-d8a6781c4fbd building education college Business and Liberal Arts Center
e26d5f68-186e-4162-8eba-fa04b4bd2fb9 building
f5518c97-3cd4-4faf-a1fe-2e30f72d8c02 building
ffe5fc63-8caf-4ef0-8339-68159f76354c building
```
### `overture_gers_lookup`
Looks up a single feature by GERS ID using binary search on the registry manifest in `catalog.json`, then fetches the full geometry from the exact data file.
`gers_id="0039aaa8-f0d9-45bb-90c5-d8a6781c4fbd"`:
```
id name subtype class height registry_first_seen registry_last_seen registry_last_changed
0039aaa8-f0d9-45bb-90c5-d8a6781c4fbd Business and Liberal Arts Center education college 44.2 2025-06-25.0 2026-04-15.0 2025-06-25.0
```
## See also
- Run UDFs as an API
- Slack integration
================================================================================
## PDF Scraping
Path: examples/pdf-scraping.mdx
URL: https://docs.fused.io/examples/pdf-scraping
This tutorial will show you how to:
- Search for PDFs online directly in Fused
- Turn tables in PDFs into DataFrames
_Left: Original PDF. Right: DataFrame of PDF in Workbench_
Try out a hosted app for yourself:
## Searching for PDFs
You can search for PDFs directly in Fused:
```text
Search for any PDFs from Census data that would provide me health insurance coverage & type by age.
I want the data to be available in a table format.
```
The AI Chat will provide a list of links to PDFs that are as close to your request as possible:
In its current stage we recommend you explore the PDFs for yourself to see which one matches your request best.
The first link, pointing to Census `.gov` data seems to match our request. Opening it and going to the Appendix we find what we're looking for:
## Turning PDF Tables in DataFrames
Next:
- Use the Datalab API to turn a PDF into a JSON
- Write a UDF that turns the JSON into a DataFrame
### Using a preexisting UDF
We built a UDF on top of the Datalab API that you can directly use:
```python
# in a notebook
df = fused.run(
"fsh_1IH3QxpoAIEz9qtUChfqtS",
pdf_url="https://www2.census.gov/library/publications/2024/demo/p60-284.pdf",
raw_table_idx=0
)
print(df)
```
This will _not_ return the table we're looking for. This is a simple UDF that returns each table found in the JSON from DataLab as a DataFrame
The print message will however show us all the available tables found:
```
--- Raw Table 0 ------------------------------------------------
Shape: (14, 5)
Unnamed: 0 2022 2022.1 2023 2023.1
Coverage type NaN Margin of NaN Margin of
NaN Number error1 (±) Number error1 (±)
Total 330000 130 331700 145
Any health plan 304000 746 305200 704
Any private plan2, 3 216500 1399 216800 1294
------------------------------------------------------------
--- Raw Table 1 ------------------------------------------------
Shape: (35, 10)
Unnamed: 0 Total Total.1 Total.2 Total.3 Total.4 Total.5 Total.6 Total.7 Unnamed: 9
NaN NaN Any health insurance Any health insurance Any health insurance Any health insurance Any health insurance Any health insurance NaN NaN
Characteristic NaN NaN NaN NaN Private health NaN Public health Uninsured4 Uninsured4
NaN NaN NaN NaN NaN insurance2 NaN insurance3 Uninsured4 Uninsured4
NaN NaN NaN Margin of NaN Margin of NaN Margin of NaN Margin of
NaN Number Percent error1 (±) Percent error1 (±) Percent error1 (±) Percent error1 (±)
------------------------------------------------------------
--- Raw Table 2 ------------------------------------------------
Shape: (35, 11)
Unnamed: 0 Total Total.1 Total.2 Total.3 Total.4 Total.5 Total.6 Total.7 Unnamed: 9 Unnamed: 10
NaN NaN NaN NaN NaN Any health insurance NaN NaN NaN NaN NaN
Characteristic NaN NaN NaN NaN Private health Public health Public health Uninsured4 Uninsured4 NaN
NaN NaN NaN NaN NaN insurance2 NaN insurance3 insurance3 NaN NaN
NaN NaN NaN Margin of NaN Margin of NaN Margin of NaN Margin of NaN
NaN Number Percent error1 (±) Percent error1 (±) Percent error1 (±) Percent error1 (±) NaN
------------------------------------------------------------
--- Raw Table 3 ------------------------------------------------
Shape: (29, 11)
Unnamed: 0 Total Total.1 Total.2 Total.3 Total.4 Total.5 Total.6 Total.7 Unnamed: 9 Unnamed: 10
NaN NaN Any health insurance Any health insurance Any health insurance Any health insurance Any health insurance Any health insurance NaN NaN NaN
Characteristic NaN NaN NaN NaN Private health Public health Public health Uninsured4 Uninsured4 NaN
NaN NaN NaN NaN NaN insurance2 NaN insurance3 insurance3 NaN NaN
NaN NaN NaN Margin of NaN Margin of NaN Margin of NaN Margin of NaN
NaN Number Percent error1 (±) Percent error1 (±) Percent error1 (±) Percent error1 (±) NaN
------------------------------------------------------------
--- Raw Table 4 ------------------------------------------------
Shape: (30, 11)
Unnamed: 0 Total Total.1 Total.2 Total.3 Total.4 Total.5 Total.6 Total.7 Total.8 Unnamed: 10
NaN Any health insurance Any health insurance Any health insurance Any health insurance Any health insurance Any health insurance NaN NaN NaN NaN
NaN NaN NaN NaN NaN Private health NaN Public health Uninsured4 Uninsured4 NaN
Characteristic NaN NaN NaN NaN insurance2 NaN insurance3 insurance3 NaN NaN
NaN NaN NaN Margin of NaN Margin of NaN Margin of NaN Margin of NaN
NaN Number Percent error1 (±) Percent error1 (±) Percent error1 (±) Percent error1 (±) NaN
------------------------------------------------------------
```
It looks like the table 3 matches what we're looking for:
```python
df = fused.run(
"fsh_1IH3QxpoAIEz9qtUChfqtS",
pdf_url="https://www2.census.gov/library/publications/2024/demo/p60-284.pdf",
raw_table_idx=3 # Table 3, one matching our request
)
print(df)
```
Which returns the following DataFrame:
You may notice the table has some formatting issues. These can be fixed relatively easily by asking the AI Chat to fix them.
### Build it yourself
You can make a copy of the UDF from the UDF Explorer
You will need to:
- Setup an account on DataLab
- Get an API Key
- Add `datalab` as a secret in the Preferences
And now you get edit this UDF for yourself:
## Next Steps
Now that you have a DataFrame you can explore how to build on top:
- Ask AI to visualize the data
- See how to turn any of your UDFs into an API endpoint
- Let anyone talk to this data through MCP Servers
================================================================================
## Points of Interest Site Selection
Path: examples/poi-site-selection-dashboard.mdx
URL: https://docs.fused.io/examples/poi-site-selection-dashboard
This example builds an interactive site selection dashboard that answers: **"What amenities and income levels surround a given address within a certain travel time?"**
We'll chain together multiple UDFs on a Canvas to geocode an address, compute a travel-time boundary (isochrone), pull Points of Interest from Overture Maps and median income from the US Census, aggregate everything into H3 hexagons, and display the results on a map with interactive Widgets.
```python showLineNumbers
@fused.udf
def udf(manual_address: str = "401 Haltom Rd, Fort Worth, TX 76117, USA"): # Change this to any address
from geopy.geocoders import Nominatim
from shapely.geometry import Point
geolocator = Nominatim(user_agent="fused_geocoding_udf")
result = geolocator.geocode(manual_address)
if result:
df = pd.DataFrame()
gdf = gpd.GeoDataFrame(
df,
geometry=[Point(result.longitude, result.latitude)],
crs="EPSG:4326"
)
return gdf
```
```python showLineNumbers
@fused.udf
def udf(
manual_address: str = 'Manhattan, New York, NY',
time_steps: str = '15', # Travel time in minutes
costing: str = 'truck', # Travel mode: pedestrian, bicycle, auto
):
# Load and run the geocode UDF to get coordinates
geocode_udf = fused.load("geocode_point")
geocoded = geocode_udf(manual_address=manual_address, engine='local')
lat = geocoded.lat.values[0]
lng = geocoded.lng.values[0]
# Pass coordinates to the Valhalla isochrone UDF
isochrone_udf = fused.load('latlng_isochrone_simplified')
gdf = isochrone_udf(lat=lat, lng=lng, costing=costing, time_steps=time_steps)
return gdf
```
```python showLineNumbers
@fused.udf
def udf(
lat: float = 34.0522,
lng: float = -118.2437,
costing: str = "bicycle",
time_steps: str = "15",
):
steps = [int(t.strip()) for t in time_steps.split(",")]
@fused.cache
def _get_isochrone(lat, lng, costing, time_steps_tuple):
url = "https://valhalla1.openstreetmap.de/isochrone"
params = ],
"contours": [ for t in list(time_steps_tuple)],
"costing": costing,
"polygons": 1,
}
response = requests.post(url, json=params)
response.raise_for_status()
return gpd.GeoDataFrame.from_features(response.json())
gdf = _get_isochrone(lat, lng, costing, tuple(steps))
gdf["contour_minutes"] = gdf["contour"].astype(int)
return gdf
```
```python showLineNumbers
@fused.udf
def udf(
manual_address: str = 'Manhattan, New York, NY',
poi_category: str = "cafe", # Change to: restaurant, grocery, school, park, etc.
time_steps: str = '5',
costing: str = 'pedestrian',
overture_release: str = "2026-02-18-0", # Overture Maps release version
):
# Get the isochrone boundary to determine the search area
parent_udf = fused.load('isochrone_chosen_site_overture')
result = parent_udf(
time_steps=time_steps,
costing=costing,
manual_address=manual_address,
)
# Query Overture Maps POIs within the isochrone bounding box
overture_udf = fused.load("Overture_Maps_Example")
gdf = overture_udf(
bounds=list(result.total_bounds),
release=overture_release,
theme="places",
)
# Filter by selected POI category
if gdf is not None and poi_category != "all":
if "categories" in gdf.columns:
gdf = gdf[gdf["categories"].apply(
lambda x: poi_category in str(x).lower() if x is not None else False
)]
return gdf
```
```python showLineNumbers
@fused.udf
def udf(
manual_address: str = 'Manhattan, New York, NY',
costing: str = "auto",
time_steps: str = "15",
census_variable: str = "Median Household Income in the Past 12 Months (in 2022 Inflation-Adjusted Dollars)", # Swap for any ACS variable
year: int = 2022,
):
# Get the isochrone boundary
iso_udf = fused.load("isochrone_chosen_site_overture")
df_iso = iso_udf(manual_address=manual_address, costing=costing, time_steps=time_steps)
# Load Census ACS block groups from a community UDF
acs = fused.load("https://github.com/fusedio/udfs/tree/c9bc8a2/community/sina/Census_ACS_5yr/")
df_acs = acs(bounds=df_iso.total_bounds, year=year, census_variable=census_variable)
df_acs["orig_area"] = df_acs.geometry.area
# Clip census block groups to the isochrone boundary
iso_union = df_iso.dissolve().geometry.values[0]
iso_gdf = gpd.GeoDataFrame(geometry=[iso_union], crs=df_iso.crs)
result = gpd.overlay(df_acs, iso_gdf, how="intersection")
return result
```
```python showLineNumbers
@fused.udf
def udf(manual_address: str = 'Manhattan, New York, NY', time_steps: str = '15', costing: str = 'truck'):
common = fused.load("https://github.com/fusedio/udfs/tree/507b2a3/public/common/")
parent_udf = fused.load('isochrone_chosen_site_overture')
result = parent_udf(time_steps=time_steps, costing=costing, manual_address=manual_address)
gdf = common.gdf_to_hex(result[['geometry', 'contour']], res=9)
gdf = gdf[['hex']].drop_duplicates()
return gdf
```
```python showLineNumbers
@fused.udf
def udf(hex_res: int = 9, poi_category: str = "cafe", manual_address: str = "Manhattan, New York, NY",
time_steps: str = "10", costing: str = "pedestrian", overture_release: str = "2026-02-18-0"):
common = fused.load("https://github.com/fusedio/udfs/tree/9bad664/public/common/")
con = common.duckdb_connect()
query_pois = fused.load("query_overture_pois")
gdf = query_pois(manual_address=manual_address, poi_category=poi_category,
time_steps=time_steps, costing=costing, overture_release=overture_release, preview=False, engine='local')
gdf['lat'] = gdf.geometry.y
gdf['lon'] = gdf.geometry.x
df_simple = gdf[['lat', 'lon']].copy()
result = con.sql(f"""
SELECT h3_latlng_to_cell(lat, lon, ) as hex, COUNT(*) as count_pois
FROM df_simple
GROUP BY hex
ORDER BY count_pois DESC
""").df()
return result
```
```python showLineNumbers
@fused.udf
def udf(manual_address: str = 'Manhattan, New York, NY', costing: str = 'auto', time_steps: str = '15',
census_variable: str = 'Median Household Income in the Past 12 Months (in 2022 Inflation-Adjusted Dollars)',
year: int = 2022):
parent_udf = fused.load('iso_census_intersect')
result = parent_udf(manual_address=manual_address, costing=costing, time_steps=time_steps,
census_variable=census_variable, year=year, engine='local')
del result["GEOID"]
common = fused.load("https://github.com/fusedio/udfs/tree/507b2a3/public/common/")
hex_gdf = common.gdf_to_hex(result, res=9)
hex_gdf.rename(columns=, inplace=True)
hex_gdf = hex_gdf[hex_gdf['median_income_12_months'] >= 0]
return hex_gdf[['hex', 'median_income_12_months']]
```
```python showLineNumbers
@fused.udf
def udf(manual_address: str = "Manhattan, NY", poi_category: str = "cafe",
time_steps: str = "5", costing: str = "pedestrian", overture_release: str = "2026-02-18-0"):
common = fused.load("https://github.com/fusedio/udfs/tree/507b2a3/public/common/")
con = common.duckdb_connect()
isochrone_hex_df = fused.load("isochrone_to_hex_overture")(
manual_address=manual_address, time_steps=time_steps, costing=costing)
poi_df = fused.load("pois_to_hex")(
manual_address=manual_address, poi_category=poi_category,
time_steps=time_steps, costing=costing, overture_release=overture_release)
census_df = fused.load("iso_census_to_hex")(
manual_address=manual_address, costing=costing, time_steps=time_steps)
merged_df = con.sql("""
WITH poi_dedup AS (
SELECT hex, SUM(count_pois) AS count_pois FROM poi_df GROUP BY hex
),
census_dedup AS (
SELECT hex, AVG(median_income_12_months) AS median_income_12_months FROM census_df GROUP BY hex
)
SELECT i.hex, p.count_pois, c.median_income_12_months
FROM isochrone_hex_df i
LEFT JOIN poi_dedup p ON i.hex = p.hex
LEFT JOIN census_dedup c ON i.hex = c.hex
""").df()
return merged_df
```
```json showLineNumbers
,
"children": [
, ]}},
, ,
, , ]}},
},
, , ]}},
, , , , ]}}
]
}
```
```python showLineNumbers
@fused.udf
def udf(
time_steps: str='20',
costing: str='auto',
poi_category: str='cafe',
overture_release: str='2026-02-18-0',
manual_address: str = 'San Francisco',
):
# Load merged POI + Census hex data
merge_udf = fused.load('merge_poi_census_data')
poi_hex_data = merge_udf(
manual_address=manual_address, poi_category=poi_category,
time_steps=time_steps, costing=costing,
overture_release=overture_release, engine='local')
dynamic_col = f"number of '' POIs"
poi_hex_data = poi_hex_data.rename(columns=)
poi_hex_data[dynamic_col] = poi_hex_data[dynamic_col].fillna(0)
# Load isochrone boundary and geocoded point
isochrone_gdf = fused.load("isochrone_chosen_site_overture")(
manual_address=manual_address, time_steps=time_steps, costing=costing)
geocoded_gdf = fused.load("geocode_point")(
manual_address=manual_address, engine='local')
# Build deck.gl layers and render as HTML
map_utils = fused.load("https://github.com/fusedio/udfs/tree/3ada22d/community/milind/map_utils/")
layers = [
}},
) + Census (H3 Hex)",
"config": , "opacity": 0.9}}},
}},
]
return map_utils.deckgl_layers(layers=layers, basemap="dark", theme="dark")
```
```json showLineNumbers
}", "label": "Total Points of Interest"}}
```
```json showLineNumbers
}", "label": "Median Average Income (thousand USD)"}}
```
```json showLineNumbers
}", "title": "Distribution of Median Income"}}
```
### Live map preview
Interact with the POI map below — hexagons are colored by POI density, with the isochrone boundary and geocoded point overlaid. Try it out ->
## Performance
- **First run** (~30s): all UDFs execute end-to-end — geocoding, isochrone calculation, Overture queries, Census overlay, and hex aggregation
- **Subsequent runs with the same inputs** (near-instant): Runs with pre-executed parameters are cached so the dashboard loads immediately
This gives you the best of both worlds — if you change a UDF, you don't need to redeploy anything; but if multiple people open the same dashboard with the same inputs, they get cached results with no wait.
### See also
- Expose this Canvas as an MCP server so an AI agent can query the dashboard
================================================================================
## RAG Any Docs with Fused
Path: examples/rag-overture-docs.mdx
URL: https://docs.fused.io/examples/rag-overture-docs
**_TL;DR: With a few Fused UDFs you can turn any public docs site into a fully searchable RAG pipeline — connect data, process it, and expose it as an API._**
This example shows how to build a RAG pipeline over Overture Maps documentation using Fused — from ingestion to a queryable API endpoint. The same pattern works for any public docs site.
[[Image: RAG pipeline Canvas overview]](https://www.fused.io/canvas/fc_15I0YWafBBT90ruAM4DUF9?bounds=2458%2C206%2C8995%2C4381)
*Try it out on Fused Canvas →*
## How it works
The pipeline follows a crawl → embed → search pattern, implemented as four UDFs:
- `site_to_llmstxt` — **crawls** any docs site via its sitemap and writes a clean `llms.txt` to S3
- `docs_ragging` — **embeds** the `llms.txt` in chunks and stores vectors in a LanceDB table at `/mount/lancedb/`
- `overture_docs_searching` — **searches** by embedding an incoming question and returning the most relevant chunks
- `ai_utils` — shared helpers for embedding, LanceDB reads/writes, and agentic tool calling
---
## Step 1: Crawl Any Docs Site into `llms.txt`
The first challenge is getting clean text out of a docs site. HTML is noisy: navbars, footers, sidebars, and scripts all get in the way. The `site_to_llmstxt` UDF accepts any docs site URL, crawls every page in parallel via `crawl_page.map()`, strips boilerplate, and writes a single clean `llms.txt` to S3.
```python showLineNumbers
@fused.udf(cache_max_age='1d') # Caching for 1d to prevent accidental reruns
def udf(
base_url: str = "https://docs.overturemaps.org/",
site_name: str = "Overture_maps_documentation",
mode: str = "full", # "curated" | "full"
sitemap_path: str = "/sitemap.xml",
max_pages: int = 0, # 0 = no limit, useful for testing
output_dir: str = "s3://fused-asset/demos/llms_txt/",
):
"""Generate an llms.txt from any public docs site with a sitemap."""
from xml.etree import ElementTree
from bs4 import BeautifulSoup
def fetch(url: str, retries: int = 3, timeout: int = 15) -> str | None:
headers =
for attempt in range(retries):
try:
r = requests.get(url, headers=headers, timeout=timeout)
r.raise_for_status()
return r.text
except Exception as e:
if attempt == retries - 1:
print(f" ✗ Failed : ")
return None
time.sleep(1.5 ** attempt)
def parse_sitemap(xml_text: str) -> list[str]:
"""Parse a sitemap or sitemap index and return all page URLs."""
try:
root = ElementTree.fromstring(xml_text)
except ElementTree.ParseError:
return []
ns =
urls = []
for sitemap_tag in root.findall("sm:sitemap", ns):
loc = sitemap_tag.find("sm:loc", ns)
if loc is not None and loc.text:
sub_xml = fetch(loc.text.strip())
if sub_xml:
urls.extend(parse_sitemap(sub_xml))
for url_tag in root.findall("sm:url", ns):
loc = url_tag.find("sm:loc", ns)
if loc is not None and loc.text:
urls.append(loc.text.strip())
return urls
sitemap_url = base_url.rstrip("/") + sitemap_path
print(f"Fetching sitemap: ")
sitemap_xml = fetch(sitemap_url)
if not sitemap_xml:
raise RuntimeError(f"Could not fetch sitemap at ")
all_urls = parse_sitemap(sitemap_xml)
print(f"Found URLs in sitemap")
skip_patterns = re.compile(
r"/(tags?|search|404|sitemap|assets|_|static)/|"
r"\.(xml|json|txt|png|jpg|svg|css|js)$",
re.IGNORECASE,
)
page_urls = [u for u in all_urls if not skip_patterns.search(u)]
page_urls = sorted(set(page_urls))
if max_pages > 0:
page_urls = page_urls[:max_pages]
print(f"Processing doc pages (mode=)")
print(f"Crawling pages in parallel...")
results = crawl_page.map(
[ for u in page_urls],
engine="local",
max_workers=10,
).df()
pages = results.to_dict("records")
print(f"Successfully extracted pages")
header = f"# \n\n"
if mode == "curated":
lines = [header, "## Pages\n"]
for p in pages:
lines.append(f"- []()")
lines.append(f"\n---\n\nGenerated from sitemap. Total pages: ")
output = "\n".join(lines)
else:
sep = "=" * 80
sections = [header, sep + "\n"]
for p in pages:
sections.append(f"## ")
sections.append(f"URL: \n")
if p["content"]:
sections.append(p["content"])
sections.append("\n" + sep + "\n")
sections.append(f"\n---\n\nGenerated from sitemap. Total pages: ")
output = "\n".join(sections)
if output_dir:
safe_name = re.sub(r"[^\w]+", "_", site_name.lower()).strip("_")
output_path = output_dir.rstrip("/") + f"//llms.txt"
with fsspec.open(output_path, "w") as f:
f.write(output)
print(f"Written to ")
return output_path
else:
return output
@fused.udf
def crawl_page(url: str = "https://docs.overturemaps.org/"):
"""Fetch and extract content from a single docs page. Used by udf.map()."""
from bs4 import BeautifulSoup
headers =
for attempt in range(3):
try:
r = requests.get(url, headers=headers, timeout=15)
r.raise_for_status()
html = r.text
break
except Exception:
if attempt == 2:
return None
time.sleep(1.5 ** attempt)
else:
return None
soup = BeautifulSoup(html, "html.parser")
for tag in soup.select(
"nav, footer, aside, .sidebar, .toc, .table-of-contents, "
".navbar, .pagination, .edit-this-page, script, style, "
"[class*='sidebar'], [class*='navbar'], [class*='footer'], "
"[class*='toc'], [class*='pagination'], [class*='breadcrumb'], "
"[aria-hidden='true']"
):
tag.decompose()
title = ""
h1 = soup.find("h1")
if h1:
title = h1.get_text(strip=True)
if not title:
title_tag = soup.find("title")
if title_tag:
title = re.sub(r"\s*[|–—-].*$", "", title_tag.get_text(strip=True))
content_el = (
soup.find("article")
or soup.find(class_=re.compile(r"md-content|markdown|content|documentation"))
or soup.find("main")
or soup.body
)
if content_el is None:
return pd.DataFrame([])
def extract_content(el) -> str:
from bs4 import NavigableString, Tag
BLOCK_TAGS =
def walk(node) -> str:
if isinstance(node, NavigableString):
return str(node)
if not isinstance(node, Tag):
return ""
tag = node.name.lower() if node.name else ""
if tag == "pre":
inner_code = node.find("code")
lang = ""
if inner_code and inner_code.get("class"):
for cls in inner_code.get("class", []):
m = re.match(r"language-(\w+)", cls)
if m:
lang = m.group(1)
break
code_text = (inner_code or node).get_text()
return f"\n\n```\n\n```\n\n"
if tag == "code":
text = node.get_text()
if "\n" in text:
return f"\n\n```\n\n```\n\n"
return f"``"
if tag in :
level = int(tag[1])
return f"\n\n \n\n"
parts = [walk(child) for child in node.children]
text = "".join(parts)
if tag in BLOCK_TAGS:
text = text.strip()
return f"\n\n\n\n" if text else ""
return text
raw = walk(el)
return re.sub(r"\n", "\n\n", raw).strip()
content = extract_content(content_el)
description = ""
for line in content.splitlines():
line = line.strip()
if len(line) >= 40 and not line.startswith("#") and not line.startswith("`"):
description = line[:160] + ("..." if len(line) > 160 else "")
break
return pd.DataFrame([])
```
```python showLineNumbers
# ===================== CONFIGURATION =====================
LANCEDB_TABLE_NAME = "overture_docs_17_04_2026"
LANCEDB_BASE_PATH = "/mount/lancedb/"
EMBEDDING_MODEL = "qwen/qwen3-embedding-8b"
SOURCE_S3_PATH = "s3://fused-asset/demos/llms_txt/overture_maps_documentation/llms.txt"
CHUNK_SIZE = 1300
OVERLAP_PERCENT = 0.15
OVERLAP_SIZE = int(CHUNK_SIZE * OVERLAP_PERCENT)
EMBEDDING_BATCH_SIZE = 400
# =========================================================
@fused.udf(cache_max_age=0)
def udf(
table_name: str = LANCEDB_TABLE_NAME,
overwrite: bool = True,
):
ai = fused.load("ai_utils")
print(f"Fetching docs from: ")
with fsspec.open(SOURCE_S3_PATH, "r") as f:
content = f.read()
print(f"Fetched characters")
chunks = chunk_with_overlap(content, CHUNK_SIZE, OVERLAP_SIZE)
print(f"Created chunks")
df = pd.DataFrame(
)
print("Embedding chunks via ai_utils.embed_df...")
df = ai.embed_df(
df,
text_col="code",
embedding_col="embedding",
provider="qwen",
embedding_model=EMBEDDING_MODEL,
batch_size=EMBEDDING_BATCH_SIZE,
max_workers=16,
)
print(f"Writing rows to LanceDB table: at ")
table_path = ai.write_table(
df,
table_name=table_name,
embedding_col="embedding",
base_path=LANCEDB_BASE_PATH,
overwrite=overwrite,
)
visible_tables = ai.list_tables(base_path=LANCEDB_BASE_PATH)
table_exists_now = ai.table_exists(table_name, base_path=LANCEDB_BASE_PATH)
return pd.DataFrame(
)
def chunk_with_overlap(text, chunk_size, overlap_size):
"""Split text into chunks with fixed overlap."""
chunks = []
start = 0
text_length = len(text)
while start < text_length:
end = start + chunk_size
chunk = text[start:end]
chunks.append(chunk)
start = end - overlap_size
if start + chunk_size >= text_length and start < text_length:
final_chunk = text[start:]
if final_chunk and final_chunk not in chunks and len(final_chunk) > overlap_size:
chunks.append(final_chunk)
break
return chunks
```
```python showLineNumbers
@fused.udf
def udf(
question: str = "Latest release?",
):
"""Searches Overture docs RAG for matching areas in the documentation."""
collection_name = "overture_docs_17_04_2026"
limit = 30
base_path = "/mount/lancedb/"
ai = fused.load("ai_utils")
if not ai.table_exists(collection_name, base_path=base_path):
available = ai.list_tables(base_path=base_path)
return pd.DataFrame(
' was not found."],
"base_path": [base_path],
"available_tables": [", ".join(available) if available else "(none)"],
}
)
df = ai.search(question, collection_name, top_k=limit)
if df is None or len(df) == 0:
return pd.DataFrame()
cols_to_drop = [c for c in ["_distance", "_relevance_score", "vector", "embedding"] if c in df.columns]
if cols_to_drop:
df = df.drop(columns=cols_to_drop)
return df.head(5)
```
Asking `"Latest release?"` returns a ranked table of the most relevant doc chunks:
```
chunk_id similarity code
215 0.123 ## Overture Maps Engineering Blog ... August 20, 2025 — 2025-08-20.0 release ...
164 0.112 The 2025-08-20.0 release of Overture data and v1.11.0 of the schema are now available ...
214 0.095 April 22 - Exploring our beta release / May 16 - 2024-05-16-beta.0 release notes ...
213 0.092 ### 2026 — January 21 - 2026-01-21 release notes / February 11 - Overture Has ...
165 0.092 The base, buildings, divisions, places, and transportation themes are in GA ...
```
Each search request re-embeds the question on every call. Wrap the UDF with `@fused.cache` to cache results for repeated or identical queries and cut latency significantly.
---
## Using This for Any Site
To RAG a different docs site, update these values:
1. In `site_to_llmstxt`, update `base_url` on line 2 of the UDF parameters:
```python
base_url: str = "https://docs.myproject.io/", # URL of the docs site to crawl
```
2. In `docs_ragging`, update the two constants at the top of the file:
```python
SOURCE_S3_PATH = "s3://your-bucket/myproject/llms.txt" # S3 path where site_to_llmstxt wrote the output
LANCEDB_TABLE_NAME = "myproject_docs_v1" # unique name for this project's vector table
```
3. In `overture_docs_searching`, update `collection_name` to match:
```python
collection_name = "myproject_docs_v1" # must match LANCEDB_TABLE_NAME above
```
- Large document sets may take time to index — crawling and embedding hundreds of pages runs in parallel but is still I/O and compute-bound
- Re-indexing overwrites the existing LanceDB table and re-embeds all chunks, which incurs additional embedding API costs; only re-index when the source docs change significantly
---
## Connect to Slack
Once the search UDF is live as a Fused API endpoint, you can connect it to Slack so your team can query the docs directly from a channel. The Fused Slack integration lets you wire any UDF endpoint to a Slack bot — no extra infrastructure needed.
[Image: Fused Bot answering Overture docs questions in Slack]
---
## Next Steps
To go further with this pipeline, explore these pages:
- Caching — cache embedding and search results to avoid recomputing on repeated queries
- UDFs as API — expose any UDF as an HTTP endpoint with a shared token
- Slack integration — route search queries through a Slack bot
- Building for Agents — use UDF endpoints as tools in an agentic workflow
Try the full pipeline on Fused Canvas to see all four UDFs wired together.
================================================================================
## Realtime Filtering with DuckDB
Path: examples/realtime-filtering-duckdb.mdx
URL: https://docs.fused.io/examples/realtime-filtering-duckdb
# Realtime data filtering with DuckDB WASM
This tutorial will show you how to build a real time filtering visualization using DuckDB WASM:
Open map in a new tab
This map:
- Fetches data from a Fused UDF (which aggregates & cleans data into hex5), uses DuckDB WASM to filter it and renders the output on a map
- Data comes from Source Cooperative based on 2024 USDA Crop Data Layer
This is how to build this step by step:
## 1. Querying data with DuckDB WASM
The simplest way to use DuckDB in the browser is to use DuckDB WASM to query a hosted file.
You can directly edit the SQL query directly here:
This UDF:
- Signs S3 once so browser can fetch it
- Loads parquet as view `df`
- Auto-runs query as you type (small debounce)
- 'Run' button stays disabled until data is ready and becomes optional
1. Imports, signing the S3 URL and HTML template start
```python
# doctest: skip
common = fused.load("https://github.com/fusedio/udfs/tree/6b98ee5/public/common/")
@fused.udf(cache_max_age = 0)
def udf(
data_url: str = "s3://fused-sample/demo_data/airbnb_listings_nyc.parquet",
initial_sql: str = """ SELECT * from df """
):
"""
DuckDB-WASM SQL viewer with VIRTUALIZED table:
- Loads parquet as view `df`
- Auto-runs query as you type
- Table renders only visible rows for performance
"""
signed_url = fused.api.sign_url(data_url)
html = f"""
```
Key points:
– `fused.api.sign_url` gives a temporary public link; the HTML string is built with an f-string so the signed URL can be interpolated.
2. UI elements (textarea, button, status, result container)
```python
# doctest: skip
```
Key points
– The query is auto-executed after a short pause (250 ms) once the user stops typing, but a manual “Run” button and a keyboard shortcut are also provided.
Link to code
Then call this UDF directly in DuckDB WASM:
Link to code
**1️⃣ Load the shared helper library**
```python
common = fused.load("https://github.com/fusedio/udfs/tree/6b98ee5/public/common/")
```
**2️⃣ UDF definition & parameters**
```python
# doctest: skip
@fused.udf
def udf(
data_url: str = "https://www.fused.io/server/v1/realtime-shared/UDF_Airbnb_listings_nyc_parquet/run/file?dtype_out_raster=png&dtype_out_vector=parquet",
initial_sql: str = """\
SELECT
room_type,
ROUND(AVG(price_in_dollar), 2) AS avg_price,
COUNT(*) AS listings
FROM df
WHERE price_in_dollar IS NOT NULL AND room_type IS NOT NULL
GROUP BY room_type
ORDER BY avg_price DESC;"""
):
```
- `data_url` – where DuckDB will read the Parquet file from.
- `initial_sql` – the starter query placed in the textarea.
**3️⃣ Docstring (high-level description)**
```python
# doctest: skip
"""
DuckDB-WASM SQL viewer :
- Loads parquet from a public/accessible URL as view `df`
- Auto-runs query as you type (small debounce)
- Run button disabled until data is ready
"""
```
**4️⃣ HTML skeleton (head, style & body)**
```python
# doctest: skip
html = f"""
```
The HTML places the UI elements on the page and injects the `data_url` and `initial_sql` values.
**5️⃣ JavaScript – DuckDB-WASM loading & data registration**
```javascript
```
Key points
– The query is auto-executed after a short pause (250 ms) once the user stops typing, but a manual “Run” button and a keyboard shortcut are also provided.
Link to code
1️⃣ Imports & UDF signature
```python
common = fused.load(
"https://github.com/fusedio/udfs/tree/abf9c87/public/common/"
)
@fused.udf
def udf(
data_url: str = "https://www.fused.io/server/v1/realtime-shared/…/run/file?dtype_out_raster=png&dtype_out_vector=parquet",
mapbox_token: str = "pk.eyJ1IjoiaXNhYWNmdXNlZGxhYnMi…",
center_lng: float = -73.9857,
center_lat: float = 40.7484,
zoom: int = 9,
initial_sql: str = "SELECT * FROM df LIMIT 100;",
):
```
common = fused.load(...) – loads a small helper library that provides html_to_obj, which later converts the raw HTML string into an object that the Workbench can render.
The UDF parameters let the user change the data source, Mapbox token, map centre, zoom level and the default SQL query without editing the code.
2️⃣ The HTML template (client-side UI)
```python
# doctest: skip
html = f"""
…
## Real world example: Visualizing Crops in the USA
Data: USDA Crop Data Layer (2024)
From: Source Cooperative
Format: Fused repartitioned this into H3 hexagons as hex7
```bash
https://source.coop/fused/hex/release_2025_04_beta/cdl/hex7_2024.parquet
```
### Processing Data with DuckDB
Before we display the data we want to:
- Remove any nodata (`0`) in CDL
- Calculate the percentage that each crop type makes up of the total area of each hex8 cell
- Return `lat / lon` coordinates for each hex8 cell to be able to display the data on a map
We can write a simple UDF to do this for us:
Link to code
This returns a dataframe directly. We can then pass this data to another UDF to render it on a map.
## Live filtering on Map
Link to code
Here's how the map is built:
1. Data Source: Fetches Parquet from previous UDF
2. Browser Database: Loads into DuckDB WASM with H3/spatial extensions
3. Real-time Filtering: Applies SQL WHERE conditions on user input
4. Geometry Generation: Converts H3 cells to hexagon boundaries
5. Map Visualization: Renders colored hexagons with tooltips
6. Live Statistics: Shows count, area, and averages for filtered data
### Explore on canvas
You can see this tutorial as a Fused Canvas:
Open in a new tab
## Want to try it yourself?
Sign up for a free Fused account and build on top of any of the User Defined Functions directly in Fused!
================================================================================
## Seismic Hazard Mapping
Path: examples/seismic-hazard-mapping.mdx
URL: https://docs.fused.io/examples/seismic-hazard-mapping
_Cross-reference earthquake hazard with building density over Italy to find where the most buildings sit in the highest-risk zones._
Open the live canvas: Seismic Hazard Mapping
## The problem
Italy sits at the collision of the African and Eurasian tectonic plates. Cities like L'Aquila and Amatrice have suffered devastating earthquakes in living memory. The goal: **find where the highest concentration of buildings overlaps with the highest seismic hazard**.
That requires joining two datasets that have nothing in common structurally — a raster and a vector — from two different organizations. H3 makes it trivial.
## Data sources
- **Seismic hazard** — GEM Foundation OpenQuake Global Seismic Hazard Map (GSHM 2023). Each pixel is a Peak Ground Acceleration (PGA) value for a 1-in-475-year event.
- **Buildings** — Overture Maps building footprints for Italy, as pre-partitioned GeoParquet files.
## Canvas overview
[Image: Canvas overview: OpenQuake hazard pipeline (top) and Overture buildings pipeline (bottom), joined on H3]
| Step | UDF | What it does |
|------|-----|--------------|
| 1 | `openquake_explorer` | Downloads the OpenQuake GeoTIFF and saves it to S3 once |
| 2 | `loading_seismic_data` | Reads the TIF for a given bounding box, returns a pixel array |
| 3 | `hexagonified_seismic_hazard` | Converts raster pixels → H3 hexagons, averaging hazard per cell |
| 4 | `Overture_partitions` | Shows Overture partition footprints across Italy |
| 5 | `Overture_to_hex_single_file` | Aggregates building area per H3 hex via DuckDB spatial SQL |
| 6 | `join_over_buildings` | Inner-joins both hex tables on H3 cell ID |
| 7 | Widget | Scatter chart + KPI tiles + map |
## 1. Ingest the seismic GeoTIFF
The OpenQuake dataset is distributed as a ZIP containing a GeoTIFF. Rather than downloading it on every run, this UDF fetches it once and writes it to S3. Subsequent UDFs read from S3 directly.
```python showLineNumbers
@fused.udf
def udf(save_to_s3: bool = True):
url = "https://cloud.openquake.org/public.php/dav/files/6SnFk2f92JEr76H"
@fused.cache # <-- fetch once, re-use on subsequent runs
def fetch_zip(url):
response = requests.get(url, timeout=60)
response.raise_for_status()
return response.content
content = fetch_zip(url)
zf = zipfile.ZipFile(io.BytesIO(content))
tif_name = "v2023_1_pga_475_rock_3min.tif"
s3_path = f"s3://fused-asset/demos/seismic_data/"
print(f"Extracting from ZIP...")
tif_bytes = zf.read(tif_name)
print(f"Extracted bytes")
if save_to_s3:
fs = s3fs.S3FileSystem()
with fs.open(s3_path, "wb") as f:
f.write(tif_bytes)
print(f"Saved to ")
return pd.DataFrame([])
```
```python showLineNumbers
@fused.udf
def udf(
bounds: fused.types.Bounds = [6.6272, 36.6197, 18.4802, 47.0921],
chip_len: int = 512
):
path: str = 's3://fused-asset/demos/seismic_data/v2023_1_pga_475_rock_3min.tif'
common = fused.load('https://github.com/fusedio/udfs/tree/6750f1f/public/common/')
arr = common.read_tiff_safe(bounds, path, chip_len, max_pixel=10 ** 8)
print(arr)
return arr
```
```json showLineNumbers
}",
"geometryColumn": "geometry",
"tooltip": ["file_id"],
"style":
}
]
}
}
```
```python showLineNumbers
@fused.udf
def udf(
path: str = "s3://fused-asset/overture/2026-03-18.0/theme=buildings/type=building/part=2/36.parquet",
res: int = 6,
bounds: fused.types.Bounds = [6.6272, 36.6197, 18.4802, 47.0921],
chip_len: int = 512,
h3_res: int = 6,
):
overture_udf = fused.load("Overture_to_hex_single_file")
df_buildings = overture_udf(path=path, res=res)
seismic_udf = fused.load("hexagonified_seismic_hazard")
df_seismic = seismic_udf(bounds=bounds, chip_len=chip_len, h3_res=h3_res)
# normalize to lowercase hex string (H3 canonical format) before joining
df_buildings["hex"] = df_buildings["hex"].apply(lambda x: format(int(x), 'x'))
df_seismic["hex"] = df_seismic["hex"].apply(lambda x: format(int(x), 'x'))
return pd.merge(df_buildings, df_seismic, on="hex", how="inner") # <-- join on H3 cell
```
```json
,
"children": [
,
"children": [
},
}
]
},
,
"children": [
} WHERE sesimic_hazard > 70 AND building_count > 1000",
"style": "flex: 1; background: #212326; border-radius: 8px; padding: 8px 14px; border: 1px solid #E8FF59; color: #E8FF59;"
}
},
} WHERE sesimic_hazard > 70 AND building_count > 1000",
"style": "flex: 1; background: #212326; border-radius: 8px; padding: 8px 14px; border: 1px solid #E8FF59; color: #E8FF59;"
}
},
} WHERE sesimic_hazard > 70 AND building_count > 1000",
"style": "flex: 1; background: #212326; border-radius: 8px; padding: 8px 14px; border: 1px solid #E8FF59; color: #E8FF59;"
}
}
]
},
,
"children": [
} WHERE sesimic_hazard > 70 AND building_count > 1000",
"h3Column": "hex",
"tooltip": ["hex", "sesimic_hazard", "building_count"],
"legend": ,
"style": ,
"opacity": 0.85,
"coverage": 0.9,
"extruded": false
}
}
]
}
},
}",
"pointColor": "#E8FF59",
"pointOpacity": 0.75,
"defaultPointSize": 5,
"pointStrokeWidth": 0.35,
"pointStrokeColor": "#1a1c1f",
"minBubbleSize": 10,
"maxBubbleSize": 140,
"showGrid": true,
"showLegend": true,
"xAxisFontSize": 11,
"yAxisFontSize": 11,
"animationMs": 300,
"style": "flex: 1; min-width: 260px; background: #212326; border-radius: 10px; padding: 10px; min-height: 0; overflow: hidden;"
}
}
]
}
]
}
```
Customize colors, opacity, and coverage in the Visualization tab. You can also use the AI-driven widget to describe style changes in plain language and have them applied instantly.
## Next steps
- **Swap the AOI** — replace the Italy bounds with Turkey, Japan, or the US West Coast
- **Add vulnerability** — join a third dataset (e.g. building age from Overture) to weight exposure by structural fragility
- **Run at scale** — use `my_udf.map()` to process all Overture partitions in parallel
Further reading:
- Converting to H3
- Resolution guide
- Geospatial ingestion
================================================================================
## Sharing Canvas Dashboards
Path: examples/sharing-canvas-dashboards.mdx
URL: https://docs.fused.io/examples/sharing-canvas-dashboards
# Create Interactive Dashboards
Any Canvas can be turned into a shareable dashboard by clicking the "Share" button in the top right corner. Sharing also creates a **canvas token** (`fc_***`) for API access: UDFs on the canvas can be called at `udf.ai/fc_/.` (see Tokens & Endpoints).
[Image: Share modal]
This gives you a few options:
- **Embed mode** — Hide all UI chrome for embedding in external sites
- **Lock view** — Prevent panning and zooming
- **Show outline** — Show outline panel in sidebar
- **Show code panel** — Show code/AI panel when a node is selected
For example, selecting "Embed mode" allows you to `iframe` a canvas as a dashboard:
## Best Practices
- Use interactive components (see the Standalone Maps reference)
- Add "Text" elements to annotate your dashboard
================================================================================
## Site Selection Analysis
Path: examples/site-selection-analysis.mdx
URL: https://docs.fused.io/examples/site-selection-analysis
This tutorial will:
- Explore 2 store chains in Sacramento, CA
- Create drive-time catchments around each store
- Join catchments with census data (population, income)
- Determine which stores best reach target populations with minimal competition
This tutorial shows the prompts we use to build this analysis.
Since AI is non-deterministic, prompts may not always work identically. You might need to manually adjust prompts or code.
Consider prompts as starting points, not final answers.
## Getting Data
We'll use these online datasets for this analysis:
- Starbucks point locations as our target stores. Available on Kaggle
- McDonald's point locations as our competitor stores. Available on Kaggle
- Census Data to get population and average income of the area around each store.
### Starbucks & McDonald's locations
Ask the AI to write a UDF loading data from the Kaggle cURL API:
[Image: Downloading Starbucks data from Kaggle]
```text
Open this specific dataset and return points as a dataframe based on this Kaggle curl request:
#!/bin/bash
curl -L -o ~/Downloads/store-locations.zip\
https://www.kaggle.com/api/v1/datasets/download/starbucks/store-locations
```
To simplify this tutorial, we've pre-downloaded the data:
- Starbucks: `s3://fused-sample/demo_data/catchment_analysis/starbucks_location.pq`
- McDonald's: `s3://fused-sample/demo_data/catchment_analysis/mcdonalds_location.pq`
### Census Data
Get Census data from the official US Census website.
For simplicity, we've pre-downloaded Census Block Groups (BG) data:
- Sacramento, CA Census Block Groups: `s3://fused-sample/demo_data/catchment_analysis/acs_bg_ca_2022_sacramento_geoparquet.parquet`
## Exploring Data in Fused
Create 1 UDF per dataset to explore them as individual layers on the Map View.
### Starbucks
Create a new UDF and ask the AI:
```text
can you open this starbucks location file (s3://fused-sample/demo_data/catchment_analysis/starbucks_sacramento.pq) and return as geodataframe
```
### McDonald's
Create another UDF and ask the AI:
```text
can you open this macdonalds location file (s3://fused-sample/demo_data/catchment_analysis/mcdonalds_sacramento.pq) and return as geodataframe
```
### Census Data
Create another UDF and ask the AI:
```text
Can you open this file using geopandas as return df s3://fused-sample/demo_data/catchment_analysis/acs_bg_ca_2022_sacramento_geoparquet.parquet
```
After renaming each UDF and changing store colors in the Visualization Tab:
You can copy paste these JSONs into the Visualization Tab to have similar colored stores:
**Starbucks**
```
,
"getFillColor": [
208,
208,
208,
40
]
}
}
```
**McDonalds**
```
,
"getFillColor": [
208,
208,
208,
40
]
}
}
```
[Image: Stores and Census Block Groups in Sacramento]
## Creating isochrones
The Fused AI Chat uses other UDFs as inspiration to adapt existing code for new use cases.
We'll use the Get Isochrone UDF as AI inspiration. This UDF:
- Uses the Valhalla API to create drive-time isochrones around points
- Returns a GeoDataFrame with isochrone polygons
Perfect for our Starbucks analysis! We need:
- 15-minute drive time (`auto` costing mode)
Since this API is slow, we'll break down the problem:
1. Use `Get_Isochrone` UDF for 3 points first
2. Validate isochrones look correct
3. Manually increase API calls
Steps:
- Open the `Get_Isochrone` UDF in Workbench (no copy needed)
- Go to your `starbucks_location` UDF chat
- Include `@Get_Isochrone` in your AI request for context
Ask the AI (in the chat for your `starbucks_location` UDF):
```text
Use @Get_Isochrone to create 15-minute driving isochrones around each starbucks location.
Test this out with just 3 points first so we make sure this is working correctly at first
```
You'll see 3 isochrones on the map:
You can manually increase the API calls if desired. For simplicity, we provide the output file:
`s3://fused-sample/demo_data/catchment_analysis/starbucks_isochrones_15min.pq`
## Joining catchments & census data
Next, we'll:
- Take each store's **15-minute catchment polygon** and find intersecting **block groups**
- From intersecting BGs, compute catchment metrics:
- **Population** sum inside catchment
- **Median income**
- **Block group count** (number of intersecting BGs)
In a new UDF, ask the AI:
```text
Write a UDF that intersects each store’s 15-minute catchment polygon (from catchment_udf) with Sacramento block groups.
For each store, use gpd.overlay to compute:
- Total population (sum across intersecting block groups)
- Median household income (median of intersecting block groups)
- Block group count (distinct GEOIDs touched)
Aggregate results per store into a clean summary table and return that.
The block groups for sacramento are here: `s3://fused-sample/demo_data/catchment_analysis/sacramento_block_groups.pq`
The starbucks catchments are here: `'s3://fused-sample/demo_data/catchment_analysis/starbucks_isochrones_15min.pq'`
use 4326 projection for all
Return the catchment geometries so I can still visualize the gdf on a map
```
## Competitor Analysis
In the same UDF, ask the AI for competitor analysis:
```text
Enhance the catchment UDF to measure competition:
- Load McDonald’s store locations from
`s3://fused-sample/demo_data/catchment_analysis/mcdonalds_sacramento.pq`.
- For each Starbucks 15-minute catchment polygon, count how many McDonald’s points fall inside (point-in-polygon).
- Add this as a new column `Competition` to the per-store summary table.
How many mcdonalds (competitor to starbucks in this case) are present in each catchment?
```
Track how many of *our own stores* are in each catchment:
```text
Enhance the catchment UDF to measure cannibalization:
- Load Starbucks store locations from
`s3://fused-sample/demo_data/catchment_analysis/starbucks_sacramento.pq`.
- For each Starbucks 15-minute catchment polygon, count how many *other* Starbucks points fall inside (exclude the store itself).
- Add this as a new column `Cannibalization` to the per-store summary table.
```
## Ranking stores
Rank stores based on:
- Highest catchment population
- Highest median income
- Lowest competition
- Lowest cannibalization (i.e. number of our own stores)
So let's ask the AI:
```text
Based on all the info here, give me a ranking of which stores I should invest in the most. I care about starbucks stores that have:
- The highest income
- Highest population
- Least amount of competitors
- Least amount of cannibilization
Create a ranking formula for Starbucks stores based on these criteria
```
Ask the AI to plot a chart. When your UDF returns a dataframe, AI chat suggests chart creation:
[Image: AI suggesting to create a chart from the dataframe]
This visualizes the results:
[Image: Starbucks location ranking showing population, income, competition and cannibalization metrics]
The AI ranking shows top stores have:
- Highest income
- Lowest population
Since all AI output is Python code, you can examine and fine-tune the ranking logic!
## Next Steps
Improvement ideas:
- Fine-tune ranking, drive times, etc.
- Add more data sources
- Scale to entire US using `fused.submit()`
================================================================================
## Standalone HTML Maps
Path: examples/standalone-html-maps.mdx
URL: https://docs.fused.io/examples/standalone-html-maps
# Create Standalone Maps
In Fused Canvas you can create workflows by connecting UDFs together and visualizing them on a map.
We've created a simple UDF to serve as a map utils library to help you create standalone maps.
## How to visualize your UDF on a standalone map
In Canvas, create a simple UDF that returns a GeoDataFrame or a DataFrame with hex cells.
```python
# vancouver_open_data
@fused.udf
def udf():
@fused.cache
def load_geojson():
# Load GeoJSON directly from the URL into a GeoDataFrame
DATA_URL = "https://raw.githubusercontent.com/visgl/deck.gl-data/master/examples/geojson/vancouver-blocks.json"
return gpd.read_file(DATA_URL)
return load_geojson()
```
We have built a utils library to create common map visualizations using DeckGL:
```python
@fused.udf
def udf():
data = fused.run('vancouver_open_data')
# Load map utilities for creating interactive maps
map_utils = fused.load("https://github.com/fusedio/udfs/tree/7848ea5/community/milind/map_utils/")
# Widgets give greater control over the layout of the map widgets
widgets = ,
"legend": False,
"geocoder": "top-left",
}
config =
},
"tooltip": ["valuePerSqm", "growth"]
}
return map_utils.deckgl_layers(
layers = [],
widgets=widgets
)
```
This creates a simple map that you can then embed anywhere:
We put together a template Canvas you can use to see how to visualize:
- Static data (GeoDataFrame, DataFrame, etc.)
- Tiled data for any dataset too large to serve as a single file
You can download this canvas and then import it by drag & dropping the `.zip` file in your Workbench.
================================================================================
## NDVI Time Series for Farm Fields
Path: examples/temporal-pixel-analysis.mdx
URL: https://docs.fused.io/examples/temporal-pixel-analysis
This canvas answers two questions: *how is the vegetation in these fields changing over time, and do different fields behave differently?* Draw a box over California cropland, set a date range, press **Run pipeline** — and you get a map of analyzed fields linked to NDVI time-series charts, grouped by how each field behaves across the season.
## Try it out
**Open the Canvas →**
Begin with a box that's roughly 10–20 km across in the Central Valley and a single year's date range. The pipeline runs faster and the chart dashboard is easier to read with 20–60 fields than with several hundred.
## 1 · Draw your area and set the date range
The input widget shows a satellite map centered on California's Central Valley. You can pan and zoom and let the pipeline use the current map view, or click **Draw box** for a precise selection. Set `Start date` and `End date`, then press **Run pipeline** — the bounds and dates flow downstream automatically.
## 2 · Build the field × scene URL table
Two UDFs run in sequence here:
**Sentinel-2 URL helpers** is a shared library that knows how to build Cloud-Optimized GeoTIFF (COG) URLs from Sentinel-2 STAC metadata. It's a dependency, not something you interact with directly.
**Build field × scene URL table** does the actual work: it queries the California Statewide Crop Mapping (CA SCM) field boundary dataset and finds every field whose bounding box intersects your AOI. It then looks up cloud-free Sentinel-2 L2A scenes for your date range and builds a `(field, band, date, URL)` table ready for pixel sampling.
## 3 · Sample pixels at field centroids
This UDF reads the single Sentinel-2 pixel at the centroid of each field for every matching scene. It uses `fused.submit` to fan out the reads in parallel across row groups, so hundreds of fields and dates complete in roughly the same wall-clock time as a handful.
## 4 · NDVI dashboard
The output node computes NDVI — `(NIR − Red) / (NIR + Red)` — for each field and date, then:
- **Clusters the fields** using K-Means on three statistics (mean NDVI, variability, seasonal range) into up to four behavioral groups, labeled descriptively: *High & Stable*, *Low & Variable*, etc.
- **Renders a linked dashboard** — a satellite map on the left shows every analyzed field colored by cluster. The right panel shows one NDVI time-series chart per cluster, with a shaded 10–90th percentile band, a median line, and faint individual field traces.
Hover over a field on the map to highlight its NDVI curve in the chart. Hover over a line in a chart to highlight the corresponding field on the map.
The input widget exposes `max_farms`, `max_workers`, and `cloud_cover` as tunable parameters to trade off coverage, speed, and scene availability.
## About the data
| Property | Value |
|---|---|
| Field boundaries | California Statewide Crop Mapping (CA SCM), Source Cooperative / fiboa, CC-0, 438k polygons |
| Satellite imagery | Sentinel-2 L2A COGs, AWS Open Data (anonymous) |
| Scene catalog | Fused STAC index, partitioned 2015–2025 |
| Spectral bands used | Red (B04) + NIR (B08) for NDVI |
## See also
- **AI Change Detection** — a spatial view of *where* things changed using AI embeddings, rather than a time series of *how* individual fields changed.
- **STAC catalogs guide** — how Fused reads Sentinel-2 scenes via STAC.
- **Parallel execution with fused.submit** — how the pixel sampling step fans out across row groups.
================================================================================
## Building a Repeatable Thumbnail Generator with Claude Code
Path: examples/thumbnail-generator.mdx
URL: https://docs.fused.io/examples/thumbnail-generator
[Image: The thumbnail generator canvas — inputs panel on the left, live preview on the right]
Every time we host a LinkedIn Live webinar, we need a thumbnail — speaker photos, title, brand colors, consistent layout. This example shows how we replaced a repetitive workflow with a Fused Canvas that anyone on the team can open, fill in, and download in under a minute.
## The problem
Making a good-looking thumbnail from scratch every time has three failure modes:
- **Inconsistency** — fonts, spacing, and colors drift between events.
- **Bottleneck** — only the person who made the first one knows how.
- **Friction** — a Figma file or Photoshop template is hard to share, version, or hand off.
What we wanted: one URL, shared with the team, where swapping speakers and a title produces a pixel-perfect 960×540 PNG ready for LinkedIn.
## How we built it
### 1. Start with an HTML prototype
Before touching Fused, we had Claude Code generate a self-contained HTML file that matched the thumbnail design: dark background with a grid overlay, a large Barlow Condensed title with an accent-color highlight, circular speaker avatars, and the Fused logo in the top corner.
This step is fast and visual — you can open the file in a browser and iterate on styling without any infrastructure. The HTML becomes the ground truth for everything that follows.
### 2. Set up the Fused Claude Code skill
Install the Fused plugin for Claude Code so Claude understands how Fused canvases, widgets, and the CLI work:
```bash
fused claude plugin add
```
This gives Claude Code access to the `canvas-toml`, `json-ui-schemas`, and `fused-cli` skills — the context it needs to write correct canvas files without guessing.
### 3. Ask Claude Code to build the canvas
With the HTML prototype and Fused skills loaded, we asked Claude Code to turn the HTML file into a Fused Canvas. It produced three files:
**`canvas.toml`** — defines the two-node layout: an inputs panel on the left and an HTML preview on the right, wired together with an edge so parameter changes propagate live.
```toml
type = "canvas"
version = 2
name = "Thumbnail Generator"
[canvas]
edges = [["inputs", "preview"]]
[[canvas.nodes]]
udfName = "inputs"
title = "Inputs"
x = 0.0
y = 0.0
zIndex = 1
width = 460
height = 860
[[canvas.nodes]]
udfName = "preview"
title = "Preview"
x = 490.0
y = 0.0
zIndex = 2
width = 1020
height = 660
```
**`inputs.json`** — a JSON UI widget with all the controls: accent color picker, title text area, camera inputs for speaker photos with crop-position sliders, and a resolution dropdown for the export.
**`preview.html`** — the thumbnail HTML from step 1, with `$param_name` placeholders substituted live as inputs change. A download button at the bottom uses html2canvas to The three-file structure (`canvas.toml` + `inputs.json` + `preview.html`) is the full spec for a Fused Canvas. An agent with the Fused skills loaded can generate all three from a description or an existing HTML file without any manual steps.
### 4. Validate and push
Before pushing, validate the widget JSON:
```bash
fused json-ui validate inputs.json
```
Then push the canvas folder directly to Fused:
```bash
fused canvas push ./LinkedIn_Live_thumbnail_generator --canvas LinkedIn_Live_thumbnail_generator
```
Canvas names must match `[a-zA-Z0-9_]` — no spaces or hyphens.
That's it. The canvas is live at `fused.io/workbench//LinkedIn_Live_thumbnail_generator` and the whole team can open it immediately.
### 5. Iterate in the canvas, version in git
The canvas folder lives in a git repo. Changing a color, adjusting spacing, or adding a third speaker slot means editing the files locally, running `fused canvas push` again, and committing. The canvas URL stays the same — teammates refresh and get the update.
The inputs panel in the final canvas:
- **Accent color** — color picker, default `#E5FF44`
- **Title** — text area; `\n` for line breaks, `word` to highlight a word in accent color
- **Fused Logo** — camera/upload input with the logo pre-loaded as default
- **Speaker 1 & 2** — photo upload, crop-position slider (0 = top of photo, 100 = bottom), name, role
- **Download resolution** — 1× (960×540), 2× (1920×1080), 3× (2880×1620)
## Try it out
Open the live canvas, swap in your own speakers and title, and hit **Download PNG**.
Clone the canvas folder, edit `inputs.json` to change defaults (pre-load your team's logo and headshots), and push under a new canvas name. Anyone with the URL can generate on-brand thumbnails without Figma, Photoshop, or any design tool.
================================================================================
## Web Scraping
Path: examples/web-scraping.mdx
URL: https://docs.fused.io/examples/web-scraping
This tutorial demonstrates how to use Fused User Defined Functions (UDFs) to scrape web pages and extract structured data. We'll walk through building a dataset of public schools from a specific geographic area using three different scraping approaches.
## Introduction
Imagine you need to compile a comprehensive list of public schools for a specific area. A quick Google search leads us to the Top Ranked Public Schools website. This site contains multiple subpages for different locations like Connecticut or New York.
Each page displays only a limited number of schools initially, requiring users to click "see more" to load additional results. Our goal is to programmatically extract data from these pages and generate CSV files for any location without manual navigation.
## Method 1: Individual Page Scraping
When you know the exact page URL and whether it contains paginated content, use the scrapegraph web scraper UDF to extract structured data from single pages.
### Parameters
| Parameter | Type | Description |
|-----------|------|-------------|
| **url** | string | The target webpage URL to scrape |
| **query** | string | Natural language description of data to extract |
| **output_schema** | dict (optional) | Expected structure of the output data |
| **pagination_pages** | int (optional) | Number of paginated pages to scrape |
| **scroll_pages** | int (optional) | Number of scroll actions for infinite scroll pages |
### Example Usage
**Using the Python SDK:**
```python
df = fused.run(
"fsh_3A1QcdR5kJEwmDSkYxc934",
url="https://www.publicschoolreview.com/top-ranked-public-schools/connecticut/tab/all/num/1",
query="Extract school names, ranks, and addresses",
pagination_pages=2
)
df.head()
```
**Output:**
## Method 2: Batch Scraping Multiple Pages
When you need to scrape data from multiple known URLs simultaneously, use the scrapegraph multi scraper UDF. This UDF creates a unified output schema across all pages and processes them in parallel using fused.submit calls.
### Parameters
| Parameter | Type | Description |
|-----------|------|-------------|
| **urls** | list | List of webpage URLs to scrape in batch |
| **query** | string | Natural language description of data to extract |
| **pagination_pages** | int (optional) | Number of paginated pages to scrape per URL |
| **scroll_pages** | int (optional) | Number of scroll actions for infinite scroll pages |
### Example Usage
**Using the Python SDK:**
```python
df = fused.run(
"fsh_5WETmX04oWgWtSCxwv1ZNr",
urls=[
"https://www.publicschoolreview.com/top-ranked-public-schools/new-york/tab/all/num/1",
"https://www.publicschoolreview.com/top-ranked-public-schools/new-york/tab/all/num/3",
],
query="Extract school names, grade ranges, and addresses for all NYC schools"
)
df.head()
```
**Output:**
## Method 3: Intelligent Crawling and Scraping
When you only know the top-level domain but not the specific page URLs, use the firecrawl search UDF to automatically discover and scrape relevant pages. This UDF crawls the website, identifies the most relevant pages based on your search criteria, and extracts the requested data.
### Parameters
| Parameter | Type | Description |
|-----------|------|-------------|
| **url** | string | The base URL to crawl and search |
| **search_prompt** | string | Natural language description of content to find |
| **extraction_prompt** | string | Natural language description of data to extract |
### Example Usage
**Using the Python SDK:**
```python
df = fused.run(
"fsh_6mpu2dqoEBc1W80GjhZLSM",
url="https://www.publicschoolreview.com",
search_prompt="best public schools in connecticut",
extraction_prompt="Extract school names, grade ranges, and addresses"
)
df.head()
```
**Output:**
## Using HTTPS API Endpoints
For integration into external systems or automated workflows, you can generate shared HTTPS endpoints for these UDFs. This allows you to retrieve data in CSV format using simple HTTPS requests.
### Available Endpoints
**Individual Page Scraper:**
```bash
curl "https://www.fused.io/server/v1/realtime-shared/fsh_3A1QcdR5kJEwmDSkYxc934/run/file?format=csv"
```
**Multi-Page Scraper:**
```bash
curl "https://www.fused.io/server/v1/realtime-shared/fsh_5WETmX04oWgWtSCxwv1ZNr/run/file?format=csv"
```
**Intelligent Crawler:**
```bash
curl "https://www.fused.io/server/v1/realtime-shared/fsh_6mpu2dqoEBc1W80GjhZLSM/run/file?format=csv"
```
## Making it Your Own
These are community UDFs that you can fork and customize for your needs. Simply click on the "Make a copy to modify" in the Fused Workbench to create your own copy.
**API Setup Required**: You'll need to configure your own API keys for third party services as fused secrets
## See Also
- Turning any UDF into an API
- Letting anyone talk to your data through MCP Servers
- Scaling out UDFs with `fused.submit()`
*Note: These web scraping features are currently in active development and you may encounter occasional issues.*
================================================================================
## Zonal Stats
Path: examples/zonal-stats.mdx
URL: https://docs.fused.io/examples/zonal-stats
_A step-by-step guide for data scientists._
### Requirements
- access to Fused
- access to a Jupyter Notebook
- the following Python packages installed locally:
- `fused`
- `pandas`
- `geopandas`
## 1. Using Fused for a Zonal Statistics Example
In this guide, we'll estimate how much alfalfa grows in zones defined by polygon geometries.
This will show you how to:
- Bring in your data
- Write a UDF to process the data
- Run the UDF remotely & in parallel
- Create an app that shows your results and can be shared with anyone
```mermaid
---
title: Overview of Zonal Stats
---
graph LR
A("Continuous Field
(raster image)") --> D
B("Areas of Interest
(vector polygons)") --> D
D --> E(Areas of Interest
w/ Attributes)
```
## 2. Bring in your data
You'll first upload your own vector table with `fused.ingest`. This spatially partitions the table and writes it in your specified S3 bucket as a GeoParquet file. You'll then calculate zonal stats over a raster array of alfalfa crops in the USDA Cropland Data Layer (CDL) dataset.
This example shows how to geo partition polygons of Census Block Groups for Utah, which is a Parquet table with a `geometry` column. You can follow along with this file or any vector table you'd like. Read about other supported formats in Ingest your own data.
First, set up a local Python environment, install the latest Fused SDK with `pip install fused`, and authenticate.
Now, write the following script to geo partition your data. Pass the URL of the table to `fused.ingest`. When you kick off an ingest job with `run_batch`, Fused spins up a server to geo partition your table and writes the output to the path specified by the `output` parameter. In the codeblock below, `fd://tl_2023_49_bg/` is the base path to your account's S3 bucket.
```python showLineNumbers
job = fused.ingest(
input="https://www2.census.gov/geo/tiger/TIGER2023/BG/tl_2023_49_bg.zip",
output="fd://tl_2023_49_bg/"
)
job_id = job.run_batch()
```
After running the preceeding code, open fused.io/jobs to view the job status and logs.
Once the job is complete, you can preview the output dataset in the File Explorer.
You can also ingest data without installing anything by using this Fused App.
For the next step you can use the path to the data you just ingested or, if you prefer, this public sample table: `s3://fused-asset/data/tl_2023_49_bg/`.
[Image: Zonal Stats Parquet Files in Workbench File Explorer]
## 3. Write a UDF to process the data
To see the data as we process it, we will write a UDF in the Fused Workbench. As you write code in the Map Builder you'll see how visualization results, logs, and errors show up immediately.
Map Builder is deprecated and hidden by default. To follow along you can re-enable it under Workbench Preferences → **Deprecated features** → **Enable map view**. For new work, use the Fused Map widget instead — see the Widget API for all available widgets.
To write a UDF simply wrap a Python function with the decorator `@fused.udf`.
The first parameter of this UDF, `bounds`. It is reserved for Fused to pass a `GeoDataFrame` which the UDF may use to spatially filter datasets, and usually corresponds to a web map tile. This enables Fused to run the UDF for each tile in the viewport to distribute processing across multiple workers.
The `year` parameter is used to structure the S3 path of the CDL GeoTiff which the utility function `read_tiff` reads for the area defined by `bounds`. The `crop_id` parameter 36 corresponds to alfalfa the CDL colormap, which the UDF uses to mask the raster array.
Fused lets you import utility Modules from other UDFs with `fused.load`. Their code lives in the public UDFs repo.
- `read_tiff` loads an array of the CDL dataset for the specified `bounds` extent and `year`
- `table_to_tile` loads the table you geo partitioned for the specified `bounds` extent
- `geom_stats` calculates zonal statistics by aggregating the `arr` variable over the geometries specified by the `gdf`
```python showLineNumbers
@fused.udf
def udf(
bounds: fused.types.Bounds = None,
year: int = 2020,
crop_id: int = 36
):
# Convert bounds to tile
common = fused.load("https://github.com/fusedio/udfs/tree/fbf5682/public/common/")
zoom = common.estimate_zoom(bounds)
tile = common.get_tiles(bounds, zoom=zoom)
# Load CDLS data
arr = common.read_tiff(
tile,
input_tiff_path=f"s3://fused-asset/data/cdls/_30m_cdls.tif"
)
# Mask for crop
arr = np.where(np.isin(arr, [crop_id]), 1, 0)
# Load polygons
gdf = common.table_to_tile(
bounds,
table='s3://fused-asset/data/tl_2023_49_bg/',
min_zoom=5,
use_columns=['NAMELSAD', 'GEOID', 'MTFCC', 'FUNCSTAT', 'geometry']
)
gdf.crs = 4326
# Calculate zonal stats
return common.geom_stats(gdf, arr)
```
Try running the UDF in the Map Builder and visually inspect the output on the map. See what happens when you change `year`. Try introducing print statements such as `print(arr)` and `print(gdf)` to show logs in the console.
[Image: Zonal Stats Map]
You might receive a timeout error in the `Results` tab. Try zooming into Utah on the map where the zonal areas are highlighted, to reduce the size of the tile being passed into the UDF from the map.
```json showLineNumbers
,
"rasterLayer": ,
"vectorLayer": ,
"getLineColor": [
208,
208,
208,
40
]
}
}
```
\
Click "Copy shareable link" to share the app with others!
## 6. Conclusion and next steps
We've shown how you can use Fused to develop a distributed Python workflow to power an app. Through a simple sequence of steps we loaded data, wrote analytics code, and created an app to interact with the data. With a single click you went from experimental development code to a live application.
We hope this overview gives you a glimpse of what you can build with Fused. You can continue to learn how to read data, process data, and integrate with other applications.
Find inspiration for your next project, ask questions, or share your work with the Fused community.
- GitHub
- Discord
- LinkedIn
- Twitter
================================================================================
# PYTHON SDK
## fused.api
Path: python-sdk/api-reference/api.mdx
URL: https://docs.fused.io/python-sdk/api-reference/api
## Module Functions
The following functions can be called directly from the `fused.api` module:
```python
fused.api.function_name()
```
---
## access_token
```python
access_token() -> str
```
Get an access token for the Fused service.
---
## airtable_connect
```python
airtable_connect(*, base_id: str | None = None) -> FusedAirtableConnection
```
Create an Airtable connection using Fused-managed OAuth.
**Parameters:**
- **base_id** (`str | None`) – Default Airtable base ID (e.g. `"appXXXXXXXXXXXXXX"`).
When provided, methods that accept a `base_id` parameter will
fall back to this value.
**Returns:**
- **A** (`FusedAirtableConnection`) – class:`FusedAirtableConnection` instance.
---
## airtable_list_records
```python
airtable_list_records(table: str, *, base_id: str, **params: Any) -> list[dict]
```
List records from an Airtable table.
This is a convenience wrapper around
:meth:`FusedAirtableConnection.list_records`.
**Parameters:**
- **table** (`str`) – Table name or ID.
- **base_id** (`str`) – Airtable base ID.
- \*\***params** (`Any`) – Extra query parameters forwarded to the Airtable
List Records endpoint (e.g. `maxRecords`, `view`,
`filterByFormula`).
**Returns:**
- `list\[dict\]` – A list of record dicts.
---
## anthropic_connect
```python
anthropic_connect() -> anthropic.Anthropic
```
Return an authenticated Anthropic client for Claude model inference.
The API key is read from `fused.secrets["ANTHROPIC_API_KEY"]`.
---
## auth_scheme
```python
auth_scheme() -> str
```
---
## daytona_connect
```python
daytona_connect() -> Daytona
```
Return an authenticated Daytona client for cloud development environments.
The API key is read from `fused.secrets["DAYTONA_API_KEY"]`.
---
## delete
```python
delete(path: str, max_deletion_depth: int | Literal['unlimited'] = 3) -> bool
```
Delete the files at the path.
**Parameters:**
- **path** (`str`) – Directory or file to delete, like `s3://fused-users/team_name/user_name/my-old-table/`
- **max_deletion_depth** (`int | Literal['unlimited']`) – If set (defaults to 3), the maximum depth the operation will recurse to.
This option is to help avoid accidentally deleting more data that intended.
Pass `"unlimited"` for unlimited.
**Examples:**
```python
fused.api.delete("s3://fused-users/team_name/user_name/deprecated_table/")
```
---
## download
```python
download(path: str, local_path: str | Path) -> None
```
Download the contents at the path to disk.
**Parameters:**
- **path** (`str`) – URL to a file, like `s3://fused-users/team_name/user_name/file.parquet`
- **local_path** (`str | Path`) – Path to a local file.
---
## dropbox_connect
```python
dropbox_connect() -> FusedDropboxConnection
```
Create a Dropbox connection using Fused-managed OAuth.
**Returns:**
- **A** (`FusedDropboxConnection`) – class:`FusedDropboxConnection`. Call `.client()` for the official
- `FusedDropboxConnection` – `dropbox.Dropbox` SDK client (requires `pip install dropbox`).
---
## enable_gcs
```python
enable_gcs()
```
Save gcs credentials from AWS secret manager into a temporary local file and set its path to the env variable.
---
## get
```python
get(path: str) -> bytes
```
Download the contents at the path to memory.
**Parameters:**
- **path** (`str`) – URL to a file, like `s3://fused-users/team_name/user_name/file.parquet`
**Returns:**
- `bytes` – bytes of the file
**Examples:**
```python
fused.api.get("s3://fused-users/team_name/user_name/file.parquet")
```
---
## get_apps
```python
get_apps(
n: int | None = None,
*,
skip: int = 0,
by: Literal["name", "id", "slug"] = "name",
whose: Literal["self", "public"] = "self"
) -> dict
```
Fetches a list of apps.
**Parameters:**
- **n** (`int | None`) – The total number of UDFs to fetch. Defaults to All.
- **skip** (`int`) – The number of UDFs to skip before starting to collect the result set. Defaults to 0.
- **by** (`Literal['name', 'id', 'slug']`) – The attribute by which to sort the apps. Can be "name", "id", or "slug". Defaults to "name".
- **whose** (`Literal['self', 'public']`) – Specifies whose apps to fetch. Can be "self" for the user's own apps or "public" for
UDFs available publicly. Defaults to "self".
**Returns:**
- `dict` – A list of apps.
**Examples:**
Fetch apps under the user account:
```py
fused.api.get_apps()
```
---
## get_udfs
```python
get_udfs(
n: int | None = None,
*,
skip: int = 0,
by: Literal["name", "id", "slug"] = "name",
whose: Literal["self", "public", "community", "team"] = "self",
collection_name: str | None = None
) -> dict
```
Fetches a list of UDFs.
**Parameters:**
- **n** (`int | None`) – The total number of UDFs to fetch. Defaults to All.
- **skip** (`int`) – The number of UDFs to skip before starting to collect the result set. Defaults to 0.
- **by** (`Literal['name', 'id', 'slug']`) – The attribute by which to sort the UDFs. Can be "name", "id", or "slug". Defaults to "name".
- **whose** (`Literal['self', 'public', 'community', 'team']`) – Specifies whose UDFs to fetch. Can be "self" for the user's own UDFs or "public" for
UDFs available publicly or "community" for all community UDFs. Defaults to "self".
- **collection_name** (`str | None`) – Filter UDFs by collection name. If not provided, defaults to "default".
**Returns:**
- `dict` – A list of UDFs.
**Examples:**
Fetch UDFs under the user account:
```py
fused.api.get_udfs()
```
---
## hubspot_connect
```python
hubspot_connect()
```
Create a HubSpot client using Fused-managed OAuth.
Returns an official `hubspot.HubSpot` client instance initialized
with a short-lived access token. See the hubspot-api-client docs for
the full API surface.
---
## huggingface_connect
```python
huggingface_connect() -> HfApi
```
Return an authenticated HfApi client for repos, models, and datasets.
The token is read from `fused.secrets["HUGGINGFACE_API_KEY"]`.
---
## huggingface_inference
```python
huggingface_inference() -> InferenceClient
```
Return an authenticated InferenceClient for model inference.
The token is read from `fused.secrets["HUGGINGFACE_API_KEY"]`.
---
## job_cancel
```python
job_cancel(job: CoerceableToJobId) -> RunResponse
```
Cancel an existing job
**Parameters:**
- **job** (`CoerceableToJobId`) – the identifier of a job or a `RunResponse` object.
**Returns:**
- `RunResponse` – A new job object.
---
## job_get_exec_time
```python
job_get_exec_time(job: CoerceableToJobId) -> timedelta
```
Determine the execution time of this job, using the logs.
**Returns:**
- `timedelta` – Time the job took. If the job is in progress, time from first to last log message is returned.
---
## job_get_logs
```python
job_get_logs(job: CoerceableToJobId, since_ms: int | None = None) -> list[Any]
```
Fetch logs for a job
**Parameters:**
- **job** (`CoerceableToJobId`) – the identifier of a job or a `RunResponse` object.
- **since_ms** (`int | None`) – Timestamp, in milliseconds since epoch, to get logs for. Defaults to None for all logs.
**Returns:**
- `list\[Any\]` – Log messages for the given job.
---
## job_get_results
```python
job_get_results(job: CoerceableToJobId) -> list[Any]
```
---
## job_get_status
```python
job_get_status(job: CoerceableToJobId) -> RunResponse
```
Fetch the status of a running job
**Parameters:**
- **job** (`CoerceableToJobId`) – the identifier of a job or a `RunResponse` object.
**Returns:**
- `RunResponse` – The status of the given job.
---
## job_print_logs
```python
job_print_logs(
job: CoerceableToJobId, since_ms: int | None = None, file: IO | None = None
) -> None
```
Fetch and print logs for a job
**Parameters:**
- **job** (`CoerceableToJobId`) – the identifier of a job or a `RunResponse` object.
- **since_ms** (`int | None`) – Timestamp, in milliseconds since epoch, to get logs for. Defaults to None for all logs.
- **file** (`IO | None`) – Where to print logs to. Defaults to sys.stdout.
**Returns:**
- `None` – None
---
## job_tail_logs
```python
job_tail_logs(
job: CoerceableToJobId,
refresh_seconds: float = 1,
sample_logs: bool = True,
timeout: float | None = None,
)
```
Continuously print logs for a job
**Parameters:**
- **job** (`CoerceableToJobId`) – the identifier of a job or a `RunResponse` object.
- **refresh_seconds** (`float`) – how frequently, in seconds, to check for new logs. Defaults to 1.
- **sample_logs** (`bool`) – if true, print out only a sample of logs. Defaults to True.
- **timeout** (`float | None`) – if not None, how long to continue tailing logs for. Defaults to None for indefinite.
---
## job_wait_for_job
```python
job_wait_for_job(
job: CoerceableToJobId,
poll_interval_seconds: float = 5,
timeout: float | None = None,
) -> RunResponse
```
Block the Python kernel until this job has finished
**Parameters:**
- **poll_interval_seconds** (`float`) – How often (in seconds) to poll for status updates. Defaults to 5.
- **timeout** (`float | None`) – The length of time in seconds to wait for the job. Defaults to None.
**Raises:**
- `TimeoutError` – if waiting for the job timed out.
**Returns:**
- `RunResponse` – The status of the given job.
---
## job_wait_for_results
```python
job_wait_for_results(
job: CoerceableToJobId,
poll_interval_seconds: float = 5,
timeout: float | None = None,
) -> list[UdfEvaluationResult]
```
---
## list
```python
list(path: str, *, details: bool = False) -> list[str] | list[ListDetails]
```
List the files at the path.
**Parameters:**
- **path** (`str`) – Parent directory URL, like `s3://fused-users/team_name/user_name/`
- **details** (`bool`) – If True, return additional metadata about each record.
**Returns:**
- `list\[str\] | list\[ListDetails\]` – A list of paths as URLs, or as metadata objects.
**Examples:**
```python
fused.api.list("s3://fused-users/team_name/user_name/")
```
---
## log
```python
log(
id: str | None = None,
*,
udf_id: str | None = None,
udf_name: str | None = None,
shared_token: str | None = None,
exec_env: bool = False,
distinct: bool = False,
distinct_type: Literal["names", "ids"] | None = None,
start_timestamp: str | None = None,
end_timestamp: str | None = None,
limit: int = 100,
scan_forward: bool = True,
page_token: str | None = None,
max_records_to_scan: int = 1000
) -> dict[str, Any]
```
Get audit logs with flexible filtering options.
Routes to the appropriate audit log method based on the provided arguments.
**Parameters:**
- **id** (`str | None`) – Get audit log by record ID. If provided, other filters are ignored.
- **udf_id** (`str | None`) – Filter logs by UDF ID.
- **udf_name** (`str | None`) – Filter logs by UDF name.
- **shared_token** (`str | None`) – Filter logs by shared token.
- **exec_env** (`bool`) – If True, filter by execution environment. Defaults to False.
- **distinct** (`bool`) – If True, return distinct values instead of full logs. Defaults to False.
- **distinct_type** (`Literal['names', 'ids'] | None`) – When distinct=True, specify "names" or "ids" to get distinct UDF names or IDs.
- **start_timestamp** (`str | None`) – Start timestamp (ISO format, inclusive). Defaults to None.
- **end_timestamp** (`str | None`) – End timestamp (ISO format, inclusive). Defaults to None.
- **limit** (`int`) – Maximum number of items to return (max 300). Used for regular log queries. Defaults to 100.
- **scan_forward** (`bool`) – If True, scan forward in time; if False, scan backward. Defaults to True.
- **page_token** (`str | None`) – Pagination token from previous response. Defaults to None.
- **max_records_to_scan** (`int`) – Maximum number of records to scan (max 5000). Used for distinct queries. Defaults to 1000.
**Returns:**
- `dict\[str, Any\]` – Dictionary containing items, limit, and next_page_token.
**Examples:**
```py
# Get all logs for the authenticated user
logs = fused.api.log()
# Get logs filtered by execution environment
logs = fused.api.log(exec_env=True)
# Get logs by UDF ID
logs = fused.api.log(udf_id="udf-id")
# Get logs by UDF name
logs = fused.api.log(udf_name="my_udf")
# Get logs by shared token
logs = fused.api.log(shared_token="shared-token")
# Get a specific log by ID
log_entry = fused.api.log(id="audit-log-id")
# Get distinct UDF names
distinct_names = fused.api.log(distinct=True, distinct_type="names")
# Get distinct UDF IDs filtered by execution environment
distinct_ids = fused.api.log(distinct=True, distinct_type="ids", exec_env=True)
```
---
## logout
```python
logout()
```
Log out the current user.
This deletes the credentials saved to disk and resets the global Fused API.
---
## modal_connect
```python
modal_connect() -> modal.Client
```
---
## notion_connect
```python
notion_connect() -> FusedNotionConnection
```
Create a Notion connection using Fused-managed OAuth.
**Returns:**
- **A** (`FusedNotionConnection`) – class:`FusedNotionConnection` instance.
---
## onedrive_connect
```python
onedrive_connect() -> FusedOnedriveConnection
```
Create a OneDrive connection using Fused-managed OAuth (Microsoft Graph).
**Returns:**
- **A** (`FusedOnedriveConnection`) – class:`FusedOnedriveConnection`. Call `.token()` for a short-lived Microsoft
- `FusedOnedriveConnection` – Graph access token, or use `.list()` / `.get()` / `.download()` helpers.
---
## openai_connect
```python
openai_connect() -> openai.OpenAI
```
Return an authenticated OpenAI client for GPT model inference.
The API key is read from `fused.secrets["OPENAI_API_KEY"]`.
---
## resolve
```python
resolve(path: str) -> str
```
Resolve a path from fd:// to the full S3 URI.
**Parameters:**
- **path** (`str`) – The path to resolve.
**Returns:**
- `str` – S3 resolved path
---
## schedule_list
```python
schedule_list()
```
List all cron jobs
---
## schedule_udf
```python
schedule_udf(
udf: BaseUdf | str,
minute: list[int] | int,
hour: list[int] | int,
day_of_month: list[int] | int | None = None,
month: list[int] | int | None = None,
day_of_week: list[int] | int | None = None,
udf_args: dict[str, Any] | None = None,
enabled: bool = True,
_create_udf: bool = True,
**kwargs: bool
) -> CronJob
```
Schedule a UDF to run on a cron schedule.
**Parameters:**
- **udf** (`BaseUdf | str`) – The UDF to schedule.
- **minute** (`list[int] | int`) – The minute to run the UDF on.
- **hour** (`list[int] | int`) – The hour to run the UDF on.
- **day_of_month** (`list[int] | int | None`) – The day of the month to run the UDF on. (Default every day)
- **month** (`list[int] | int | None`) – The month to run the UDF on. (Default every month)
- **day_of_week** (`list[int] | int | None`) – The day of the week to run the UDF on. (Default every day)
- **udf_args** (`dict[str, Any] | None`) – The arguments to pass to the UDF. (Default None)
- **enabled** (`bool`) – Whether the cron job is enabled. (Default True)
- **\_create_udf** (`bool`) – Save the UDF to Fused before creating the CronJob. (Default True)
---
## session_token
```python
session_token(session_max_age: str | int = '1h') -> SessionToken
```
Create a session token for the current workbench canvas.
Automatically resolves the canvas share token from the currently
running UDF context. Must be called from within the Fused workbench.
**Parameters:**
- **session_max_age** (`str | int`) – Lifetime of the session token. Accepts an integer
(seconds) or a duration string such as `"30m"`, `"1h"`,
`"1d"`. Defaults to `"1h"`.
**Returns:**
- **A** (`SessionToken`) – class:`SessionToken` with `session_token` and `expires_at` fields.
---
## sign_url
```python
sign_url(path: str) -> str
```
Create a signed URL to access the path.
This function may not check that the file represented by the path exists.
**Parameters:**
- **path** (`str`) – URL to a file, like `s3://fused-users/team_name/user_name/file.parquet`
**Returns:**
- `str` – HTTPS URL to access the file using signed access.
**Examples:**
```python
fused.api.sign_url("s3://fused-users/team_name/user_name/table_directory/file.parquet")
```
---
## sign_url_prefix
```python
sign_url_prefix(path: str) -> dict[str, str]
```
Create signed URLs to access all blobs under the path.
**Parameters:**
- **path** (`str`) – URL to a prefix, like `s3://fused-users/team_name/user_name/some_directory/`
**Returns:**
- `dict\[str, str\]` – Dictionary mapping from blob store key to signed HTTPS URL.
**Examples:**
```python
fused.api.sign_url_prefix("s3://fused-users/team_name/user_name/table_directory/")
```
---
## snowflake_connect
```python
snowflake_connect(
*,
role: str | None = None,
warehouse: str | None = None,
database: str | None = None,
schema: str | None = None
) -> FusedSnowflakeConnection
```
Create a Snowflake connection using Fused-managed OAuth.
**Parameters:**
- **role** (`str | None`) – Snowflake role to USE after connecting.
- **warehouse** (`str | None`) – Snowflake warehouse to USE after connecting.
- **database** (`str | None`) – Default database context.
- **schema** (`str | None`) – Default schema context.
**Returns:**
- **A** (`FusedSnowflakeConnection`) – class:`FusedSnowflakeConnection` instance.
---
## snowflake_query
```python
snowflake_query(
sql: str,
*,
role: str | None = None,
warehouse: str | None = None,
database: str | None = None,
schema: str | None = None
) -> pd.DataFrame
```
Execute a SQL query against Snowflake and return a DataFrame.
This is a convenience wrapper around
:meth:`FusedSnowflakeConnection.query`.
**Parameters:**
- **sql** (`str`) – The SQL statement to execute.
- **role** (`str | None`) – Snowflake role to USE after connecting.
- **warehouse** (`str | None`) – Snowflake warehouse to USE after connecting.
- **database** (`str | None`) – Default database context.
- **schema** (`str | None`) – Default schema context.
**Returns:**
- **A** (`DataFrame`) – class:`~pandas.DataFrame` with the query results.
---
## team_info
```python
team_info() -> dict
```
Fetch the team execution environment details.
**Returns:**
- `dict` – A dictionary with information about the execution environment.
---
## upload
```python
upload(
local_path: str | Path | bytes | BinaryIO | pd.DataFrame | gpd.GeoDataFrame,
remote_path: str,
timeout: float | None = None,
) -> None
```
Upload local file to S3.
**Parameters:**
- **local_path** (`str | Path | bytes | BinaryIO | pd.DataFrame | gpd.GeoDataFrame`) – Either a path to a local file (`str`, `Path`), a (Geo)DataFrame
(which will get uploaded as Parquet file), or the contents to upload.
Any string will be treated as a Path, if you wish to upload the contents of
the string, first encode it: `s.encode("utf-8")`
- **remote_path** (`str`) – URL to upload to, like `s3://fused-users/team_name/user_name/new-file.txt`
- **timeout** (`float | None`) – Optional timeout in seconds for the upload (will default to `OPTIONS.request_timeout` if not specified).
**Examples:**
To upload a local json file to your Fused-managed S3 bucket:
```py
fused.api.upload("my_file.json", "s3://fused-users/team_name/user_name/my_file.json")
```
---
## whoami
```python
whoami()
```
Returns information on the currently logged in user
---
## FusedAPI Class Methods
The following methods require creating a `FusedAPI` instance first:
```python
from fused.api import FusedAPI
api = FusedAPI()
api.method_name()
```
## fused.api.FusedAPI
```python
FusedAPI(
*,
base_url: str | None = None,
shared_udf_base_url: str | None = None,
set_global_api: bool = True,
credentials_needed: bool = True
)
```
API for running jobs in the Fused service.
Create a FusedAPI instance.
**Other Parameters:**
- **base_url** (`str | None`) – The Fused instance to send requests to. Defaults to `https://www.fused.io/server/v1`.
- **shared_udf_base_url** (`str | None`) – The shared UDF instance to send requests to. Defaults to `https://www.udf.ai`.
- **set_global_api** (`bool`) – Set this as the global API object. Defaults to True.
- **credentials_needed** (`bool`) – If True, automatically attempt to log in. Defaults to True.
---
### create_udf_access_token
```python
create_udf_access_token(
udf_email_or_name_or_id: str | None = None,
/,
udf_name: str | None = None,
*,
udf_email: str | None = None,
udf_id: str | None = None,
client_id: str | Ellipsis | None = ...,
public_read: bool | None = None,
access_scope: str | None = None,
cache: bool = True,
metadata_json: dict[str, Any] | None = None,
enabled: bool = True,
) -> UdfAccessToken
```
Create a token for running a UDF. The token allows anyone who has it to run
the UDF, with the parameters they choose. The UDF will run under your environment.
The token does not allow running any other UDF on your account.
**Parameters:**
- **udf_email_or_name_or_id** (`str | None`) – A UDF ID, email address (for use with udf_name), or UDF name.
- **udf_name** (`str | None`) – The name of the UDF to create the token for.
**Other Parameters:**
- **udf_email** (`str | None`) – The email of the user owning the UDF, or, if udf_name is None, the name of the UDF.
- **udf_id** (`str | None`) – The backend ID of the UDF to create the token for.
- **client_id** (`str | Ellipsis | None`) – If specified, overrides which realtime environment to run the UDF under.
- **cache** (`bool`) – If True, UDF tiles will be cached.
- **metadata_json** (`dict\[str, Any\] | None`) – Additional metadata to serve as part of the tiles metadata.json.
- **enabled** (`bool`) – If True, the token can be used.
**Usage:** `from fused.api import FusedAPI; api = FusedAPI(); api.create_udf_access_token()`
---
### upload
```python
upload(
path: str,
data: bytes | BinaryIO,
client_id: str | None = None,
timeout: float | None = None,
) -> None
```
Upload a binary blob to a cloud location
**Usage:** `from fused.api import FusedAPI; api = FusedAPI(); api.upload()`
---
### start_job
```python
start_job(
config: JobConfig | JobStepConfig,
*,
instance_type: WHITELISTED_INSTANCE_TYPES | None = None,
region: str | None = None,
disk_size_gb: int | None = None,
additional_env: Sequence[str] | None = ("FUSED_CREDENTIAL_PROVIDER=ec2",),
image_name: str | None = None,
send_status_email: bool | None = None,
cache_max_age: int | None = None
) -> RunResponse
```
Execute an operation
**Parameters:**
- **config** (`JobConfig | JobStepConfig`) – the configuration object to run in the job.
**Other Parameters:**
- **instance_type** (`WHITELISTED_INSTANCE_TYPES | None`) – The AWS EC2 instance type to use for the job. Acceptable strings are "m5.large", "m5.xlarge", "m5.2xlarge", "m5.4xlarge", "r5.large", "r5.xlarge", "r5.2xlarge", "r5.4xlarge". Defaults to None.
- **region** (`str | None`) – The AWS region in which to run. Defaults to None.
- **disk_size_gb** (`int | None`) – The disk size to specify for the job. Defaults to None.
- **additional_env** (`Sequence\[str\] | None`) – Any additional environment variables to be passed into the job, each in the form KEY=value. Defaults to None.
- **image_name** (`str | None`) – Custom image name to run. Defaults to None for default image.
- **send_status_email** (`bool | None`) – Whether to send a status email to the user when the job is complete.
**Usage:** `from fused.api import FusedAPI; api = FusedAPI(); api.start_job()`
---
### get_jobs
```python
get_jobs(
n: int = 5,
*,
skip: int = 0,
per_request: int = 25,
max_requests: int | None = 1
) -> Jobs
```
Get the job history.
**Parameters:**
- **n** (`int`) – The number of jobs to fetch. Defaults to 5.
**Other Parameters:**
- **skip** (`int`) – Where in the job history to begin. Defaults to 0, which retrieves the most recent job.
- **per_request** (`int`) – Number of jobs per request to fetch. Defaults to 25.
- **max_requests** (`int | None`) – Maximum number of requests to make. May be None to fetch all jobs. Defaults to 1.
**Returns:**
- `Jobs` – The job history.
**Usage:** `from fused.api import FusedAPI; api = FusedAPI(); api.get_jobs()`
---
### get_status
```python
get_status(job: CoerceableToJobId) -> RunResponse
```
Fetch the status of a running job
**Parameters:**
- **job** (`CoerceableToJobId`) – the identifier of a job or a `RunResponse` object.
**Returns:**
- `RunResponse` – The status of the given job.
**Usage:** `from fused.api import FusedAPI; api = FusedAPI(); api.get_status()`
---
### get_logs
```python
get_logs(job: CoerceableToJobId, since_ms: int | None = None) -> list[Any]
```
Fetch logs for a job
**Parameters:**
- **job** (`CoerceableToJobId`) – the identifier of a job or a `RunResponse` object.
- **since_ms** (`int | None`) – Timestamp, in milliseconds since epoch, to get logs for. Defaults to None for all logs.
**Returns:**
- `list\[Any\]` – Log messages for the given job.
**Usage:** `from fused.api import FusedAPI; api = FusedAPI(); api.get_logs()`
---
### tail_logs
```python
tail_logs(
job: CoerceableToJobId,
refresh_seconds: float = 1,
sample_logs: bool = False,
timeout: float | None = None,
)
```
Continuously print logs for a job
**Parameters:**
- **job** (`CoerceableToJobId`) – the identifier of a job or a `RunResponse` object.
- **refresh_seconds** (`float`) – how frequently, in seconds, to check for new logs. Defaults to 1.
- **sample_logs** (`bool`) – if true, print out only a sample of logs. Defaults to False.
- **timeout** (`float | None`) – if not None, how long to continue tailing logs for. Defaults to None for indefinite.
**Usage:** `from fused.api import FusedAPI; api = FusedAPI(); api.tail_logs()`
---
### wait_for_job
```python
wait_for_job(
job: CoerceableToJobId,
poll_interval_seconds: float = 5,
timeout: float | None = None,
) -> RunResponse
```
Block the Python kernel until the given job has finished
**Parameters:**
- **job** (`CoerceableToJobId`) – the identifier of a job or a `RunResponse` object.
- **poll_interval_seconds** (`float`) – How often (in seconds) to poll for status updates. Defaults to 5.
- **timeout** (`float | None`) – The length of time in seconds to wait for the job. Defaults to None.
**Raises:**
- `TimeoutError` – if waiting for the job timed out.
**Returns:**
- `RunResponse` – The status of the given job.
**Usage:** `from fused.api import FusedAPI; api = FusedAPI(); api.wait_for_job()`
---
### cancel_job
```python
cancel_job(job: CoerceableToJobId) -> RunResponse
```
Cancel an existing job
**Parameters:**
- **job** (`CoerceableToJobId`) – the identifier of a job or a `RunResponse` object.
**Returns:**
- `RunResponse` – A new job object.
**Usage:** `from fused.api import FusedAPI; api = FusedAPI(); api.cancel_job()`
---
### auth_token
```python
auth_token() -> str
```
Returns the current user's Fused environment (team) auth token
**Usage:** `from fused.api import FusedAPI; api = FusedAPI(); api.auth_token()`
---
## Airtable
## FusedAirtableConnection
## fused.api.FusedAirtableConnection
```python
FusedAirtableConnection(base_id: str | None = None)
```
Airtable integration using Fused-managed OAuth tokens.
The connection lazily fetches a short-lived OAuth access token from the
Fused server and uses the Airtable REST API directly.
**Parameters:**
- **base_id** (`str | None`) – Default Airtable base ID (e.g. `"appXXXXXXXXXXXXXX"`).
When provided, methods that accept a `base_id` parameter will
fall back to this value.
---
### create_records
```python
create_records(
table: str, records: list[dict[str, Any]], *, base_id: str | None = None
) -> list[dict[str, Any]]
```
Create one or more records.
**Parameters:**
- **table** (`str`) – Table name or ID.
- **records** (`list\[dict[str, Any]\]`) – List of `}` dicts.
- **base_id** (`str | None`) – Airtable base ID. Falls back to the default.
---
### delete_records
```python
delete_records(
table: str, record_ids: list[str], *, base_id: str | None = None
) -> list[dict[str, Any]]
```
Delete one or more records by ID.
**Parameters:**
- **table** (`str`) – Table name or ID.
- **record_ids** (`list[str]`) – List of record IDs to delete.
- **base_id** (`str | None`) – Airtable base ID. Falls back to the default.
---
### get_record
```python
get_record(
table: str, record_id: str, *, base_id: str | None = None
) -> dict[str, Any]
```
Fetch a single record by ID.
**Parameters:**
- **table** (`str`) – Table name or ID.
- **record_id** (`str`) – Airtable record ID (e.g. `"recXXXXXXXXXXXXXX"`).
- **base_id** (`str | None`) – Airtable base ID. Falls back to the default.
---
### list_bases
```python
list_bases() -> list[dict[str, Any]]
```
Return the list of bases the token has access to.
---
### list_records
```python
list_records(
table: str, *, base_id: str | None = None, **params: Any
) -> list[dict[str, Any]]
```
List records from a table (auto-paginates).
**Parameters:**
- **table** (`str`) – Table name or ID.
- **base_id** (`str | None`) – Airtable base ID. Falls back to the default.
- \*\***params** (`Any`) – Extra query parameters forwarded to the Airtable
List Records endpoint (e.g. `maxRecords`, `view`,
`filterByFormula`).
---
### list_tables
```python
list_tables(base_id: str | None = None) -> list[dict[str, Any]]
```
Return the tables in a base.
**Parameters:**
- **base_id** (`str | None`) – Airtable base ID. Falls back to the default.
---
### update_records
```python
update_records(
table: str, records: list[dict[str, Any]], *, base_id: str | None = None
) -> list[dict[str, Any]]
```
Update one or more records (PATCH -- partial update).
**Parameters:**
- **table** (`str`) – Table name or ID.
- **records** (`list\[dict[str, Any]\]`) – List of `}` dicts.
- **base_id** (`str | None`) – Airtable base ID. Falls back to the default.
---
## Dropbox
## FusedDropboxConnection
## fused.api.FusedDropboxConnection
Dropbox integration using Fused-managed OAuth tokens (PKCE refresh).
---
### client
```python
client() -> dropbox.Dropbox
```
Return an official `dropbox.Dropbox` client using Fused-managed OAuth.
The client is constructed with the refresh token and app key, so the SDK
refreshes access tokens itself (PKCE; no app secret required).
Requires the `dropbox` package::
```
pip install dropbox
```
---
## Notion
## FusedNotionConnection
## fused.api.FusedNotionConnection
Notion integration using Fused-managed OAuth tokens.
The connection lazily fetches a short-lived OAuth access token from the
Fused server and uses the Notion REST API directly.
---
### client
```python
client() -> NotionClient
```
Return a configured `notion_client.Client` using the Fused-managed OAuth token.
Requires the `notion-client` package::
```
pip install notion-client
```
---
### create_comment
```python
create_comment(
rich_text: list[dict[str, Any]],
*,
parent_id: str | None = None,
discussion_id: str | None = None
) -> dict[str, Any]
```
Create a comment on a page or as a reply in a discussion.
Provide exactly one of `parent_id` (top-level comment on a page)
or `discussion_id` (reply to an existing discussion thread).
**Parameters:**
- **rich_text** (`list\[dict[str, Any]\]`) – List of rich text objects for the comment body.
- **parent_id** (`str | None`) – Page ID for a new top-level comment.
- **discussion_id** (`str | None`) – Discussion ID to reply to.
---
### create_page
```python
create_page(
parent: dict[str, Any],
properties: dict[str, Any],
*,
children: list[dict[str, Any]] | None = None
) -> dict[str, Any]
```
Create a new page.
**Parameters:**
- **parent** (`dict[str, Any]`) – Parent object, e.g. `` or
``.
- **properties** (`dict[str, Any]`) – Page properties matching the parent schema.
- **children** (`list\[dict[str, Any]\] | None`) – Optional list of block objects for the page body.
---
### delete_page
```python
delete_page(page_id: str) -> dict[str, Any]
```
Move a page to the trash.
Notion does not support permanent deletion via the API.
**Parameters:**
- **page_id** (`str`) – Notion page ID.
---
### get_page
```python
get_page(page_id: str) -> dict[str, Any]
```
Retrieve a page by ID.
**Parameters:**
- **page_id** (`str`) – Notion page ID.
---
### get_user
```python
get_user(user_id: str) -> dict[str, Any]
```
Retrieve a user by ID.
**Parameters:**
- **user_id** (`str`) – Notion user ID.
---
### list_comments
```python
list_comments(block_id: str, *, page_size: int = 100) -> list[dict[str, Any]]
```
List comments on a block or page (auto-paginates).
**Parameters:**
- **block_id** (`str`) – The block or page ID to list comments for.
- **page_size** (`int`) – Number of results per request (max 100).
---
### list_users
```python
list_users(*, _page_size: int = 100) -> list[dict[str, Any]]
```
List all users in the workspace (auto-paginates).
**Parameters:**
- **page_size** – Number of results per request (max 100).
---
### search
```python
search(
query: str | None = None,
*,
filter: dict[str, Any] | None = None,
sort: dict[str, Any] | None = None,
_page_size: int = 100
) -> list[dict[str, Any]]
```
Search pages and databases by title (auto-paginates).
**Parameters:**
- **query** (`str | None`) – Text to search for in page/database titles.
- **filter** (`dict[str, Any] | None`) – Optional filter object, e.g.
``.
- **sort** (`dict[str, Any] | None`) – Optional sort object, e.g.
``.
- **\_page_size** (`int`) – Number of results per request (max 100).
---
### update_page
```python
update_page(
page_id: str,
*,
properties: dict[str, Any] | None = None,
in_trash: bool | None = None
) -> dict[str, Any]
```
Update a page's properties or trash/restore it.
**Parameters:**
- **page_id** (`str`) – Notion page ID.
- **properties** (`dict[str, Any] | None`) – Property values to update.
- **in_trash** (`bool | None`) – Set `True` to move to trash, `False` to restore.
---
## Onedrive
## FusedOnedriveConnection
## fused.api.FusedOnedriveConnection
OneDrive connection using Fused-managed OAuth tokens (Microsoft Graph).
---
### download
```python
download(path: str) -> bytes
```
Download a file's bytes by its OneDrive path.
---
### get
```python
get(path: str, **kwargs: Any) -> dict[str, Any]
```
GET a Graph resource and return the parsed JSON.
---
### list
```python
list(folder: str = '') -> list[dict[str, Any]]
```
List the children of a OneDrive folder (drive root by default).
Follows `@odata.nextLink` so folders with more than one Graph page are
returned in full.
---
### request
```python
request(method: str, path: str, **kwargs: Any)
```
Make a Microsoft Graph request.
`path` may be an absolute URL or a path relative to the Graph v1.0 base
(e.g. `"me/drive/root/children"`).
---
### token
```python
token() -> str
```
Return a short-lived Microsoft Graph access token for the current user.
---
## Snowflake
## FusedSnowflakeConnection
## fused.api.FusedSnowflakeConnection
```python
FusedSnowflakeConnection(
role: str | None = None,
warehouse: str | None = None,
database: str | None = None,
schema: str | None = None,
)
```
Snowflake integration using Fused-managed OAuth tokens.
The connection lazily fetches a short-lived OAuth access token from the Fused
server and uses `snowflake-connector-python` with `authenticator='oauth'`
to talk directly to Snowflake.
**Parameters:**
- **role** (`str | None`) – Snowflake role to USE after connecting.
- **warehouse** (`str | None`) – Snowflake warehouse to USE after connecting.
- **database** (`str | None`) – Default database context.
- **schema** (`str | None`) – Default schema context.
---
### connect
```python
connect(**kwargs: Any) -> snowflake.connector.SnowflakeConnection
```
Create a Snowflake connection using OAuth token.
---
### execute
```python
execute(sql: str, *args: str, **kwargs: str)
```
Execute SQL without returning results (DDL, DML).
---
### list_databases
```python
list_databases() -> list[str]
```
Return a list of database names (`SHOW DATABASES`).
---
### list_schemas
```python
list_schemas(database: str | None = None) -> list[str]
```
Return schema names. Optionally scoped to *database*.
Note: database is not escaped.
---
### list_stage_files
```python
list_stage_files(stage: str, pattern: str | None = None) -> list[str]
```
List files in a stage (`LIST @stage`).
**Parameters:**
- **stage** (`str`) – Stage reference, e.g. `"@my_stage"` or `"@db.schema.stage"`.
- **pattern** (`str | None`) – Optional SQL LIKE pattern to filter files.
Note: stage and pattern are not escaped.
---
### list_stages
```python
list_stages(
database: str | None = None, schema: str | None = None
) -> list[str]
```
Return stage names. Optionally scoped to *database*/*schema*.
Note: database and schema are not escaped.
---
### list_tables
```python
list_tables(
database: str | None = None, schema: str | None = None
) -> list[str]
```
Return table names. Optionally scoped to *database*/*schema*.
Note: database and schema are not escaped.
---
### query
```python
query(sql: str, *args: str, **kwargs: str) -> pd.DataFrame
```
Execute SQL and return results as a DataFrame.
---
### read_stage
```python
read_stage(stage_path: str) -> pd.DataFrame
```
Read a file from a stage into a DataFrame.
Uses `SELECT $1, $2, ... FROM @stage/path` which works for
CSV / semi-structured data that Snowflake can auto-detect.
**Parameters:**
- **stage_path** (`str`) – Full stage path, e.g. `"@my_stage/data.csv"`.
Note: stage_path is not escaped.
---
### write
```python
write(df: pd.DataFrame, table: str, mode: str = 'append', **kwargs: Any)
```
Write a DataFrame to a Snowflake table using `write_pandas`.
**Parameters:**
- **df** (`pd.DataFrame`) – DataFrame to write.
- **table** (`str`) – Fully-qualified or simple table name.
- **mode** (`str`) – `"append"` (default) or `"overwrite"`.
- \*\***kwargs** (`Any`) – Extra keyword arguments forwarded to
`snowflake.connector.pandas_tools.write_pandas`.
---
================================================================================
## fused.core
Path: python-sdk/api-reference/core.mdx
URL: https://docs.fused.io/python-sdk/api-reference/core
## `run_tile`
```python showLineNumbers
def run_tile(email: str,
id: Optional[str] = None,
*,
x: int,
y: int,
z: int,
_dtype_out_vector: str = DEFAULT_DTYPE_VECTOR,
_dtype_out_raster: str = DEFAULT_DTYPE_RASTER,
_client_id: Optional[str] = None,
**params) -> Optional[Union["pd.DataFrame", "xr.Dataset"]]
```
Executes a private tile-based UDF indexed under the specified email and ID. The calling user must have the necessary permissions to execute the UDF.
This function constructs a URL to run a UDF on a specific tile defined by its x, y, and z coordinates, and
sends a request to the server. It supports customization of the output data types for vector and raster data,
as well as additional parameters for the UDF execution.
**Arguments**:
- `email` _str_ - Email address of user account associated with the UDF.
- `id` _Optional[str]_ - Unique identifier for the UDF. If None, the user's email is used as the ID.
- `x` _int_ - The x coordinate of the tile.
- `y` _int_ - The y coordinate of the tile.
- `z` _int_ - The zoom level of the tile.
- `_dtype_out_vector` _str_ - Desired data type for vector output. Defaults to a pre-defined type.
- `_dtype_out_raster` _str_ - Desired data type for raster output. Defaults to a pre-defined type.
- `_client_id` _Optional[str]_ - Client identifier for API usage. If None, a default or global client ID may be used.
- `**params` - Additional keyword arguments for the UDF execution.
**Returns**:
The response from the server after executing the UDF on the specified tile.
---
## `run_shared_tile`
```python showLineNumbers
def run_shared_tile(token: str,
*,
x: int,
y: int,
z: int,
_dtype_out_vector: str = DEFAULT_DTYPE_VECTOR,
_dtype_out_raster: str = DEFAULT_DTYPE_RASTER,
_client_id: Optional[str] = None,
**params) -> Optional[Union["pd.DataFrame", "xr.Dataset"]]
```
Executes a shared tile-based UDF.
This function constructs a URL to run a UDF on a specific tile defined by its x, y, and z coordinates, and
sends a request to the server. It supports customization of the output data types for vector and raster data,
as well as additional parameters for the UDF execution.
**Arguments**:
- `token` _str_ - A shared access token that authorizes the operation.
- `id` _Optional[str]_ - Unique identifier for the UDF. If None, the user's email is used as the ID.
- `x` _int_ - The x coordinate of the tile.
- `y` _int_ - The y coordinate of the tile.
- `z` _int_ - The zoom level of the tile.
- `_dtype_out_vector` _str_ - Desired data type for vector output. Defaults to a pre-defined type.
- `_dtype_out_raster` _str_ - Desired data type for raster output. Defaults to a pre-defined type.
- `_client_id` _Optional[str]_ - Client identifier for API usage. If None, a default or global client ID may be used.
- `**params` - Additional keyword arguments for the UDF execution.
**Returns**:
The response from the server after executing the UDF on the specified tile.
---
## `run_file`
```python showLineNumbers
def run_file(email: str,
id: Optional[str] = None,
*,
_dtype_out_vector: str = DEFAULT_DTYPE_VECTOR,
_dtype_out_raster: str = DEFAULT_DTYPE_RASTER,
_client_id: Optional[str] = None,
**params) -> Optional[Union["pd.DataFrame", "xr.Dataset"]]
```
Executes a private file-based UDF indexed under the specified email and ID. The calling user must have the necessary permissions to execute the UDF.
This function constructs a URL to run a UDF associated with the given email and ID, allowing for output data type customization for both vector and raster outputs. It also supports additional parameters for the UDF execution.
**Arguments**:
- `email` _str_ - Email address of user account associated with the UDF.
- `id` _Optional[str]_ - Unique identifier for the UDF. If None, the user's email is used as the ID.
- `_dtype_out_vector` _str_ - Desired data type for vector output, defaults to a predefined type.
- `_dtype_out_raster` _str_ - Desired data type for raster output, defaults to a predefined type.
- `_client_id` _Optional[str]_ - Client identifier for API usage. If None, a default or global client ID may be used.
- `**params` - Additional keyword arguments for the UDF execution.
**Returns**:
The response from the server after executing the UDF.
---
## `run_shared_file`
```python showLineNumbers
def run_shared_file(token: str,
*,
_dtype_out_vector: str = DEFAULT_DTYPE_VECTOR,
_dtype_out_raster: str = DEFAULT_DTYPE_RASTER,
**params) -> Optional[Union["pd.DataFrame", "xr.Dataset"]]
```
Executes a shared file-based UDF.
This function constructs a URL for running an operation on a file accessible via a shared token. It allows for customization of the output data types for vector and raster data and supports additional parameters for the operation's execution.
**Arguments**:
- `token` _str_ - A shared access token that authorizes the operation.
- `_dtype_out_vector` _str_ - Desired data type for vector output, defaults to a predefined type.
- `_dtype_out_raster` _str_ - Desired data type for raster output, defaults to a predefined type.
- `**params` - Additional keyword arguments for the operation execution.
**Returns**:
The response from the server after executing the operation on the file.
**Raises**:
- `Exception` - Describes various exceptions that could occur during the function execution, including but not limited to invalid parameters, network errors, unauthorized access errors, or server-side errors.
This function is designed to access shared operations that require a token for authorization. It requires network access to communicate with the server hosting these operations and may incur data transmission costs or delays depending on the network's performance.
---
## `run_tile_async`
```python showLineNumbers
async def run_tile_async(
email: str,
id: Optional[str] = None,
*,
x: int,
y: int,
z: int,
_dtype_out_vector: str = DEFAULT_DTYPE_VECTOR,
_dtype_out_raster: str = DEFAULT_DTYPE_RASTER,
_client_id: Optional[str] = None,
**params) -> Optional[Union["pd.DataFrame", "xr.Dataset"]]
```
Asynchronously executes a private tile-based UDF indexed under the specified email and ID. The calling user must have the necessary permissions to execute the UDF.
This function constructs a URL to asynchronously run a UDF on a specific tile defined by its x, y, and z coordinates. It supports customization of the output data types for vector and raster data, and accommodates additional parameters for the UDF execution.
**Arguments**:
- `email` _str_ - User's email address. Used to identify the user's saved UDFs. If the ID is not provided, the email is also used as the ID.
- `id` _Optional[str]_ - Unique identifier for the UDF. If None, the user's email is used as the ID.
- `x` _int_ - The x coordinate of the tile.
- `y` _int_ - The y coordinate of the tile.
- `z` _int_ - The zoom level of the tile.
- `_dtype_out_vector` _str_ - Desired data type for vector output. Defaults to a predefined type.
- `_dtype_out_raster` _str_ - Desired data type for raster output. Defaults to a predefined type.
- `_client_id` _Optional[str]_ - Client identifier for API usage. If None, a default or global client ID may be used.
- `**params` - Additional keyword arguments for the UDF execution.
**Returns**:
A coroutine that, when awaited, sends a request to the server to execute the UDF on the specified tile and returns the server's response. The format and content of the response depend on the UDF's implementation and the server's response format.
---
## `run_shared_tile_async`
```python showLineNumbers
async def run_shared_tile_async(
token: str,
*,
x: int,
y: int,
z: int,
_dtype_out_vector: str = DEFAULT_DTYPE_VECTOR,
_dtype_out_raster: str = DEFAULT_DTYPE_RASTER,
**params) -> Optional[Union["pd.DataFrame", "xr.Dataset"]]
```
Asynchronously executes a shared tile-based UDF using a specific access token.
This function constructs a URL for running an operation on a tile, defined by its x, y, and z coordinates, accessible via a shared token. It allows for customization of the output data types for vector and raster data and supports additional parameters for the operation's execution.
**Arguments**:
- `token` _str_ - A shared access token that authorizes the operation on the specified tile.
- `x` _int_ - The x coordinate of the tile.
- `y` _int_ - The y coordinate of the tile.
- `z` _int_ - The zoom level of the tile.
- `_dtype_out_vector` _str_ - Desired data type for vector output, defaults to a predefined type.
- `_dtype_out_raster` _str_ - Desired data type for raster output, defaults to a predefined type.
- `**params` - Additional keyword arguments for the operation execution.
**Returns**:
A coroutine that, when awaited, sends a request to the server to execute the operation on the specified tile and returns the server's response. The format and content of the response depend on the operation's implementation and the server's response format.
---
## `run_file_async`
```python showLineNumbers
async def run_file_async(
email: str,
id: Optional[str] = None,
*,
_dtype_out_vector: str = DEFAULT_DTYPE_VECTOR,
_dtype_out_raster: str = DEFAULT_DTYPE_RASTER,
_client_id: Optional[str] = None,
**params) -> Optional[Union["pd.DataFrame", "xr.Dataset"]]
```
Asynchronously executes a file-based UDF associated with the specific email and ID.
This function constructs a URL to run a UDF on a server, allowing for output data type customization for vector and raster outputs and supporting additional parameters for the UDF execution. If no ID is provided, the user's email is used as the identifier.
**Arguments**:
- `email` _str_ - The user's email address, used to identify the user's saved UDFs. If the ID is not provided, this email will also be used as the ID.
- `id` _Optional[str]_ - Unique identifier for the UDF. If None, the function fetches the user's email as the ID.
- `_dtype_out_vector` _str_ - Desired data type for vector output, defaults to a predefined type.
- `_dtype_out_raster` _str_ - Desired data type for raster output, defaults to a predefined type.
- `_client_id` _Optional[str]_ - Client identifier for API usage. If None, a default or global client ID may be used.
- `**params` - Additional keyword arguments for the UDF execution.
**Returns**:
A coroutine that, when awaited, sends a request to the server to execute the UDF and returns the server's response. The format and content of the response depend on the UDF's implementation and the server's response format.
---
## `run_shared_file_async`
```python showLineNumbers
async def run_shared_file_async(
token: str,
*,
_dtype_out_vector: str = DEFAULT_DTYPE_VECTOR,
_dtype_out_raster: str = DEFAULT_DTYPE_RASTER,
**params) -> Optional[Union["pd.DataFrame", "xr.Dataset"]]
```
Asynchronously executes a shared file-based UDF using the specific access token.
Constructs a URL to run an operation on a file accessible via a shared token, enabling customization of the output data types for vector and raster data. It accommodates additional parameters for the operation's execution.
**Arguments**:
- `token` _str_ - A shared access token that authorizes the operation.
- `_dtype_out_vector` _str_ - Desired data type for vector output, defaults to a predefined type.
- `_dtype_out_raster` _str_ - Desired data type for raster output, defaults to a predefined type.
- `**params` - Additional keyword arguments for the operation execution.
**Returns**:
A coroutine that, when awaited, sends a request to the server to execute the operation on the file and returns the server's response. The format and content of the response depend on the operation's implementation and the server's response format.
================================================================================
## @fused.cache
Path: python-sdk/api-reference/fused-cache.mdx
URL: https://docs.fused.io/python-sdk/api-reference/fused-cache
# @fused.cache
```python
cache(
func: Callable[..., Any] | None = None,
cache_max_age: str | int | None = None,
cache_folder_path: str = "tmp",
concurrent_lock_timeout: str | int = 120,
cache_reset: bool | None = None,
cache_storage: StorageStr | None = None,
cache_key_exclude: Iterable[str] = None,
cache_verbose: bool | None = None,
) -> Callable[..., Any]
```
Decorator to cache the return value of a function.
This function serves as a decorator that can be applied to any function to cache its return values. The cache behavior can be customized through keyword arguments.
## Parameters
- **func** (`Callable`) – The function to be decorated. If None, this returns a partial decorator with the passed keyword arguments.
- **cache_max_age** (`str | int`) – A string with a numbered component and units. Supported units are seconds (s), minutes (m), hours (h), and days (d) (e.g. "48h", "10s", etc.).
- **cache_folder_path** (`str`) – Folder to append to the configured cache directory.
- **concurrent_lock_timeout** (`str | int`) – Max amount of time in seconds for subsequent concurrent calls to wait for a previous concurrent call to finish execution and to write the cache file.
- **cache_reset** (`bool | None`) – Ignore `cache_max_age` and overwrite cached result.
- **cache_storage** (`StorageStr | None`) – Set where the cache data is stored. Supported values are "auto", "mount" and "local". Auto will automatically select the storage location defined in options (mount if it exists, otherwise local) and ensures that it exists and is writable. Mount gets shared across executions where local will only be shared within the same execution.
- **cache_key_exclude** (`Iterable[str]`) – An iterable of parameter names to exclude from the cache key calculation. Useful for arguments that do not affect the result of the function and could cause unintended cache expiry (e.g. database connection objects).
- **cache_verbose** (`bool | None`) – Print a message when a cached result is returned.
## Returns
`Callable` – A decorator that, when applied to a function, caches its return values according to the specified keyword arguments.
## Examples
Use the `@cache` decorator to cache the return value of a function in a custom path.
```python
@fused.cache(cache_folder_path="/tmp/custom_path/")
def expensive_function():
# Function implementation goes here
return result
```
If the output of a cached function changes, for example if remote data is modified, it can be reset by running the function with the `cache_reset` keyword argument when calling the function.
```python
expensive_function(cache_reset=True)
```
================================================================================
## fused.context
Path: python-sdk/api-reference/fused-context.mdx
URL: https://docs.fused.io/python-sdk/api-reference/fused-context
# context
Access runtime context information from within a UDF. These functions return information about the current execution environment.
```python
@fused.udf
def udf():
# Check if running in realtime or batch
if fused.context.in_realtime():
print("Running in realtime")
# Current UDF (raises if not in a UDF)
udf_obj = fused.context.this_udf()
headers = fused.context.get_headers()
```
## Functions
### get_header
```python
get_header(name: str) -> str | None
```
Get a specific request header by name (case-insensitive).
### get_headers
```python
get_headers() -> dict[str, str]
```
Get the request headers that were passed to the UDF.
### get_recursion_factor
```python
get_recursion_factor() -> int | None
```
Get the recursion factor from the current context.
### get_realtime_client_id
```python
get_realtime_client_id() -> str | None
```
Get the realtime client ID from the current context.
### get_user_email
```python
get_user_email() -> str | None
```
Get the user email from the current context.
### in_batch
```python
in_batch() -> bool
```
Return True if the context is in a batch job.
### in_realtime
```python
in_realtime() -> bool
```
Return True if the context is in a realtime job.
### this_udf
```python
this_udf() -> Udf
```
The UDF that is currently being run. Raises `ValueError("No UDF is currently being run.")` when not running inside a UDF.
### get_global_context
```python
get_global_context() -> ExecutionContextProtocol | None
```
Get the global execution context object.
## Usage Example
```python
@fused.udf
def udf():
# Conditional behavior based on execution mode
if fused.context.in_batch():
# Use larger chunk sizes for batch
chunk_size = 10000
else:
# Smaller chunks for realtime
chunk_size = 1000
# Access custom headers passed via API
api_key = fused.context.get_header("X-API-Key")
# Log who is running this UDF
user = fused.context.get_user_email()
print(f"Running for user: ")
# Access the running UDF object
current = fused.context.this_udf()
return process_data(chunk_size)
```
================================================================================
## fused.download
Path: python-sdk/api-reference/fused-download.mdx
URL: https://docs.fused.io/python-sdk/api-reference/fused-download
# download
```python
download(url: str, file_path: str, storage: StorageStr = 'auto') -> str
```
Download a file.
May be called from multiple processes with the same inputs to get the same result.
Fused runs UDFs from top to bottom each time code changes. This means objects in the UDF are recreated each time, which can slow down a UDF that downloads files from a remote server.
Downloaded files are written to a mounted volume shared across all UDFs in an organization. This means that a file downloaded by one UDF can be read by other UDFs.
Fused addresses the latency of downloading files with the download utility function. It stores files in the mounted filesystem so they only download the first time.
Because a Tile UDF runs multiple chunks in parallel, the download function sets a signal lock during the first download attempt, to ensure the download happens only once.
## Parameters
- **url** (`str`) – The URL to download.
- **file_path** (`str`) – The local path where to save the file.
- **storage** (`StorageStr`) – Set where the cache data is stored. Supported values are "auto", "mount" and "local". Auto will automatically select the storage location defined in options (mount if it exists, otherwise local) and ensures that it exists and is writable. Mount gets shared across executions where local will only be shared within the same execution.
## Returns
- `str` – The function downloads the file only on the first execution, and returns the file path.
## Example
```python
@fused.udf
def geodataframe_from_geojson():
url = "s3://sample_bucket/my_geojson.zip"
path = fused.core.download(url, "tmp/my_geojson.zip")
gdf = gpd.read_file(path)
return gdf
```
================================================================================
## fused.file_path
Path: python-sdk/api-reference/fused-file-path.mdx
URL: https://docs.fused.io/python-sdk/api-reference/fused-file-path
# file_path
```python
file_path(
file_path: str, mkdir: bool = True, storage: StorageStr = "auto"
) -> str
```
Creates a directory in a predefined temporary directory.
This gives users the ability to manage directories during the execution of a UDF. It takes a relative file_path, creates the corresponding directory structure, and returns its absolute path.
This is useful for UDFs that temporarily store intermediate results as files, such as when writing intermediary files to disk when processing large datasets. `file_path` ensures that necessary directories exist. The directory is kept for 12h.
## Parameters
- **file_path** (`str`) – The relative file path to locate.
- **mkdir** (`bool`) – If True, create the directory if it doesn't already exist. Defaults to True.
- **storage** (`StorageStr`) – Set where the cache data is stored. Supported values are "auto", "mount" and "local". Auto will automatically select the storage location defined in options (mount if it exists, otherwise local) and ensures that it exists and is writable. Mount gets shared across executions where local will only be shared within the same execution.
## Returns
- `str` – The located file path.
================================================================================
## fused.find_dataset
Path: python-sdk/api-reference/fused-find-dataset.mdx
URL: https://docs.fused.io/python-sdk/api-reference/fused-find-dataset
# find_dataset
Find the dataset that contains a specific location URL.
```python
fused.find_dataset(
location: str,
base_url: str | None = None
) -> dict[str, Any]
```
Uses hierarchical prefix matching: if the exact path isn't registered, searches progressively shorter prefixes to find the containing dataset.
## Parameters
- **location** (`str`) – Full URL to search for (`s3://`, `gs://`, `http://`, etc.). Can be a file, partition, or directory path.
- **base_url** (`str | None`) – Base URL for API. If None, uses current environment.
## Returns
- `dict` – Dataset dict with keys: `id`, `location`, `description`, `storage_type`, `owner`, `public`, `created_at`, `updated_at`, etc.
## Raises
- `requests.HTTPError` – If dataset not found (404) or request fails.
## Example
```python
# Find dataset containing a file
dataset = fused.find_dataset("s3://bucket/data/year=2024/file.parquet")
print(f"Found dataset: ")
```
## See also
- `fused.register_dataset` – Register a new dataset
================================================================================
## fused.get_chunk_from_table
Path: python-sdk/api-reference/fused-get-chunk-from-table.mdx
URL: https://docs.fused.io/python-sdk/api-reference/fused-get-chunk-from-table
# get_chunk_from_table
```python
get_chunk_from_table(
url: str,
file_id: Union[str, int, None],
chunk_id: Optional[int],
*,
columns: Optional[Iterable[str]] = None
) -> gpd.GeoDataFrame
```
Returns a chunk from a table and chunk coordinates.
This can be called with file_id and chunk_id from `get_chunks_metadata`.
## Parameters
- **url** (`str`) – URL of the table.
- **file_id** (`Union[str, int, None]`) – File ID to read.
- **chunk_id** (`Optional[int]`) – Chunk ID to read.
- **columns** (`Optional[Iterable[str]]`) – Read only the specified columns.
================================================================================
## fused.get_chunks_metadata
Path: python-sdk/api-reference/fused-get-chunks-metadata.mdx
URL: https://docs.fused.io/python-sdk/api-reference/fused-get-chunks-metadata
# get_chunks_metadata
```python
get_chunks_metadata(url: str) -> gpd.GeoDataFrame
```
Returns a GeoDataFrame with each chunk in the table as a row.
## Parameters
- **url** (`str`) – URL of the table.
================================================================================
## fused.ingest_nongeospatial
Path: python-sdk/api-reference/fused-ingest-nongeospatial.mdx
URL: https://docs.fused.io/python-sdk/api-reference/fused-ingest-nongeospatial
# ingest_nongeospatial
```python
ingest_nongeospatial(
input: str | Path | Sequence[str, Path] | pd.DataFrame | gpd.GeoDataFrame,
output: str | None = None,
*,
output_metadata: str | None = None,
partition_col: str | None = None,
partitioning_maximum_per_file: int = 2_500_000,
partitioning_maximum_per_chunk: int = 65_000
) -> NonGeospatialPartitionJobStepConfig
```
Ingest a dataset into the Fused partitioned format.
## Parameters
- **input** (`str | Path | Sequence[str, Path] | pd.DataFrame | gpd.GeoDataFrame`) – A GeoPandas `GeoDataFrame` or a path to file or files on S3 to ingest. Files may be Parquet or another geo data format.
- **output** (`str | None`) – Location on S3 to write the `main` table to.
- **output_metadata** (`str | None`) – Location on S3 to write the `fused` table to.
- **partition_col** (`str | None`) – Partition along this column for nongeospatial datasets.
- **partitioning_maximum_per_file** (`int`) – Maximum number of items to store in a single file. Defaults to 2,500,000.
- **partitioning_maximum_per_chunk** (`int`) – Maximum number of items to store in a single file. Defaults to 65,000.
## Returns
Configuration object describing the ingestion process. Call `.execute` on this object to start a job.
## Example
```python
job = fused.ingest_nongeospatial(
input=gdf,
output="s3://sample-bucket/file.parquet",
).execute()
```
================================================================================
## fused.ingest
Path: python-sdk/api-reference/fused-ingest.mdx
URL: https://docs.fused.io/python-sdk/api-reference/fused-ingest
# ingest
```python
ingest(
input: str | Path | Sequence[str | Path] | gpd.GeoDataFrame,
output: str | None = None,
*,
output_metadata: str | None = None,
schema: Schema | None = None,
file_suffix: str | None = None,
load_columns: Sequence[str] | None = None,
remove_cols: Sequence[str] | None = None,
explode_geometries: bool = False,
drop_out_of_bounds: bool | None = None,
partitioning_method: Literal["area", "length", "coords", "rows"] = "rows",
partitioning_maximum_per_file: int | float | None = None,
partitioning_maximum_per_chunk: int | float | None = None,
partitioning_max_width_ratio: int | float = 2,
partitioning_max_height_ratio: int | float = 2,
partitioning_force_utm: Literal["file", "chunk", None] = "chunk",
partitioning_split_method: Literal["mean", "median"] = "mean",
subdivide_method: Literal["area", None] = None,
subdivide_start: float | None = None,
subdivide_stop: float | None = None,
split_identical_centroids: bool = True,
target_num_chunks: int = 500,
lonlat_cols: tuple[str, str] | None = None,
partitioning_schema_input: str | pd.DataFrame | None = None,
gdal_config: GDALOpenConfig | dict[str, Any] | None = None,
overwrite: bool = False,
write_covering_bbox: bool = False,
as_udf: bool = False
) -> GeospatialPartitionJobStepConfig
```
Ingest a dataset into the Fused partitioned format.
## Parameters
- **input** (`str | Path | Sequence[str | Path] | gpd.GeoDataFrame`) – A GeoPandas `GeoDataFrame` or a path to file or files on S3 to ingest. Files may be Parquet or another geo data format.
- **output** (`str | None`) – Location on S3 to write the `main` table to.
- **output_metadata** (`str | None`) – Location on S3 to write the `fused` table to.
- **schema** (`Schema | None`) – Schema of the data to be ingested. This is optional and will be inferred from the data if not provided.
- **file_suffix** (`str | None`) – filter which files are used for ingestion. If `input` is a directory on S3, all files under that directory will be listed and used for ingestion. If `file_suffix` is not None, it will be used to filter paths by checking the trailing characters of each filename. E.g. pass `file_suffix=".geojson"` to include only GeoJSON files inside the directory.
- **load_columns** (`Sequence[str] | None`) – Read only this set of columns when ingesting geospatial datasets. Defaults to all columns.
- **remove_cols** (`Sequence[str] | None`) – The named columns to drop when ingesting geospatial datasets. Defaults to not drop any columns.
- **explode_geometries** (`bool`) – Whether to unpack multipart geometries to single geometries when ingesting geospatial datasets, saving each part as its own row. Defaults to `False`.
- **drop_out_of_bounds** (`bool | None`) – Whether to drop geometries outside of the expected WGS84 bounds. Defaults to True.
- **partitioning_method** (`Literal['area', 'length', 'coords', 'rows']`) – The method to use for grouping rows into partitions. Defaults to `"rows"`.
- `"area"`: Construct partitions where all contain a maximum total area among geometries.
- `"length"`: Construct partitions where all contain a maximum total length among geometries.
- `"coords"`: Construct partitions where all contain a maximum total number of coordinates among geometries.
- `"rows"`: Construct partitions where all contain a maximum number of rows.
- **partitioning_maximum_per_file** (`int | float | None`) – Maximum value for `partitioning_method` to use per file. If `None`, defaults to _1/10th_ of the total value of `partitioning_method`. So if the value is `None` and `partitioning_method` is `"area"`, then each file will have no more than 1/10th the total area of all geometries. Defaults to `None`.
- **partitioning_maximum_per_chunk** (`int | float | None`) – Maximum value for `partitioning_method` to use per chunk. If `None`, defaults to _1/100th_ of the total value of `partitioning_method`. So if the value is `None` and `partitioning_method` is `"area"`, then each file will have no more than 1/100th the total area of all geometries. Defaults to `None`.
- **partitioning_max_width_ratio** (`int | float`) – The maximum ratio of width to height of each partition to use in the ingestion process. So for example, if the value is `2`, then if the width divided by the height is greater than `2`, the box will be split in half along the horizontal axis. Defaults to `2`.
- **partitioning_max_height_ratio** (`int | float`) – The maximum ratio of height to width of each partition to use in the ingestion process. So for example, if the value is `2`, then if the height divided by the width is greater than `2`, the box will be split in half along the vertical axis. Defaults to `2`.
- **partitioning_force_utm** (`Literal["file", "chunk", None]`) – Whether to force partitioning within UTM zones. If set to `"file"`, this will ensure that the centroid of all geometries per _file_ are contained in the same UTM zone. If set to `"chunk"`, this will ensure that the centroid of all geometries per _chunk_ are contained in the same UTM zone. If set to `None`, then no UTM-based partitioning will be done. Defaults to "chunk".
- **partitioning_split_method** (`Literal["mean", "median"]`) – How to split one partition into children. Defaults to `"mean"` (this may change in the future).
- `"mean"`: Split each axis according to the mean of the centroid values.
- `"median"`: Split each axis according to the median of the centroid values.
- **subdivide_method** (`Literal["area", None]`) – The method to use for subdividing large geometries into multiple rows. Currently the only option is `"area"`, where geometries will be subdivided based on their area (in WGS84 degrees).
- **subdivide_start** (`float | None`) – The value above which geometries will be subdivided into smaller parts, according to `subdivide_method`.
- **subdivide_stop** (`float | None`) – The value below which geometries will not be subdivided into smaller parts, according to `subdivide_method`. Recommended to be equal to subdivide_start. If `None`, geometries will be subdivided up to a recursion depth of 100 or until the subdivided geometry is rectangular.
- **split_identical_centroids** (`bool`) – If `True`, should split a partition that has identical centroids (such as if all geometries in the partition are the same) if there are more such rows than defined in "partitioning_maximum_per_file" and "partitioning_maximum_per_chunk".
- **target_num_chunks** (`int`) – The target for the number of files if `partitioning_maximum_per_file` is None. Note that this number is only a _target_ and the actual number of files generated can be higher or lower than this number, depending on the spatial distribution of the data itself. Defaults to 500, rough default to use in most cases.
- **lonlat_cols** (`tuple[str, str] | None`) – Names of longitude, latitude columns to construct point geometries from. If your point columns are named `"x"` and `"y"`, then pass `lonlat_cols=("x", "y")`. This only applies to reading from Parquet files. For reading from CSV files, pass options to `gdal_config`.
- **gdal_config** (`GDALOpenConfig | dict[str, Any] | None`) – Configuration options to pass to GDAL for how to read these files. For all files other than Parquet files, Fused uses GDAL as a step in the ingestion process. For some inputs, like CSV files or zipped shapefiles, you may need to pass some parameters to GDAL to tell it how to open your files. This config is expected to be a dictionary with up to two keys: `layer` (`str`): Define the layer of the input file you wish to read when the source contains multiple layers, as in GeoPackage. `open_options` (`Dict[str, str]`): Pass in key-value pairs with GDAL open options. These are defined on each driver's page in the GDAL documentation. For example, if you're ingesting a CSV file with two columns `"longitude"` and `"latitude"` denoting the coordinate information, pass `gdal_config=}`.
- **overwrite** (`bool`) – If True, overwrite the output directory if it already exists (by first removing all existing content of the directory, i.e. it does not only overwrite conflicting files). Defaults to False.
- **write_covering_bbox** (`bool`) – If True, write output as GeoParquet 1.1 with a per-row bbox covering column, enabling efficient spatial filtering. Defaults to False.
- **as_udf** (`bool`) – Return the ingestion workflow as a UDF that can be executed using `fused.run()`. Local files or python objects passed to `input` or `partitioning_schema_input` are still uploaded to S3 first such that those are available when executing the UDF remotely. Defaults to False.
## Returns
Configuration object describing the ingestion process. Call `.execute` on this object to start a job.
## Example
For example, to ingest the California Census dataset for the year 2022:
```python
job = fused.ingest(
input="https://www2.census.gov/geo/tiger/TIGER_RD18/STATE/06_CALIFORNIA/06/tl_rd22_06_bg.zip",
output="s3://fused-sample/census/ca_bg_2022/main/",
output_metadata="s3://fused-sample/census/ca_bg_2022/fused/",
explode_geometries=True,
partitioning_maximum_per_file=2000,
partitioning_maximum_per_chunk=200,
).run_batch()
```
---
## job.run_batch
```python
def run_batch(
output_table: Optional[str] = ...,
instance_type: Optional[WHITELISTED_INSTANCE_TYPES] = None,
*,
region: str | None = None,
disk_size_gb: int | None = None,
additional_env: List[str] | None = None,
image_name: Optional[str] = None,
ignore_no_udf: bool = False,
ignore_no_output: bool = False,
validate_imports: Optional[bool] = None,
validate_inputs: bool = True,
overwrite: Optional[bool] = None
) -> RunResponse
```
Begin execution of the ingestion job by calling `run_batch` on the job object.
### Parameters
- `output_table` – The name of the table to write to. Defaults to None.
- `instance_type` – The AWS EC2 instance type to use for the job. Acceptable strings are `m5.large`, `m5.xlarge`, `m5.2xlarge`, `m5.4xlarge`, `m5.8xlarge`, `m5.12xlarge`, `m5.16xlarge`, `r5.large`, `r5.xlarge`, `r5.2xlarge`, `r5.4xlarge`, `r5.8xlarge`, `r5.12xlarge`, or `r5.16xlarge`. Defaults to None.
- `region` – The AWS region in which to run. Defaults to None.
- `disk_size_gb` – The disk size to specify for the job. Defaults to None.
- `additional_env` – Any additional environment variables to be passed into the job. Defaults to None.
- `image_name` – Custom image name to run. Defaults to None for default image.
- `ignore_no_udf` – Ignore validation errors about not specifying a UDF. Defaults to False.
- `ignore_no_output` – Ignore validation errors about not specifying output location. Defaults to False.
---
## Monitoring jobs
Calling `run_batch` returns a `RunResponse` object with helper methods.
```python
# Declare ingest job
job = fused.ingest(
input="https://www2.census.gov/geo/tiger/TIGER_RD18/STATE/06_CALIFORNIA/06/tl_rd22_06_bg.zip",
output="s3://fused-sample/census/ca_bg_2022/main/"
)
# Start ingest job
job_id = job.run_batch()
```
```python
job_id.get_status() # Fetch the job status
job_id.print_logs() # Fetch and print the job's logs
job_id.get_exec_time() # Determine the job's execution time
job_id.tail_logs() # Continuously print the job's logs
job_id.cancel() # Cancel the job
```
---
## job.run_remote
Alias of `job.run_batch` for backwards compatibility. See `job.run_batch` above for details.
================================================================================
## fused.load_async
Path: python-sdk/api-reference/fused-load-async.mdx
URL: https://docs.fused.io/python-sdk/api-reference/fused-load-async
# load_async
Asynchronously load a UDF from various sources.
```python
await fused.load_async(
url_or_udf: str | Path,
/,
*,
cache_key: Any = None,
import_globals: bool = True
) -> Udf
```
This is the async-optimized version of `fused.load()` that uses async HTTP requests to avoid blocking the event loop during UDF metadata fetching.
## Parameters
- **url_or_udf** (`str | Path`) – A string representing the location of the UDF, or the raw code of the UDF.
- **cache_key** (`Any`) – An optional key used for caching the loaded UDF.
- **import_globals** (`bool`) – Expose the globals defined in the UDF's context as attributes on the UDF object.
## Returns
- `Udf` – An instance of the loaded UDF.
## Example
```python
# Load a UDF asynchronously
udf = await fused.load_async("username@fused.io/my_udf_name")
# Use in parameter validation
if not isinstance(udf, Udf):
udf = await fused.load_async(udf)
```
## See also
- `fused.load` – Synchronous version
- `fused.run_async` – Run a UDF asynchronously
================================================================================
## fused.load
Path: python-sdk/api-reference/fused-load.mdx
URL: https://docs.fused.io/python-sdk/api-reference/fused-load
# load
```python
load(
url_or_udf: Union[str, Path],
/,
*,
cache_key: Any = None,
import_globals: bool = True,
) -> AnyBaseUdf
```
Loads a UDF from various sources including GitHub URLs and a Fused platform-specific identifier.
This function supports loading UDFs from a GitHub repository URL, or a Fused platform-specific identifier composed of an email and UDF name. It intelligently determines the source type based on the format of the input and retrieves the UDF accordingly.
## Parameters
- **url_or_udf** (`Union[str, Path]`) – A string representing the location of the UDF, or the raw code of the UDF. The location can be a GitHub URL starting with "https://github.com", a Fused platform-specific identifier in the format "email/udf_name", or a local file path pointing to a Python file.
- **cache_key** (`Any`) – An optional key used for caching the loaded UDF. If provided, the function will attempt to load the UDF from cache using this key before attempting to load it from the specified source. Defaults to None, indicating no caching.
- **import_globals** (`bool`) – Expose the globals defined in the UDF's context as attributes on the UDF object (default True). This requires executing the code of the UDF. To globally configure this behavior, use `fused.options.never_import`.
## Returns
- **AnyBaseUdf** – An instance of the loaded UDF.
## Raises
- `ValueError` – If the URL or Fused platform-specific identifier format is incorrect or cannot be parsed.
- `Exception` – For errors related to network issues, file access permissions, or other unforeseen errors during the loading process.
## Examples
Load a UDF from a GitHub URL:
```python
udf = fused.load("https://github.com/fusedio/udfs/tree/main/public/REM_with_HyRiver/")
```
Load a UDF using a Fused platform-specific identifier:
```python
udf = fused.load("username@fused.io/REM_with_HyRiver")
```
================================================================================
## fused.register_dataset
Path: python-sdk/api-reference/fused-register-dataset.mdx
URL: https://docs.fused.io/python-sdk/api-reference/fused-register-dataset
# register_dataset
Register a dataset for indexed queries.
```python
fused.register_dataset(
dataset_path: str,
base_url: str | None = None
) -> dict[str, Any]
```
This function registers a directory in your file storage as a dataset, enabling fast geospatial queries using H3 indexing.
## Parameters
- **dataset_path** (`str`) – Path to the dataset directory. The path should point to a directory containing parquet files.
- **base_url** (`str | None`) – Base URL for API. If None, uses current environment.
## Returns
- `dict` – Dictionary with registration results:
- `dataset_id`: ID of the created/updated dataset
- `location`: Normalized URL of the dataset
- `visit_status`: Status of the dataset visit (success/timeout/error)
- `items_discovered`: Total number of items found
- `new_items`: Number of new items added
## Raises
- `requests.HTTPError` – If the API request fails.
## Example
```python
# Register a dataset from your storage
result = fused.register_dataset("s3://my-bucket/my-data/buildings/")
print(f"Registered dataset with ID: ")
print(f"Found files")
```
- Regular users can use any storage paths they have access to
- Datasets are registered as private (only accessible to your team)
- Files are automatically queued for metadata extraction
## See also
- `fused.find_dataset` – Find a registered dataset
================================================================================
## fused.run_async [Legacy]
Path: python-sdk/api-reference/fused-run-async.mdx
URL: https://docs.fused.io/python-sdk/api-reference/fused-run-async
# run_async [Legacy]
This function is deprecated and will be removed in a future version. Use `udf.map_async()` instead.
```python
udf.map_async(
arg_list,
engine='remote',
instance_type='realtime',
max_workers=32,
collect=True,
cache_max_age=None,
)
```
Async version of `run()` that executes a UDF asynchronously.
```python
await fused.run_async(
udf: str | Udf | UdfJobStepConfig | None = None,
*,
x: int | None = None,
y: int | None = None,
z: int | None = None,
engine: Literal['remote', 'local'] | None = None,
instance_type: str | None = None,
type: Literal['tile', 'file'] | None = None,
max_retry: int = 0,
cache_max_age: str | None = None,
cache: bool = True,
parameters: dict[str, Any] | None = None,
disk_size_gb: int | None = None,
**kw_parameters
) -> xr.Dataset | pd.DataFrame | gpd.GeoDataFrame | UdfEvaluationResult
```
This function provides the same functionality as `fused.run()` but with async execution.
## Parameters
- **udf** (`str | Udf | UdfJobStepConfig`) – The UDF to execute. Can be:
- A string representing a UDF name or shared token
- A UDF object
- A `UdfJobStepConfig` object for detailed execution configuration
- **x, y, z** (`int | None`) – Tile coordinates for tile-based UDF execution.
- **engine** (`Literal['remote', 'local'] | None`) – The execution engine to use.
- **instance_type** (`str | None`) – Instance type for remote execution (`'realtime'`, `'small'`, `'medium'`, `'large'`, or a specific instance type).
- **type** (`Literal['tile', 'file'] | None`) – The type of UDF execution.
- **max_retry** (`int`) – Maximum retries if the UDF fails. Defaults to 0.
- **cache_max_age** (`str | None`) – Maximum cache age (e.g., `"48h"`, `"10s"`).
- **cache** (`bool`) – Set to `False` to disable caching.
- **parameters** (`dict[str, Any] | None`) – Additional parameters to pass to the UDF.
- **disk_size_gb** (`int | None`) – Disk size in GB for remote execution (batch only).
- ****kw_parameters** – Additional parameters to pass to the UDF.
## Returns
The result of the UDF execution, which varies based on the UDF and execution path.
## Example
```python
# Run a UDF saved in the Fused system asynchronously
result = await fused.run_async("username@fused.io/my_udf_name")
# Run a UDF saved in GitHub asynchronously
loaded_udf = fused.load("https://github.com/fusedio/udfs/tree/main/public/Building_Tile_Example")
result = await fused.run_async(loaded_udf, bbox=bbox)
# Run a UDF saved in a local directory asynchronously
loaded_udf = fused.load("/Users/local/dir/Building_Tile_Example")
result = await fused.run_async(loaded_udf, bbox=bbox)
```
## See also
- `fused.run` – Synchronous version
- `fused.load_async` – Load a UDF asynchronously
================================================================================
## fused.run [Legacy]
Path: python-sdk/api-reference/fused-run.mdx
URL: https://docs.fused.io/python-sdk/api-reference/fused-run
# run [Legacy]
This function is deprecated and will be removed in a future version. Use `udf()` instead.
```python
udf(
*args,
engine=None,
cache_max_age=None,
cache=True,
**kwargs
)
```
```python
run(
udf: Union[str, None, UdfJobStepConfig, Udf, UdfAccessToken] = None,
*,
x: Optional[int] = None,
y: Optional[int] = None,
z: Optional[int] = None,
sync: bool = True,
engine: Optional[Literal["remote", "local"]] = None,
instance_type: Optional[InstanceType] = None,
type: Optional[Literal["tile", "file"]] = None,
max_retry: int = 0,
cache_max_age: Optional[str] = None,
cache: bool = True,
parameters: Optional[Dict[str, Any]] = None,
disk_size_gb: Optional[int] = None,
**kw_parameters
) -> Union[ResultType, Coroutine[ResultType, None, None]]
```
Executes a user-defined function (UDF) with various execution and input options.
This function supports executing UDFs in different environments (local or remote), with different types of inputs (tile coordinates, geographical bounding boxes, etc.), and allows for both synchronous and asynchronous execution.
## Parameters
- **udf** (`str, Udf or UdfJobStepConfig`) – The UDF to execute. Can be specified as:
- A string representing a UDF name or UDF shared token.
- A UDF object.
- A UdfJobStepConfig object for detailed execution configuration.
- **x, y, z** (`int`) – Tile coordinates for tile-based UDF execution.
- **sync** (`bool`) – If True, execute the UDF synchronously. If False, execute asynchronously.
- **engine** (`Optional[Literal['remote', 'local']]`) – The execution engine to use ('remote' or 'local').
- **instance_type** (`Optional[InstanceType]`) – The type of instance to use for remote execution ('realtime', or 'small', 'medium', 'large' or one of the whitelisted instance types). If not specified, gets the default from the UDF or defaults to 'realtime'.
- **disk_size_gb** (`Optional[int]`) – The size of the disk in GB to use for remote execution (only supported for a batch instance type).
- **type** (`Optional[Literal['tile', 'file']]`) – The type of UDF execution ('tile' or 'file').
- **max_retry** (`int`) – The maximum number of retries to attempt if the UDF fails. By default does not retry.
- **cache_max_age** (`Optional[str]`) – The maximum age when returning a result from the cache. Supported units are seconds (s), minutes (m), hours (h), and days (d) (e.g. "48h", "10s", etc.). Default is `None` so a UDF run with `fused.run()` will follow `cache_max_age` defined in `@fused.udf()` unless this value is changed.
- **cache** (`bool`) – Set to False as a shortcut for `cache_max_age='0s'` to disable caching.
- **parameters** (`Optional[Dict[str, Any]]`) – Additional parameters to pass to the UDF.
- **\*\*kw_parameters** – Additional parameters to pass to the UDF.
## Raises
- `ValueError` – If the UDF is not specified or is specified in more than one way.
- `TypeError` – If the first parameter is not of an expected type.
## Returns
The result of the UDF execution, which varies based on the UDF and execution path.
## Examples
Run a UDF saved in the Fused system:
```python
fused.run("username@fused.io/my_udf_name")
```
Run a UDF saved in GitHub:
```python
loaded_udf = fused.load("https://github.com/fusedio/udfs/tree/main/public/Building_Tile_Example")
fused.run(loaded_udf, bbox=bbox)
```
Run a UDF saved in a local directory:
```python
loaded_udf = fused.load("/Users/local/dir/Building_Tile_Example")
fused.run(loaded_udf, bbox=bbox)
```
This function dynamically determines the execution path and parameters based on the inputs. It is designed to be flexible and support various UDF execution scenarios.
================================================================================
## fused.secrets
Path: python-sdk/api-reference/fused-secrets.mdx
URL: https://docs.fused.io/python-sdk/api-reference/fused-secrets
# secrets
Access team secrets stored in the Fused backend. Team secrets are scoped to the execution environment and shared across your team or organization. Requires a paid plan.
```python
@fused.udf
def udf():
api_key = fused.secrets["MY_API_KEY"]
...
```
## Overview
`fused.secrets` is a `SecretsManager` object that provides access to team secrets stored in your Fused account. Secrets can be accessed by name using bracket notation or dot notation.
Secrets can be managed in Workbench under **Integrations & secrets**, or programmatically via the SDK.
## Usage
### Accessing secrets
```python
@fused.udf
def udf():
api_key = fused.secrets["OPENAI_API_KEY"]
client = openai.OpenAI(api_key=api_key)
...
```
### Managing secrets
```python
@fused.udf
def udf():
fused.secrets["MY_KEY"] = "value"
del fused.secrets["MY_KEY"]
dir(fused.secrets)
```
## Security notes
- Team secrets are accessible by anyone in your team
- Secrets are stored encrypted in the Fused backend
- Never log or return secret values from UDFs
## See also
- `fused.user_secrets` for user-owned secrets that persist across environments
- Secrets Management for a full guide on storing, accessing, and securing secrets
- Cloud Storage for connecting to cloud providers
================================================================================
## fused.submit [Legacy]
Path: python-sdk/api-reference/fused-submit.mdx
URL: https://docs.fused.io/python-sdk/api-reference/fused-submit
# submit [Legacy]
This function is deprecated and will be removed in a future version. Use `udf.map()` instead.
```python
udf.map(
arg_list,
engine='remote',
instance_type='realtime',
max_workers=32,
collect=True,
cache_max_age=None,
)
```
```python
submit(
udf: AnyBaseUdf | FunctionType | str,
arg_list: list | pd.DataFrame,
*,
engine: Literal["remote", "local"] | None = "remote",
instance_type: InstanceType | None = None,
max_workers: int | None = None,
n_processes_per_worker: int | None = None,
max_retry: int = 2,
debug_mode: bool = False,
collect: bool = True,
execution_type: ExecutionType = "thread_pool",
cache_max_age: str | None = None,
cache: bool = True,
ignore_exceptions: bool = False,
flatten: bool = True,
**kwargs
) -> JobPool | ResultType | pd.DataFrame
```
Executes a user-defined function (UDF) multiple times for a list of input parameters, and returns immediately a "lazy" JobPool object allowing to inspect the jobs and wait on the results.
Each individual UDF run will be cached following the standard caching logic as with `fused.run()` and the specified `cache_max_age`. Additionally, when `collect=True` (the default), the collected results are cached locally for the duration of `cache_max_age` or 12h by default.
## Parameters
- **udf** (`AnyBaseUdf | FunctionType | str`) – The UDF to execute. See `fused.run` for more details on how to specify the UDF.
- **arg_list** (`list | pd.DataFrame`) – A list of input parameters for the UDF. Can be specified as:
- a list of values for parametrizing over a single parameter
- a list of dictionaries for parametrizing over multiple parameters
- A DataFrame for parametrizing over multiple parameters where each row is a set of parameters
- **engine** (`Literal['remote', 'local'] | None`) – The execution engine to use. Defaults to 'remote'.
- **instance_type** (`InstanceType | None`) – The type of instance to use for remote execution ('realtime', or 'small', 'medium', 'large' or one of the whitelisted instance types). Defaults to 'realtime'.
- **max_workers** (`int | None`) – The maximum number of workers to use. Defaults to 32 for realtime (max 1024), and 1 for batch instances (max 5).
- **n_processes_per_worker** (`int | None`) – The number of processes to use per worker. For realtime instances, defaults to 1. For batch instances, defaults to the number of cores.
- **max_retry** (`int`) – The maximum number of retries for failed jobs. Defaults to 2.
- **debug_mode** (`bool`) – If True, executes only the first item in arg_list directly using `fused.run()`, useful for debugging. Default is False.
- **collect** (`bool`) – If True, waits for all jobs to complete and returns the collected DataFrame. If False, returns a JobPool object. Default is True.
- **execution_type** (`ExecutionType`) – The type of batching to use. Either "thread_pool" (default) or "async_loop".
- **cache_max_age** (`str | None`) – The maximum age when returning a result from the cache.
- **cache** (`bool`) – Set to False to disable caching.
- **ignore_exceptions** (`bool`) – Set to True to ignore exceptions when collecting results. Defaults to False.
- **flatten** (`bool`) – Set to True to receive a flat DataFrame of results. Defaults to True.
- **\*\*kwargs** – Additional (constant) keyword arguments to pass to the UDF.
## Returns
`JobPool | ResultType | pd.DataFrame` – JobPool, or DataFrame depending on execution_type and collect parameters.
## Examples
Run a UDF multiple times for the values 0 to 9:
```python
df = fused.submit("username@fused.io/my_udf_name", range(10))
```
Using async batch type:
```python
df = fused.submit(udf, range(10), execution_type="async_loop")
```
Being explicit about the parameter name:
```python
df = fused.submit(udf, [dict(n=i) for i in range(10)])
```
Get the pool of ongoing tasks:
```python
pool = fused.submit(udf, [dict(n=i) for i in range(10)], collect=False)
```
================================================================================
## fused.types
Path: python-sdk/api-reference/fused-types.mdx
URL: https://docs.fused.io/python-sdk/api-reference/fused-types
# types
Type annotations for UDF parameters. Use these to get proper type hints and enable Fused-specific behaviors.
```python
from fused.types import Bounds, TileGDF
@fused.udf
def udf(bounds: Bounds = None):
...
```
## Type Variables
### Bounds
```python
Bounds = TypeVar("Bounds", bound=list)
```
A bounding box as a list of `[min_x, min_y, max_x, max_y]`. When used as a UDF parameter type hint, Fused automatically structures the bounds object based on how the UDF is called.
```python
@fused.udf
def udf(bounds: fused.types.Bounds = None):
# bounds is structured by Fused based on x, y, z or bbox input
return gdf[gdf.geometry.intersects(bounds.geometry[0])]
```
### Bbox [Legacy]
```python
Bbox = TypeVar("Bbox", bound=shapely.geometry.polygon.Polygon)
```
A bounding box as a Shapely Polygon geometry.
### Tile [Legacy]
```python
Tile = TypeVar("Tile", bound=gpd.GeoDataFrame)
```
A GeoDataFrame representing a tile. Alias for `TileGDF`.
### TileGDF [Legacy]
```python
TileGDF = TypeVar("TileGDF", bound=gpd.GeoDataFrame)
```
A GeoDataFrame representing a tile with geometry and metadata columns.
### TileXYZ [Legacy]
```python
TileXYZ = TypeVar("TileXYZ", bound=mercantile.Tile)
```
A mercantile Tile object with `x`, `y`, `z` attributes.
### ViewportGDF [Legacy]
```python
ViewportGDF = TypeVar("ViewportGDF", bound=gpd.GeoDataFrame)
```
A GeoDataFrame representing the current viewport bounds.
## Exception Types
### UdfTimeoutError
Raised when a UDF execution exceeds the time limit.
### UdfRuntimeError
Raised when a UDF encounters a runtime error during execution.
### UdfSerializationError
Raised when a UDF result cannot be serialized for return.
================================================================================
## @fused.udf
Path: python-sdk/api-reference/fused-udf.mdx
URL: https://docs.fused.io/python-sdk/api-reference/fused-udf
# @fused.udf
```python
udf(
fn: Optional[Callable] = None,
*,
name: Optional[str] = None,
cache_max_age: Optional[str] = None,
engine: Optional[str] = None,
disk_size_gb: Optional[int] = None,
region: Optional[str] = None,
default_parameters: Optional[Dict[str, Any]] = None,
headers: Optional[Sequence[Union[str, Header]]] = None,
**kwargs: dict[str, Any]
) -> Callable[..., Udf]
```
A decorator that transforms a function into a Fused UDF.
## Parameters
- **name** (`Optional[str]`) – The name of the UDF object. Defaults to the name of the function.
- **cache_max_age** (`Optional[str]`) – The maximum age when returning a result from the cache.
- **engine** (`Optional[str]`) – The execution engine to use (`'remote'`, `'local'`, `'realtime'`, or a batch instance type like `'small'`, `'medium'`, `'large'`, `'m5.large'`, etc.). If not specified (and also not specified when calling the UDF), defaults to `'realtime'`.
- **instance_type** (`Optional[str]`) – **[Deprecated]** Use `engine` instead. Accepts the same values as `engine`.
- **disk_size_gb** (`Optional[int]`) – The size of the disk in GB to use for remote execution (only supported for batch instance types).
- **default_parameters** (`Optional[Dict[str, Any]]`) – Parameters to embed in the UDF object, separately from the arguments list of the function. Defaults to None for empty parameters.
- **headers** (`Optional[Sequence[Union[str, Header]]]`) – A list of files to include as modules when running the UDF. For example, when specifying `headers=['my_header.py']`, inside the UDF function it may be referenced as:
```python
my_header.my_function()
```
Defaults to None for no headers.
## Returns
- `Callable[..., Udf]` – A callable that represents the transformed UDF.
## Examples
Basic UDF:
```python
@fused.udf
def udf(bbox, table_path="s3://fused-asset/infra/building_msft_us"):
...
gdf = table_to_tile(bbox, table=table_path)
return gdf
```
UDF with a specific engine:
```python
@fused.udf(engine='large')
def udf(bbox):
# Runs on a large batch instance by default
...
return result
```
================================================================================
## fused.user_secrets
Path: python-sdk/api-reference/fused-user-secrets.mdx
URL: https://docs.fused.io/python-sdk/api-reference/fused-user-secrets
# user_secrets
Access secrets that are private to you. User secrets are private to the authenticated user — they are not shared with your team. Requires a paid plan.
```python
@fused.udf
def udf():
val = fused.user_secrets["MY_KEY"]
...
```
## Overview
`fused.user_secrets` is a `UserSecretsManager` object that provides read-only access to secrets owned by the authenticated user. Unlike `fused.secrets` (team secrets), user secrets follow you across execution environments and are not visible to other team members.
To create, update, or delete user secrets, use the Workbench UI under **Integrations & secrets**.
## Usage
### Accessing secrets
```python
@fused.udf
def udf():
val = fused.user_secrets["MY_KEY"]
# or
val = fused.user_secrets.MY_KEY
...
```
### Listing secret keys
```python
@fused.udf
def udf():
keys = list(fused.user_secrets)
...
```
## Security notes
- User secrets are private to the authenticated user
- Secrets are stored encrypted in the Fused backend
- Never log or return secret values from UDFs
## See also
- `fused.secrets` for team-shared secrets scoped to an execution environment
- Secrets Management for a full guide on storing, accessing, and securing secrets
================================================================================
## fused.h3
Path: python-sdk/api-reference/h3.mdx
URL: https://docs.fused.io/python-sdk/api-reference/h3
## persist_hex_table_metadata
```python
persist_hex_table_metadata(
dataset_path: str,
output_path: str | None = None,
metadata_path: str | None = None,
verbose: bool = False,
row_group_size: int = 500,
indexed_columns: list[str] | None = None,
pool_size: int = 10,
metadata_compression_level: int | None = None,
) -> str
```
Persist metadata for a hex table to enable serverless queries.
Scans all parquet files in the dataset, extracts metadata needed for
fast reconstruction, and writes one .metadata.parquet file per source file.
Each metadata file contains:
- Row group metadata (offsets, H3 ranges, etc.)
- Full metadata_json stored as custom metadata in the parquet schema
Requires a 'hex' column (or variant like h3, h3_index) in all files.
Raises ValueError if no hex column is found.
**Parameters:**
- **dataset_path** (`str`) – Path to the dataset directory (e.g., "s3://bucket/dataset/")
- **output_path** (`str | None`) – Deprecated - use metadata_path instead
- **metadata_path** (`str | None`) – Directory path where metadata files should be written.
If None, writes to \/.fused/\.metadata.parquet
for each source file. If provided, writes to
\/\.metadata.parquet using the full
source path as the filename. This allows storing metadata in a
different location when you don't have write access to the dataset directory.
- **verbose** (`bool`) – If True, print timing/progress information.
- **row_group_size** (`int`) – Number of rows per row group in output parquet file.
Default is 500. Larger values reduce file size but may
increase memory usage during writes.
- **indexed_columns** (`list[str] | None`) – List of column names to index. If None (default),
indexes only the first identified indexed column
(typically the hex column). If an empty list, indexes
all detected indexed columns.
- **pool_size** (`int`) – Number of parallel workers to use for processing files.
Default is 10 (parallel processing enabled by default).
Set to 1 for sequential processing. This can significantly speed up
metadata extraction for large datasets with many files.
- **metadata_compression_level** (`int | None`) – Optional zstd compression level for metadata
parquet files. If None, uses PyArrow's default for zstd. Valid
levels are typically in the range [1, 22].
**Returns:**
- `str` – Path to metadata directory (if metadata_path provided) or first metadata file path
**Raises:**
- `ImportError` – If job2 package is not available
- `ValueError` – If no hex column is found in any file
- `FileNotFoundError` – If no parquet files are found in the dataset
**Example:**
```python
fused.h3.persist_hex_table_metadata("s3://my-bucket/my-dataset/")
# 's3://my-bucket/my-dataset/.fused/file1.metadata.parquet'
fused.h3.persist_hex_table_metadata("s3://my-bucket/my-dataset/", metadata_path="s3://my-bucket/metadata/")
# 's3://my-bucket/metadata/'
fused.h3.persist_hex_table_metadata("s3://my-bucket/my-dataset/", pool_size=4)
# 's3://my-bucket/my-dataset/.fused/file1.metadata.parquet'
```
---
## read_hex_table
```python
read_hex_table(
dataset_path: str,
hex_ranges_list: List[List[int]],
columns: Optional[List[str]] = None,
base_url: Optional[str] = None,
verbose: bool = False,
return_timing_info: bool = False,
batch_size: Optional[int] = None,
max_concurrent_downloads: Optional[int] = None,
) -> "pa.Table" | tuple["pa.Table", Dict[str, Any]]
```
Read data from an H3-indexed dataset by querying hex ranges.
This is an optimized version that assumes the server always provides full metadata
(start_offset, end_offset, metadata, and row_group_bytes) for all row groups.
If any row group is missing required metadata, this function will raise an error
indicating that the dataset needs to be re-indexed.
This function eliminates all metadata API calls by using prefetched metadata from
the /datasets/items-with-metadata endpoint.
This function imports the implementation from job2 at runtime,
similar to how read_parquet_row_group works.
**Parameters:**
- **dataset_path** (`str`) – Path to the H3-indexed dataset (e.g., "s3://bucket/dataset/")
- **hex_ranges_list** (`List\[List[int]\]`) – List of [min_hex, max_hex] pairs as integers.
Example: \[[622236719905341439, 622246719905341439]\]
- **columns** (`Optional\[List[str]\]`) – Optional list of column names to read. If None, reads all columns.
- **base_url** (`Optional[str]`) – Base URL for API. If None, uses current environment.
- **verbose** (`bool`) – If True, print progress information. Default is False.
- **return_timing_info** (`bool`) – If True, return a tuple of (table, timing_info) instead of just the table.
Default is False for backward compatibility.
- **batch_size** (`Optional[int]`) – Target size in bytes for combining row groups. If None, uses
`fused.options.row_group_batch_size` (default: 32KB).
- **max_concurrent_downloads** (`Optional[int]`) – Maximum number of simultaneous download operations. If None,
uses a default based on the number of files. Default is None.
**Returns:**
- `'pa.Table' | tuple\'pa.Table', [Dict\[str, Any\]\]` – PyArrow Table containing the concatenated data from all matching row groups.
- `'pa.Table' | tuple\'pa.Table', [Dict\[str, Any\]\]` – If return_timing_info is True, returns a tuple of (table, timing_info dict).
**Raises:**
- `ValueError` – If any row group is missing required metadata (start_offset, end_offset,
metadata, or row_group_bytes). This indicates the dataset needs to be re-indexed.
**Example:**
```python
# Read data for a specific H3 hex range
table = fused.h3.read_hex_table(
dataset_path="s3://my-bucket/my-h3-dataset/",
hex_ranges_list=[[622236719905341439, 622246719905341439]]
)
df = table.to_pandas()
```
---
## read_hex_table_slow
```python
read_hex_table_slow(
dataset_path: str,
hex_ranges_list: List[List[int]],
columns: Optional[List[str]] = None,
base_url: Optional[str] = None,
verbose: bool = False,
return_timing_info: bool = False,
metadata_batch_size: int = 50,
) -> "pa.Table" | tuple["pa.Table", Dict[str, Any]]
```
Read data from an H3-indexed dataset by querying hex ranges.
This function queries the dataset index for row groups that match the given
H3 hex ranges, downloads them in parallel with optimized batching, and returns
a concatenated table.
Adjacent row groups from the same file are combined into single downloads
for better S3 performance. The batch size is controlled by
`fused.options.row_group_batch_size` (default: 32KB).
**Parameters:**
- **dataset_path** (`str`) – Path to the H3-indexed dataset (e.g., "s3://bucket/dataset/")
- **hex_ranges_list** (`List\[List[int]\]`) – List of [min_hex, max_hex] pairs as integers.
Example: \[[622236719905341439, 622246719905341439]\]
- **columns** (`Optional\[List[str]\]`) – Optional list of column names to read. If None, reads all columns.
- **base_url** (`Optional[str]`) – Base URL for API. If None, uses current environment.
- **verbose** (`bool`) – If True, print progress information. Default is False.
- **return_timing_info** (`bool`) – If True, return a tuple of (table, timing_info) instead of just the table.
Default is False for backward compatibility.
- **metadata_batch_size** (`int`) – Maximum number of row group metadata requests to batch together
in a single API call. Larger batches reduce API overhead. Default is 50.
Consider MongoDB's 16KB document limit when adjusting this value.
**Returns:**
- `'pa.Table' | tuple\'pa.Table', [Dict\[str, Any\]\]` – PyArrow Table containing the concatenated data from all matching row groups.
- `'pa.Table' | tuple\'pa.Table', [Dict\[str, Any\]\]` – If return_timing_info is True, returns a tuple of (table, timing_info dict).
**Example:**
```python
# Read data for a specific H3 hex range
table = fused.h3.read_hex_table_slow(
dataset_path="s3://my-bucket/my-h3-dataset/",
hex_ranges_list=[[622236719905341439, 622246719905341439]]
)
df = table.to_pandas()
```
---
## read_hex_table_with_persisted_metadata
```python
read_hex_table_with_persisted_metadata(
dataset_path: str,
hex_ranges_list: List[List[int]],
columns: Optional[List[str]] = None,
metadata_path: Optional[str] = None,
verbose: bool = False,
return_timing_info: bool = False,
batch_size: Optional[int] = None,
max_concurrent_downloads: Optional[int] = None,
max_concurrent_metadata_reads: Optional[int] = None,
) -> "pa.Table" | tuple["pa.Table", Dict[str, Any]]
```
Read data from an H3-indexed dataset using persisted metadata parquet.
This function reads from per-file metadata parquet files instead of
querying a server. Each source parquet file has a corresponding
.metadata.parquet file stored at:
\/.fused/\.metadata.parquet
Or at the specified metadata_path if provided:
\/\.metadata.parquet
Supports subdirectory queries - if dataset_path points to a subdirectory,
the function will look for metadata files for files in that subdirectory.
**Parameters:**
- **dataset_path** (`str`) – Path to the H3-indexed dataset (e.g., "s3://bucket/dataset/")
Can also be a subdirectory path for filtering (e.g., "s3://bucket/dataset/year=2024/")
- **hex_ranges_list** (`List\[List[int]\]`) – List of [min_hex, max_hex] pairs as integers.
Example: \[[622236719905341439, 622246719905341439]\]
- **columns** (`Optional\[List[str]\]`) – Optional list of column names to read. If None, reads all columns.
- **metadata_path** (`Optional[str]`) – Directory path where metadata files are stored.
If None, looks for metadata at \/.fused/ for each source file.
If provided, reads metadata files from this location using full source paths.
This allows reading metadata from a different location when
you don't have access to the original dataset directory.
- **verbose** (`bool`) – If True, print progress information. Default is False.
- **return_timing_info** (`bool`) – If True, return a tuple of (table, timing_info) instead of just the table.
Default is False for backward compatibility.
- **batch_size** (`Optional[int]`) – Target size in bytes for combining row groups. If None, uses
`fused.options.row_group_batch_size` (default: 32KB).
- **max_concurrent_downloads** (`Optional[int]`) – Maximum number of simultaneous download operations. If None,
uses a default based on the number of files. Default is None.
- **max_concurrent_metadata_reads** (`Optional[int]`) – Maximum number of simultaneous metadata file reads. If None,
defaults to min(10, len(source_files)).
**Returns:**
- `'pa.Table' | tuple\'pa.Table', [Dict\[str, Any\]\]` – PyArrow Table containing the concatenated data from all matching row groups.
- `'pa.Table' | tuple\'pa.Table', [Dict\[str, Any\]\]` – If return_timing_info is True, returns a tuple of (table, timing_info dict).
**Raises:**
- `FileNotFoundError` – If the metadata parquet file is not found.
- `ValueError` – If any row group is missing required metadata.
**Example:**
```python
# First, persist metadata (one-time operation)
fused.h3.persist_hex_table_metadata("s3://my-bucket/my-dataset/")
# Then read using persisted metadata (no server required)
table = fused.h3.read_hex_table_with_persisted_metadata(
dataset_path="s3://my-bucket/my-dataset/",
hex_ranges_list=[[622236719905341439, 622246719905341439]]
)
df = table.to_pandas()
# Read from subdirectory (filters by path prefix)
table = fused.h3.read_hex_table_with_persisted_metadata(
dataset_path="s3://my-bucket/my-dataset/year=2024/",
hex_ranges_list=[[622236719905341439, 622246719905341439]]
)
# Read with metadata in alternate location
table = fused.h3.read_hex_table_with_persisted_metadata(
dataset_path="s3://my-bucket/my-dataset/",
metadata_path="s3://my-bucket/metadata/",
hex_ranges_list=[[622236719905341439, 622246719905341439]]
)
```
---
## run_ingest_raster_to_h3
```python
run_ingest_raster_to_h3(
input_path: str | list[str],
output_path: str,
metrics: str | list[str] = "cnt",
res: int | None = None,
k_ring: int = 1,
res_offset: int = 1,
chunk_res: int | None = None,
file_res: int | None = None,
overview_res: list[int] | None = None,
overview_chunk_res: int | list[int] | None = None,
max_rows_per_chunk: int = 0,
include_source_url: bool = True,
target_chunk_size: int | None = None,
nodata: int | float | None = None,
debug_mode: bool = False,
remove_tmp_files: bool = True,
tmp_path: str | None = None,
overwrite: bool = False,
steps: list[str] | None = None,
extract_engine: str | None = None,
extract_max_workers: int = 256,
partition_engine: str | None = None,
partition_max_workers: int = 256,
overview_engine: str | None = None,
overview_max_workers: int = 256,
**kwargs: int
)
```
Run the raster to H3 ingestion process.
This process involves multiple steps:
- extract pixels values and assign to H3 cells in chunks (extract step)
- combine the chunks per partition (file) and prepare metadata (partition step)
- create the metadata `_sample` file and overviews files
**Parameters:**
- **input_path** (`str, list`) – Path(s) to the input raster data.
When this is a single path, the file is chunked up for processing
based on `target_chunk_size`. When this is a list of paths, each
file is processed as one chunk.
- **output_path** (`str`) – Path for the resulting Parquet dataset.
- **metrics** (`str or list of str`) – The metrics to compute per H3 cell.
Supported metrics are either "cnt" or a list containing any of
"avg", "min", "max", "stddev", "mode" (i.e. most common value),
and "sum".
- **res** (`int`) – The resolution of the H3 cells in the output data.
The pixel values are assigned to H3 cells at resolution
`res + res_offset` and then aggregated to `res`.
By default, this is inferred based on the resolution of the
input data ensuring the H3 cell size is close to the pixel size
(e.g. for a raster with pixel size of 30x30m, a resolution of 11
is inferred).
- **k_ring** (`int`) – The k-ring distance at resolution `res + res_offset`
to which the pixel value is assigned (in addition to the center
cell). Defaults to 1.
- **res_offset** (`int`) – Offset to child resolution (relative to `res`) at
which to assign the raw pixel values to H3 cells.
- **file_res** (`int`) – The H3 resolution to chunk the resulting files of the
Parquet dataset. By default will be inferred based on the target
resolution `res`. You can specify `file_res=-1` to have a single
output file.
- **chunk_res** (`int`) – The H3 resolution to chunk the row groups within
each file of the Parquet dataset (ignored when `max_rows_per_chunk`
is specified). By default will be inferred based on the target
resolution `res`.
- **overview_res** (`list of int`) – The H3 resolutions for which to create
overview files. By default, overviews are created for resolutions 3
to 7 (or capped at a lower value if the `res` of the output dataset
is lower).
- **overview_chunk_res** (`int or list of int`) – The H3 resolution(s) to chunk
the row groups within each overview file of the Parquet dataset. By
default, each overview file is chunked at the overview resolution
minus 5 (clamped between 0 and the `res` of the output dataset).
- **max_rows_per_chunk** (`int`) – The maximum number of rows per chunk in the
resulting data and overview files. If 0 (the default), `chunk_res`
and `overview_chunk_res` are used to determine the chunking.
- **include_source_url** (`bool`) – If True, include a `"source_url"` column in
the output dataset that contains a list of source URLs that
contributed data to each H3 cell. Defaults to True, set to False
to omit this column.
- **target_chunk_size** (`int`) – The approximate number of pixel values to
process per chunk in the first "extract" step. Defaults to
10,000,000 for ingesting a single file or a few files. If ingesting
more than 20 files, each file is processed as a single chunk by
default, but you can override this by specifying a specific
`target_chunk_size` value, or by specifying `target_chunk_size=0` to
always process each file as a single chunk.
- **nodata** (`int or float`) – By default, the "nodata" value indicated in the
raster metadata will be used to ignore pixels with this value when
ingesting the data. If this information is missing or wrong in the
raster metadata, you can override the value by specifying this
keyword.
- **debug_mode** (`bool`) – If True, run only the first two chunks for
debugging purposes. Defaults to False.
- **remove_tmp_files** (`bool`) – If True, remove the temporary files after
ingestion is complete. Defaults to True.
- **tmp_path** (`str`) – Optional path to use for the temporary files.
If specified, the extract step is skipped and it is assumed that
the temporary files are already present at this path.
- **overwrite** (`bool`) – If True, overwrite the output path if it already
exists, by first removing the existing content before writing the
new files. Defaults to False, in which case an error is raised if
the `output_path` is not empty.
- **steps** (`list of str`) – The processing steps to run. Can include
"extract", "partition", "metadata", and "overview". By default, all
steps are run.
- **extract_engine** (`str`) – The engine to use for the extract step.
By default, tries first with "realtime" and then falls back to "large".
- **extract_max_workers** (`int`) – The maximum number of workers to use for the extract step.
Defaults to 256.
- **partition_engine** (`str`) – The engine to use for the partition step.
By default, tries first with "realtime" and then falls back to "large".
- **partition_max_workers** (`int`) – The maximum number of workers to use for the partition step.
Defaults to 256.
- **overview_engine** (`str`) – The engine to use for the overview step.
By default, tries first with "realtime" and then falls back to "large".
- **overview_max_workers** (`int`) – The maximum number of workers to use for the overview step.
Defaults to 256.
The extract, partition and overview steps are run in parallel using
`fused.submit()`. By default, the function will first attempt to run this using
"realtime" instances, and retry any failed runs using "large" instances.
You can override this behavior by specifying the `engine`, `max_workers`,
`worker_concurrency`, etc parameters as additional
keyword arguments to this function (`**kwargs`). If you want to specify
those per step, use `extract_engine`, `partition_engine`, etc.
For example, to run everything locally on the same machine where this
function runs, use:
```
run_ingest_raster_to_h3(..., engine="local")
```
---
## run_partition_to_h3
```python
run_partition_to_h3(
input_path: str | list[str],
output_path: str,
metrics: str | list[str] = "cnt",
groupby_cols: list[str] = ["hex"],
data_cols: list[str] = ["data"],
window_cols: list[str] = ["hex"],
additional_cols: list[str] = [],
input_rows_are_counts: bool = True,
res: int | None = None,
chunk_res: int | None = None,
file_res: int | None = None,
overview_res: list[int] | None = None,
overview_chunk_res: int | list[int] | None = None,
max_rows_per_chunk: int = 0,
remove_tmp_files: bool = True,
overwrite: bool = False,
extract_kwargs: bool = ,
partition_kwargs: bool = ,
overview_kwargs: bool = ,
**kwargs: bool
)
```
Run the H3 partitioning process.
This pipeline assumes that the input data already has a `"hex"` column
with H3 cell IDs at the target resolution. It will then repartition
the data spatially and add overview files.
By default, it is assumed that each row in the input data has a `cnt` column
with counts of the raster pixel values (in the "data" column).
If your data already has actual statistics per H3 cell, you can set
`input_rows_are_counts=False`. If you then specify, for example, a metric
like "avg", it will take just take the average of the "data" column for each H3 cell.
At the target resolution, this will typically be a single row, not actually
further aggregating. For overview files, it will then create aggregated data.
**Parameters:**
- **input_path** (`str, list`) – Path(s) to the input data.
Can be a path to file or directory, or list of file paths). The
first step of the processing is parallelized per input file.
- **output_path** (`str`) – Path for the resulting Parquet dataset.
- **metrics** (`str or list of str`) – The metrics to compute per H3 cell.
Supported metrics are either "cnt" or a list containing any of
"avg", "min", "max", "stddev", and "sum".
- **groupby_cols** (`list`) – The columns indicating the groups for which
the aggregated metrics are calculated. By default, for the "cnt"
metric, this is the "hex" column, which is further combined with
the `data_cols` (by default "data"). For the default "cnt" metric,
this means counts are calculated (summed) per unique combination
of "hex" and "data".
For the other metrics, this should typically always be the "hex" column.
- **data_cols** (`list[str]`) – Value column names (default `["data"]`). For
"cnt", this column contains the categories that are counted and is
appended to the `GROUP BY` clause.
For non-"cnt" metrics, the list of columns that will be aggregated
according to the metrics (the result contains the cartesian product
of data columns and metrics, i.e. all `_` combinations).
- **window_cols** (`list`) – The columns for which to calculate total counts
over using a window function. This will add an additional column to
the output (one for each of the columns in this list) with the total
counts per unique value of the specified column.
By default, this is only done for the "hex" column.
This only applies when the "cnt" metric is specified.
- **additional_cols** (`list`) – Additional columns from the input data to
include in the output dataset. These columns are assumed to have a
unique value per group defined by the `groupby_cols`. If this is not
the case, the output will contain arbitrary values from one of the
rows in each group.
By default, this is empty.
This only applies when the "cnt" metric is specified.
- **res** (`int`) – The resolution at which to assign the pixel values to H3 cells.
- **file_res** (`int`) – The H3 resolution to chunk the resulting files of the
Parquet dataset. By default will be inferred based on the target
resolution `res`. You can specify `file_res=-1` to have a single
output file.
- **chunk_res** (`int`) – The H3 resolution to chunk the row groups within
each file of the Parquet dataset (ignored when `max_rows_per_chunk`
is specified). By default will be inferred based on the target
resolution `res`.
- **overview_res** (`list of int`) – The H3 resolutions for which to create
overview files. By default, overviews are created for resolutions 3
to 7 (or capped at a lower value if the `res` of the output dataset
is lower).
- **overview_chunk_res** (`int or list of int`) – The H3 resolution(s) to chunk
the row groups within each overview file of the Parquet dataset. By
default, each overview file is chunked at the overview resolution
minus 5 (clamped between 0 and the `res` of the output dataset).
- **max_rows_per_chunk** (`int`) – The maximum number of rows per chunk in the
resulting data and overview files. If 0 (the default), `chunk_res`
and `overview_chunk_res` are used to determine the chunking.
- **remove_tmp_files** (`bool`) – If True, remove the temporary files after
ingestion is complete. Defaults to True.
- **overwrite** (`bool`) – If True, overwrite the output path if it already
exists, by first removing the existing content before writing the
new files. Defaults to False, in which case an error is raised if
the `output_path` is not empty.
- **extract_kwargs** (`dict`) – Additional keyword arguments to pass to
`fused.submit` for the extract step.
- **partition_kwargs** (`dict`) – Additional keyword arguments to pass to
`fused.submit` for the partition step.
- **overview_kwargs** (`dict`) – Additional keyword arguments to pass to
`fused.submit` for the overview step.
See the docstring of `run_ingest_raster_to_h3` for more details on
the processing steps and how to configure the execution.
---
================================================================================
## fused.ingest
Path: python-sdk/api-reference/job.mdx
Status: UNLISTED
URL: https://docs.fused.io/python-sdk/api-reference/job
## `fused.ingest`
```python showLineNumbers
def ingest(
input: Union[str, Sequence[str], Path, gpd.GeoDataFrame],
output: Optional[str] = None,
*,
output_metadata: Optional[str] = None,
schema: Optional[Schema] = None,
file_suffix: Optional[str] = None,
load_columns: Optional[Sequence[str]] = None,
remove_cols: Optional[Sequence[str]] = None,
explode_geometries: bool = False,
drop_out_of_bounds: Optional[bool] = None,
partitioning_method: Literal["area", "length", "coords", "rows"] = "rows",
partitioning_maximum_per_file: Union[int, float, None] = None,
partitioning_maximum_per_chunk: Union[int, float, None] = None,
partitioning_max_width_ratio: Union[int, float] = 2,
partitioning_max_height_ratio: Union[int, float] = 2,
partitioning_force_utm: Literal["file", "chunk", None] = "chunk",
partitioning_split_method: Literal["mean", "median"] = "mean",
subdivide_method: Literal["area", None] = None,
subdivide_start: Optional[float] = None,
subdivide_stop: Optional[float] = None,
split_identical_centroids: bool = True,
target_num_chunks: int = 5000,
lonlat_cols: Optional[Tuple[str, str]] = None,
gdal_config: Union[GDALOpenConfig, Dict[str, Any], None] = None
) -> GeospatialPartitionJobStepConfig
```
Ingest a dataset into the Fused partitioned format.
**Arguments**:
- `input` - A GeoPandas `GeoDataFrame` or a path to file or files on S3 to ingest. Files may be Parquet or another geo data format.
- `output` - Location on S3 to write the `main` table to.
- `output_metadata` - Location on S3 to write the `fused` table to.
- `schema` - Schema of the data to be ingested. This is optional and will be inferred from the data if not provided.
- `file_suffix` - filter which files are used for ingestion. If `input` is a directory on S3, all files under that directory will be listed and used for ingestion. If `file_suffix` is not None, it will be used to filter paths by checking the trailing characters of each filename. E.g. pass `file_suffix=".geojson"` to include only GeoJSON files inside the directory.
- `load_columns` - Read only this set of columns when ingesting geospatial datasets. Defaults to all columns.
- `remove_cols` - The named columns to drop when ingesting geospatial datasets. Defaults to not drop any columns.
- `explode_geometries` - Whether to unpack multipart geometries to single geometries when ingesting geospatial datasets, saving each part as its own row. Defaults to `False`.
- `drop_out_of_bounds` - Whether to drop geometries outside of the expected WGS84 bounds. Defaults to True.
- `partitioning_method` - The method to use for grouping rows into partitions. Defaults to `"rows"`.
- `"area"`: Construct partitions where all contain a maximum total area among geometries.
- `"length"`: Construct partitions where all contain a maximum total length among geometries.
- `"coords"`: Construct partitions where all contain a maximum total number of coordinates among geometries.
- `"rows"`: Construct partitions where all contain a maximum number of rows.
- `partitioning_maximum_per_file` - Maximum value for `partitioning_method` to use per file. If `None`, defaults to _1/10th_ of the total value of `partitioning_method`. So if the value is `None` and `partitioning_method` is `"area"`, then each file will be have no more than 1/10th the total area of all geometries. Defaults to `None`.
- `partitioning_maximum_per_chunk` - Maximum value for `partitioning_method` to use per chunk. If `None`, defaults to _1/100th_ of the total value of `partitioning_method`. So if the value is `None` and `partitioning_method` is `"area"`, then each file will be have no more than 1/100th the total area of all geometries. Defaults to `None`.
- `partitioning_max_width_ratio` - The maximum ratio of width to height of each partition to use in the ingestion process. So for example, if the value is `2`, then if the width divided by the height is greater than `2`, the box will be split in half along the horizontal axis. Defaults to `2`.
- `partitioning_max_height_ratio` - The maximum ratio of height to width of each partition to use in the ingestion process. So for example, if the value is `2`, then if the height divided by the width is greater than `2`, the box will be split in half along the vertical axis. Defaults to `2`.
- `partitioning_force_utm` - Whether to force partitioning within UTM zones. If set to `"file"`, this will ensure that the centroid of all geometries per _file_ are contained in the same UTM zone. If set to `"chunk"`, this will ensure that the centroid of all geometries per _chunk_ are contained in the same UTM zone. If set to `None`, then no UTM-based partitioning will be done. Defaults to "chunk".
- `partitioning_split_method` - How to split one partition into children. Defaults to `"mean"` (this may change in the future).
- `"mean"`: Split each axis according to the mean of the centroid values.
- `"median"`: Split each axis according to the median of the centroid values.
- `subdivide_method` - The method to use for subdividing large geometries into multiple rows. Currently the only option is `"area"`, where geometries will be subdivided based on their area (in WGS84 degrees).
- `subdivide_start` - The value above which geometries will be subdivided into smaller parts, according to `subdivide_method`.
- `subdivide_stop` - The value below which geometries will never be subdivided into smaller parts, according to `subdivide_method`.
- `split_identical_centroids` - If `True`, should split a partition that has
identical centroids (such as if all geometries in the partition are the
same) if there are more such rows than defined in "partitioning_maximum_per_file" and
"partitioning_maximum_per_chunk".
- `target_num_chunks` - The target for the number of chunks if `partitioning_maximum_per_file` is None. Note that this number is only a _target_ and the actual number of files and chunks generated can be higher or lower than this number, depending on the spatial distribution of the data itself.
- `lonlat_cols` - Names of longitude, latitude columns to construct point geometries from.
If your point columns are named `"x"` and `"y"`, then pass:
```python showLineNumbers
fused.ingest(
...,
lonlat_cols=("x", "y")
)
```
This only applies to reading from Parquet files. For reading from CSV files, pass options to `gdal_config`.
- `gdal_config` - Configuration options to pass to GDAL for how to read these files. For all files other than Parquet files, Fused uses GDAL as a step in the ingestion process. For some inputs, like CSV files or zipped shapefiles, you may need to pass some parameters to GDAL to tell it how to open your files.
This config is expected to be a dictionary with up to two keys:
- `layer`: `str`. Define the layer of the input file you wish to read when the source contains multiple layers, as in GeoPackage.
- `open_options`: `Dict[str, str]`. Pass in key-value pairs with GDAL open options. These are defined on each driver's page in the GDAL documentation. For example, the CSV driver defines these open options you can pass in.
For example, if you're ingesting a CSV file with two columns
`"longitude"` and `"latitude"` denoting the coordinate information, pass
```python showLineNumbers
fused.ingest(
...,
gdal_config=
}
)
```
**Returns**:
Configuration object describing the ingestion process. Call `.run_batch` on this object to start a job.
**Examples**:
```python showLineNumbers
job = fused.ingest(
input="https://www2.census.gov/geo/tiger/TIGER_RD18/STATE/06_CALIFORNIA/06/tl_rd22_06_bg.zip",
output="s3://fused-sample/census/ca_bg_2022/main/",
output_metadata="s3://fused-sample/census/ca_bg_2022/fused/",
explode_geometries=True,
partitioning_maximum_per_file=2000,
partitioning_maximum_per_chunk=200,
).run_batch()
```
---
#### `job.run_batch`
`fused.ingest` returns a `GeospatialPartitionJobStepConfig` object. Call `.run_batch` on this object to start the ingestion job.
```python
def run_batch(output_table: Optional[str] = ...,
instance_type: Optional[WHITELISTED_INSTANCE_TYPES] = None,
*,
region: str | None = None,
disk_size_gb: int | None = None,
additional_env: List[str] | None = None,
image_name: Optional[str] = None,
ignore_no_udf: bool = False,
ignore_no_output: bool = False,
validate_imports: Optional[bool] = None,
validate_inputs: bool = True,
overwrite: Optional[bool] = None) -> RunResponse
```
Begin job execution.
**Arguments**:
- `output_table` - The name of the table to write to. Defaults to None.
- `instance_type` - The AWS EC2 instance type to use for the job. Acceptable strings are `m5.large`, `m5.xlarge`, `m5.2xlarge`, `m5.4xlarge`, `m5.8xlarge`, `m5.12xlarge`, `m5.16xlarge`, `r5.large`, `r5.xlarge`, `r5.2xlarge`, `r5.4xlarge`, `r5.8xlarge`, `r5.12xlarge`, or `r5.16xlarge`. Defaults to None.
- `region` - The AWS region in which to run. Defaults to None.
- `disk_size_gb` - The disk size to specify for the job. Defaults to None.
- `additional_env` - Any additional environment variables to be passed into the job. Defaults to None.
- `image_name` - Custom image name to run. Defaults to None for default image.
- `ignore_no_udf` - Ignore validation errors about not specifying a UDF. Defaults to False.
- `ignore_no_output` - Ignore validation errors about not specifying output location. Defaults to False.
## Monitor & manage job
Calling `.run_batch()` returns a `RunResponse` object which has the following methods:
#### `get_status`
```python
def get_status() -> RunResponse
```
Fetch the status of this job
**Returns**:
The status of the given job.
---
#### `print_logs`
```python
def print_logs(since_ms: Optional[int] = None,
file: Optional[IO] = None) -> None
```
Fetch and print logs
**Arguments**:
- `since_ms` - Timestamp, in milliseconds since epoch, to get logs for. Defaults to None for all logs.
- `file` - Where to print logs to. Defaults to sys.stdout.
**Returns**:
None
---
#### `get_exec_time`
```python
def get_exec_time() -> timedelta
```
Determine the execution time of this job, using the logs.
**Returns**:
Time the job took. If the job is in progress, time from first to last log message is returned.
---
#### `tail_logs`
```python
def tail_logs(refresh_seconds: float = 1,
sample_logs: bool = True,
timeout: Optional[float] = None,
get_logs_retries: int = 1) -> None
```
Continuously print logs
**Arguments**:
- `refresh_seconds` - how frequently, in seconds, to check for new logs. Defaults to 1.
- `sample_logs` - if true, print out only a sample of logs. Defaults to True.
- `timeout` - if not None, how long to continue tailing logs for. Defaults to None for indefinite.
- `get_logs_retries` - Number of additional retries for log requests. Defaults to 1.
---
#### `cancel`
```python
def cancel() -> RunResponse
```
Cancel this job
**Returns**:
A new job object.
================================================================================
## JobPool
Path: python-sdk/api-reference/jobpool.mdx
URL: https://docs.fused.io/python-sdk/api-reference/jobpool
## JobPool
The `JobPool` class is used to manage, inspect and retrieve results from
submitted jobs from `fused.submit()`.
### all_succeeded
```python
all_succeeded() -> bool
```
True if all tasks finished with success
---
### any_failed
```python
any_failed() -> bool
```
True if any task finished with an error
---
### any_succeeded
```python
any_succeeded() -> bool
```
True if any task finished with success
---
### arg_df
```python
arg_df()
```
The arguments passed to runs as a DataFrame
---
### cancel
```python
cancel(wait: bool = False)
```
Cancel any pending (not running) tasks.
Note it will not be possible to retry on the same JobPool later.
---
### cancelled
```python
cancelled() -> dict[int, Any]
```
Retrieve the arguments that were cancelled and not run.
---
### collect
```python
collect(
ignore_exceptions: bool = False,
flatten: bool = True,
drop_index: bool = False,
verbose: bool = True,
log_timeout: float | None = None,
)
```
Collect all results into a DataFrame
---
### df
```python
df(
ignore_exceptions: bool = False,
flatten: bool = True,
drop_index: bool = False,
verbose: bool = True,
log_timeout: float | None = None,
) -> pd.DataFrame
```
Collect all results into a DataFrame
---
### done
```python
done() -> bool
```
True if all tasks have finished, regardless of success or failure.
---
### errors
```python
errors() -> dict[int, Exception]
```
Retrieve the results that are currently done and are errors.
Results are indexed by position in the args list.
---
### first_error
```python
first_error() -> Exception | None
```
Retrieve the first (by order of arguments) error result, or None.
---
### first_log
```python
first_log() -> str | None
```
Retrieve the first (by order of arguments) logs, or None.
---
### logs
```python
logs() -> list[str | None]
```
Logs for each task.
Incomplete tasks will be reported as None.
---
### logs_df
```python
logs_df(
status_column: str | None = "status",
result_column: str | None = "result",
time_column: str | None = "time",
logs_column: str | None = "logs",
exception_column: str | None = None,
include_exceptions: bool = True,
) -> pd.DataFrame
```
Get a DataFrame of results as they are currently.
The DataFrame will have columns for each argument passed, and columns for:
`status`, `result`, `time`, `logs` and optionally `exception`.
---
### pending
```python
pending() -> dict[int, Any]
```
Retrieve the arguments that are currently pending and not yet submitted.
---
### results
```python
results(return_exceptions = False) -> list[Any]
```
Retrieve all results of the job.
Results are ordered by the order of the args list.
---
### results_now
```python
results_now(return_exceptions = False) -> dict[int, Any]
```
Retrieve the results that are currently done.
Results are indexed by position in the args list.
---
### retry
```python
retry()
```
Rerun any tasks in error or timeout states. Tasks are rerun in the same pool.
---
### running
```python
running() -> dict[int, Any]
```
Retrieve the results that are currently running.
---
### status
```python
status()
```
Return a Series indexed by status of task counts
---
### success
```python
success() -> dict[int, Any]
```
Retrieve the results that are currently done and are successful.
Results are indexed by position in the args list.
---
### tail
```python
tail(stop_on_exception = False, timeout: float | None = None)
```
Wait until all jobs are finished, printing statuses as they become available.
This is useful for interactively watching for the state of the pool.
Use pool.\_wait_sleep to set if sleep should occur while waiting.
If `timeout` is None and this runs inside a realtime instance, it defaults
to 90 seconds. Otherwise `None` means no time limit. On timeout, prints
any errors for completed failures and a list of args for jobs that did not
succeed (pending, running, or errored) for reuse in a new submit, then raises
`TimeoutError`.
---
### times
```python
times() -> list[timedelta | None]
```
Time taken for each task.
Incomplete tasks will be reported as None.
---
### total_time
```python
total_time(since_retry: bool = False) -> timedelta
```
Returns how long the entire job took.
If only partial results are available, returns based on the last task to have been completed.
---
### wait
```python
wait()
```
Wait until all jobs are finished
Use fused.options.show.enable_tqdm to enable/disable tqdm.
Use pool.\_wait_sleep to set if sleep should occur while waiting.
---
## AsyncJobPool
`AsyncJobPool` is returned by `udf.map_async()`.
It inherits all `JobPool` methods and adds async counterparts for each one.
### errors_async
```python
errors_async() -> dict[int, Exception]
```
Async version of errors that doesn't block the event loop
---
### first_error_async
```python
first_error_async() -> Exception | None
```
Async version of first_error that doesn't block the event loop
---
### first_log_async
```python
first_log_async() -> str | None
```
Async version of first_log that doesn't block the event loop
---
### logs_async
```python
logs_async() -> list[str | None]
```
Async version of logs that doesn't block the event loop
---
### logs_df_async
```python
logs_df_async(
status_column: str | None = "status",
result_column: str | None = "result",
time_column: str | None = "time",
logs_column: str | None = "logs",
exception_column: str | None = None,
include_exceptions: bool = True,
) -> pd.DataFrame
```
Async version of logs_df() that doesn't block the event loop
---
### results_async
```python
results_async(return_exceptions = False) -> list[Any]
```
Async version of results that assumes waiting has already been done
---
### results_now_async
```python
results_now_async(return_exceptions = False) -> dict[int, Any]
```
Async version of results_now that doesn't block the event loop
---
### success_async
```python
success_async() -> dict[int, Any]
```
Async version of success that doesn't block the event loop
---
### tail_async
```python
tail_async(stop_on_exception = False, timeout: float | None = None)
```
Async version of tail that doesn't block the event loop
---
================================================================================
## fused.options
Path: python-sdk/api-reference/options.mdx
URL: https://docs.fused.io/python-sdk/api-reference/options
## fused.options
List global configuration options.
This object contains a set of configuration options that control global behavior of the library. This object can be used to modify the options.
**Examples:**
Change the `request_timeout` option from its default value to 60 seconds:
```py
fused.options.request_timeout = 60
```
## Options
### __dir__
```python
__dir__() -> List[str]
```
### base_url
```python
base_url: str = PROD_DEFAULT_BASE_URL
```
Fused API endpoint
### shared_udf_base_url
```python
shared_udf_base_url: str = PROD_SHARED_UDF_DEFAULT_BASE_URL
```
Shared UDF API endpoint
### auth
```python
auth: AuthOptions = Field(default_factory=AuthOptions)
```
Options for authentication.
### show
```python
show: ShowOptions = Field(default_factory=ShowOptions)
```
Options for object reprs and how data are shown for debugging.
### max_workers
```python
max_workers: int = 16
```
Maximum number of threads, when multithreading requests
### run_timeout
```python
run_timeout: float = 130
```
Request timeout for UDF run requests to the Fused service
### request_timeout
```python
request_timeout: Union[Tuple[float, float], float, None] = 5
```
Request timeout for the Fused service
May be set to a tuple of connection timeout and read timeout
### metadata_request_timeout
```python
metadata_request_timeout: float = 60.0
```
Request timeout for file metadata requests (e.g., /file-metadata endpoint).
These requests may involve processing large parquet files and can take longer.
### request_max_retries
```python
request_max_retries: int = 5
```
Maximum number of retries for API requests
### request_retry_base_delay
```python
request_retry_base_delay: float = 1.0
```
Base delay before retrying a API request in seconds
### realtime_client_id
```python
realtime_client_id: Optional[StrictStr] = None
```
Client ID for realtime service.
### job_id
```python
job_id: Optional[StrictStr] = None
```
ID of the job being executed (set by job2 when running in job context).
### max_recursion_factor
```python
max_recursion_factor: int = 5
```
Maximum recursion factor for UDFs. This is used to limit the number of
recursive calls to UDFs. If a UDF exceeds this limit, an error will be raised.
### save_user_settings
```python
save_user_settings: StrictBool = True
```
Save per-user settings such as credentials and environment IDs.
### default_udf_run_engine
```python
default_udf_run_engine: Optional[StrictStr] = None
```
Default engine to run UDFs, one of: "local" or "remote".
### prompt_to_login
```python
prompt_to_login: StrictBool = False
```
Automatically prompt the user to login when importing Fused.
### no_login
```python
no_login: StrictBool = False
```
If set, Fused will not attempt to login automatically when needed.
### pyodide_async_requests
```python
pyodide_async_requests: StrictBool = False
```
If set, Fused is being called inside Pyodide and should use pyodide
for async HTTP requests.
### cache_directory
```python
cache_directory: Path | None = None
```
The base directory for storing cached results.
### data_directory
```python
data_directory: Path = None
```
The base directory for storing data results. Note: if storage type is 'object', then this path is relative to
fd_prefix.
### temp_directory
```python
temp_directory: Path = Path(tempfile.gettempdir())
```
The base directory for storing temporary files.
### never_import
```python
never_import: StrictBool = False
```
Never import UDF code when loading UDFs.
### gcs_secret
```python
gcs_secret: str = 'gcs_fused'
```
Secret name for GCS credentials.
### gcs_filename
```python
gcs_filename: str = '/tmp/.gcs.fused'
```
Filename for saving temporary GCS credentials to locally or in rt2 instance
### gcp_project_name
```python
gcp_project_name: Optional[StrictStr] = None
```
Project name for GCS to use for GCS operations.
### logging
```python
logging: StrictBool = Field(default=False, validate_default=True)
```
Control logging for Fused
### verbose_udf_runs
```python
verbose_udf_runs: StrictBool = False
```
Whether to print logs from UDF runs by default
### default_run_headers
```python
default_run_headers: Optional[Dict[str, str]] =
```
(Advanced) Default headers to include with UDF run requests.
### fused_cache_disable_stream
```python
fused_cache_disable_stream: StrictBool = True
```
When true (default), realtime UDF requests include the
fused_cache_disable_stream query parameter so the server does not stream from cache.
### default_dtype_out_vector
```python
default_dtype_out_vector: StrictStr = 'parquet'
```
Default transfer type for vector (tabular) data
### default_dtype_out_raster
```python
default_dtype_out_raster: StrictStr = 'npy,tiff'
```
Default transfer type for raster data
### default_dtype_out_simple
```python
default_dtype_out_simple: StrictStr = 'json'
```
Default transfer type for simple Python data (bool, int, float, str, list)
### fd_prefix
```python
fd_prefix: Optional[str] = None
```
If set, where fd:// scheme URLs will resolve to. By default will infer this from your user account.
### verbose_cached_functions
```python
verbose_cached_functions: StrictBool = True
```
Whether to print logs from cache decorated functions by default
### local_engine_cache
```python
local_engine_cache: StrictBool = True
```
Enable UDF cache with local engine
### default_send_status_email
```python
default_send_status_email: StrictBool = True
```
Whether to send a status email to the user when a job is complete.
### cache_storage
```python
cache_storage: StorageStr = 'auto'
```
Specify the default cache storage type
### use_process_pool_for_local_submit
```python
use_process_pool_for_local_submit: StrictBool = False
```
Use ProcessPoolExecutor instead of ThreadPoolExecutor for local engine submit.
This avoids GDAL thread-safety issues and Python GIL limitations, but has higher
memory overhead and slower startup time.
### row_group_batch_size
```python
row_group_batch_size: int = 32768
```
Target size in bytes for combining adjacent row group downloads.
Adjacent row groups from the same file will be combined into single downloads
until this threshold is reached. Default is 32KB (32768 bytes), which is
optimized for S3 performance.
### cache_decorator_max_age
```python
cache_decorator_max_age: int = 60 * 60 * 48
```
Default max age for cache decorated functions. Accepts duration strings like
"12h", "30m", "7d", or integer seconds.
### default_conflict_overwrite_choice
```python
default_conflict_overwrite_choice: str = 'no'
```
Default choice for conflict overwrite when pulling a canvas. Accepts yes/no/diff/all/quit (case-insensitive).
### base_web_url
```python
base_web_url
```
### save
```python
save()
```
Save Fused options to `~/.fused/settings.toml`. They will be automatically
reloaded the next time fused-py is imported.
================================================================================
## Udf
Path: python-sdk/api-reference/udf.mdx
URL: https://docs.fused.io/python-sdk/api-reference/udf
## Udf
The `Udf` class is the object you get when defining a UDF with the
`@fused.udf` decorator, or when loading
a saved UDF with `fused.load()`.
### cache_max_age
```python
cache_max_age: int | None = None
```
The maximum age when returning a result from the cache.
---
### catalog_url
```python
catalog_url: str | None
```
Returns the link to open this UDF in the Workbench Catalog, or None if the UDF is not saved.
---
### create_access_token
```python
create_access_token(
*,
client_id: str | Ellipsis | None = ...,
public_read: bool | None = None,
access_scope: str | None = None,
cache: bool = True,
metadata_json: dict[str, Any] | None = None,
enabled: bool = True
) -> UdfAccessToken
```
Create a UDF access token (share token) for this UDF.
**Parameters:**
- **client_id** (`str | Ellipsis | None`) – The client ID to use for the access token. (Default: detect automatically)
- **public_read** (`bool | None`) – Whether the access token should have public read access. (Default: off)
- **access_scope** (`str | None`) – The access scope to use for the access token. (Default: world)
- **cache** (`bool`) – Whether to enable caching on the access token. (Default True)
- **metadata_json** (`dict[str, Any] | None`) – Additional metadata to serve as part of the tiles metadata.json. (Default None)
- **enabled** (`bool`) – Whether the access token is enabled. (Default True)
---
### delete_saved
```python
delete_saved(inplace: bool = True)
```
Delete this UDF from the Fused service.
**Parameters:**
- **inplace** (`bool`) – If True, modify the UDF metadata in place. (Default True)
If False, return a new UDF object with the metadata removed.
---
### disk_size_gb
```python
disk_size_gb: int | None = None
```
The size of the disk in GB to use for remote execution.
Used in batch jobs.
---
### engine
```python
engine: str | None = None
```
The engine to run this UDF on by default, if not specified in
`fused.run()`, e.g., "small"/"medium"/"large".
---
### entrypoint
```python
entrypoint: str
```
Name of the function within the code to invoke.
---
### eval_schema
```python
eval_schema(inplace: bool = False) -> Udf
```
Reload the schema saved in the code of the UDF.
Note that this will evaluate the UDF function.
**Parameters:**
- **inplace** (`bool`) – If True, update this UDF object. Otherwise return a new UDF object (default).
Deprecated: Do not call this.
---
### from_gist
```python
from_gist(gist_id: str)
```
Create a Udf from a GitHub gist.
---
### get_access_token
```python
get_access_token() -> UdfAccessToken | None
```
Get a UDF access token (share token) for this UDF, or None if no token exists.
---
### get_access_tokens
```python
get_access_tokens() -> UdfAccessTokenList
```
Get all UDF access tokens (share tokens) for this UDF.
---
### get_canvas_share_token
```python
get_canvas_share_token() -> str
```
Get the canvas share token (`fc_...`) for the UDF's collection.
---
### get_schedule
```python
get_schedule() -> CronJobSequence
```
Retrieve any scheduled runs of this UDF
---
### invalidate_cache
```python
invalidate_cache(
*, z: int | None = None, x: int | None = None, y: int | None = None
)
```
Invalidate the result cache for this UDF.
---
### map
```python
map(
arg_list: list[Any] | pd.DataFrame,
*,
engine: Engine | None = None,
max_workers: int | None = None,
worker_concurrency: int | None = None,
max_retry: int = 2,
debug_mode: bool = False,
cache_max_age: str | None = None,
run_cache_max_age: str | int | None = None,
cache: bool = True,
_before_run: float | None = None,
_before_submit: float | None = 0.01,
_isolate_streams: bool = True,
**kwargs: bool
) -> "JobPool"
```
Submit a job for each element in arg_list.
**Parameters:**
- **arg_list** (`list[Any] | pd.DataFrame`) – A list of arguments to pass to the UDF. Each element
in arg_list will become a job and run.
- **engine** (`Engine | None`) – The engine to use for execution.
"remote": Run on a realtime instance. (Default)
"local": Run locally.
"small", "medium", "large": Run on a batch instance.
Other values will be interpreted as a batch instance type.
- **max_workers** (`int | None`) – The maximum number of workers to use.
For running on realtime instances, this is the number of
instances to use. (Default 32)
For running locally, this is the number of threads to use.
(Default 1)
For running on batch instances, this is the number of worker
machines to use. (Default 1)
- **worker_concurrency** (`int | None`) – The concurrency level for each worker.
For running on realtime instances, this is the number of
arguments to run in each instance at a time. (Default 1)
For running locally, this cannot be set.
For running on batch instances, this is the number of processes
to use in each worker machine. (Default based on the number of
cores in the machine.)
- **max_retry** (`int`) – The maximum number of retries for failed jobs. (Default 2)
Note that retries will only be attempted if the object is waited on,
e.g. with `pool.wait()`, `pool.tail()`, or `pool.df()`.
- **debug_mode** (`bool`) – If True, executes only the first item in arg_list directly using
`fused.run()`, useful for debugging UDF execution. Default is False.
- **cache_max_age** (`str | None`) – The maximum age when returning a result from the cache.
Supported units are seconds (s), minutes (m), hours (h), and days (d) (e.g. “48h”, “10s”, etc.).
Default is `None` so a UDF will follow `cache_max_age` defined in `@fused.udf()` unless this value is changed.
- **run_cache_max_age** (`str | int | None`) – When set, wraps each inner `fused.run` with `fused.cache` so
cache hits skip the HTTP round-trip (client-side disk cache). Uses the same
`cache_reset`, `cache_storage`, and `cache_verbose` as the submit-level cache.
- **cache** (`bool`) – Set to False as a shortcut for `cache_max_age='0s'` to disable caching. (Default True)
- \*\***kwargs** – Additional (constant) keyword arguments to pass to the UDF.
**Returns:**
- `'JobPool'` – A JobPool object. Call `.df()` to get the results.
For remote runs (default or ``engine="remote"``) without ``worker_concurrency``,
an asyncio-based pool is used. Local runs and batch instance types still use a
thread (or process) pool where appropriate.
**Example:**
```python
@fused.udf()
def my_udf(x: int):
return x + 1
pool = my_udf.map([1, 2, 3])
results = pool.df()
print(results)
# [2, 3, 4]
```
---
### map_async
```python
map_async(
arg_list,
*,
engine: Engine | None = None,
max_workers: int | None = None,
cache_max_age: str | None = None,
cache: bool = True,
max_retry: int = 2
) -> "JobPool"
```
Submit a job for each element in arg_list.
.. deprecated::
`map_async` is deprecated. Use :meth:`map` instead; for remote runs
without `worker_concurrency`, :meth:`map` already uses the same
asyncio-based execution path.
**Parameters:**
- **arg_list** – A list of arguments to pass to the UDF. Each element
in arg_list will become a job and run.
- **engine** (`Engine | None`) – The engine to use for execution.
"remote": Run on a realtime instance. (Default)
"local": Run locally.
Note: batch instance types are not supported for async map.
- **max_workers** (`int | None`) – The maximum number of workers to use.
For running on realtime instances, this is the number of
instances to use. (Default 32)
For running locally, this is the number of threads to use.
(Default 1)
- **cache_max_age** (`str | None`) – The maximum age when returning a result from the cache.
Supported units are seconds (s), minutes (m), hours (h), and days (d) (e.g. “48h”, “10s”, etc.).
Default is `None` so a UDF will follow `cache_max_age` defined in `@fused.udf()` unless this value is changed.
- **cache** (`bool`) – Set to False as a shortcut for `cache_max_age='0s'` to disable caching. (Default True)
- **max_retry** (`int`) – The maximum number of retries for failed jobs. (Default 2)
Note that retries will only be attempted if the object is waited on,
e.g. with `pool.wait()`, `pool.tail()`, or `pool.df()`.
Note worker_concurrency is not supported for async map.
**Returns:**
- `'JobPool'` – An AsyncJobPool object. Call `.df()` to get the results.
**Example:**
```python
@fused.udf()
def my_udf(x: int):
return x + 1
pool = my_udf.map([1, 2, 3])
results = pool.df()
print(results)
# [2, 3, 4]
```
---
### parameters
```python
parameters: dict[str, Any] = Field(default_factory=dict)
```
Parameters to pass into the entrypoint.
---
### region
```python
region: str | None = None
```
The region to use for remote execution. Used in batch jobs.
---
### run_local
```python
run_local(*, inplace: bool = False, **kwargs: bool) -> UdfEvaluationResult
```
Evaluate this UDF against a sample.
**Parameters:**
- **inplace** (`bool`) – If True, update this UDF object with schema information. (default)
Deprecated: Call the UDF instead.
---
### schedule
```python
schedule(
minute: list[int] | int,
hour: list[int] | int,
day_of_month: list[int] | int | None = None,
month: list[int] | int | None = None,
day_of_week: list[int] | int | None = None,
udf_args: dict[str, Any] | None = None,
enabled: bool = True,
_create_udf: bool = True,
**kwargs: bool
) -> CronJob
```
Schedule this UDF to run on a cron schedule.
**Parameters:**
- **minute** (`list[int] | int`) – The minute to run the UDF on.
- **hour** (`list[int] | int`) – The hour to run the UDF on.
- **day_of_month** (`list[int] | int | None`) – The day of the month to run the UDF on. (Default every day)
- **month** (`list[int] | int | None`) – The month to run the UDF on. (Default every month)
- **day_of_week** (`list[int] | int | None`) – The day of the week to run the UDF on. (Default every day)
- **udf_args** (`dict[str, Any] | None`) – The arguments to pass to the UDF. (Default None)
- **enabled** (`bool`) – Whether the cron job is enabled. (Default True)
- **\_create_udf** (`bool`) – Save the UDF to Fused before creating the CronJob. (Default True)
---
### set_parameters
```python
set_parameters(
parameters: dict[str, Any],
replace_parameters: bool = False,
inplace: bool = False,
) -> Udf
```
Set the parameters on this UDF.
**Parameters:**
- **parameters** (`dict[str, Any]`) – The new parameters dictionary.
- **replace_parameters** (`bool`) – If True, unset any parameters not in the parameters argument. Defaults to False.
- **inplace** (`bool`) – If True, modify this object. If False, return a new object. Defaults to True.
Deprecated: Set parameters when calling the UDF or using `UDF.map()` instead.
---
### shared_url
```python
shared_url(format: str | None = None) -> str | None
```
Get the shared URL for this UDF.
**Parameters:**
- **format** (`str | None`) – The result format (file type) for the URL. (Default None)
---
### to_directory
```python
to_directory(where: str | Path | None = None, *, overwrite: bool = False)
```
Write the UDF to disk as a directory (folder).
**Parameters:**
- **where** (`str | Path | None`) – A path to a directory. If not provided, uses the UDF function name.
**Other Parameters:**
- **overwrite** (`bool`) – If true, overwriting is allowed.
---
### to_file
```python
to_file(where: str | Path | BinaryIO, *, overwrite: bool = False)
```
Write the UDF to disk or the specified file-like object.
The UDF will be written as a Zip file.
**Parameters:**
- **where** (`str | Path | BinaryIO`) – A path to a file or a file-like object.
**Other Parameters:**
- **overwrite** (`bool`) – If true, overwriting is allowed.
---
### to_fused
```python
to_fused(
*,
overwrite: bool | None = None,
collection_name: str | None = None,
create_collection: bool = False,
**kwargs: dict[str, Any]
)
```
Save this UDF on the Fused service.
**Parameters:**
- **overwrite** (`bool | None`) – If True, overwrite existing remote UDF with the UDF object.
- **collection_name** (`str | None`) – The collection name to associate with this UDF. If not provided,
falls back to the collection of the currently executing UDF, or defaults to "default".
- **create_collection** (`bool`) – If True, create a new collection if it doesn't exist.
---
================================================================================
## Batch jobs
Path: python-sdk/batch.mdx
Status: UNLISTED
URL: https://docs.fused.io/python-sdk/batch
This guide shows how to execute a batch job with fused-py from a Jupyter Notebook. It was inspired by a Discord community request.
Running long processes can be computationally expensive, or liable to interruptions from network disconnections. For these cases, `fused-py` can run batch jobs on an EC2 instance.
To illustrate, this guide shows how to trigger and monitor a batch job from a Jupyter Notebook to unzip a large file and upload it to S3.
This UDF downloads a zipped file from S3 file specified with `source_s3_path`, unzips it, then uploads it to the S3 path specified by `destination_s3_path`.
## 1. Define UDF
This UDF downloads a zipped file with `fused.download`, unzips it, and uploads the extracted files to the `destination_s3_path`. For simplicity, you may choose to write to your Fused S3 bucket path which you can find in your Workbench File Explorer - otherwise, you might need to adjust permissions of the target bucket.
```python showLineNumbers
@fused.udf
def udf(
source_s3_path = '',
destination_s3_path = ''
):
file_path = fused.download(source_s3_path, source_s3_path.split('/')[-1])
# Create a temporary directory to extract the files
s3 = s3fs.S3FileSystem()
with zipfile.ZipFile(file_path, 'r') as zip_ref:
zip_ref.extractall('/tmp/unzipped_files')
# Upload each file to the S3 bucket
for root, dirs, files in os.walk('/tmp/unzipped_files'):
for file in files:
file_path = os.path.join(root, file)
print('file_path', file_path, destination_s3_path)
s3.put(file_path, destination_s3_path)
return pd.DataFrame() # UDFs must return a table or raster
```
## 2. Run UDF on an offline instance
To go beyond the 120s limit of the default `fused.run(udf)` call we'll define a job and use `job.run_batch()` to kick off a call on a large, offline instance.
Get in touch with Fused if your account doesn't have batch-mode enabled.
Note: Make sure to replace `` with your own directory.
```python showLineNumbers
job = udf(
source_s3_path = 'https://datadownload-production.s3.amazonaws.com/WCMC_carbon_tonnes_per_ha.zip',
destination_s3_path = 's3://fused-users/fused//dswid/WCMC_carbon_tonnes_per_ha_10gb/'
)
job_id = job.run_batch()
```
## 3. Monitor job
`job_id` has a number of methods to monitor the job. For example `job_tail_logs` streams logs as the job runs.
```python showLineNumbers
fused.api.job_tail_logs("df335890-4406-4832-bf93-6a3b092e496d")
```
================================================================================
## Changelog
Path: python-sdk/changelog.mdx
URL: https://docs.fused.io/python-sdk/changelog
# Changelog
## v2.8.5 (2026-08-18)
**Embedded Workbench for fused-render**
Canvases opened from fused-render now embed a fully authenticated Workbench editor directly in the app instead of a separate browser tab.
**Bug fixes**
- Fixed: `fused canvas pull` no longer treats the seeded `CLAUDE.md` and `.fusedignore` files as deletions or diffs
- Fixed: a crash on the UDF logs page
## v2.8.4 (2026-07-21)
**Bug fixes**
- Fixed: `fused.cache` now surfaces the real error to concurrent waiters instead of a generic failure
- Fixed: requesting a missing collection now returns a clear HTTP error instead of a server error
## v2.8.3 (2026-06-29)
**Improvements**
- UDF `.json` files now support JSON5, so you can use comments and trailing commas in your UDF configuration
- Canvas: App nodes now show a clear status message instead of a generic "Running UDF"
**Bug fixes**
- Fixed: your session token no longer affects the UDF cache key, so cached results are reused as expected
- Fixed: stale state in the UDF collections toolbar
## v2.8.2 (2026-06-24)
**CLI checkpoints**
The `fused` CLI gains `fused checkpoint create`, `list`, and `restore`, so you can snapshot your work from the terminal and roll back to an earlier state at any time.
See the CLI Reference to get started.
**Run shared canvases from the CLI**
`fused run` now works against shared canvases, so you can execute a teammate's shared canvas directly from the terminal without copying it first.
**Improvements**
- Canvas: visual indicators show when a canvas or UDF has unsaved metadata changes
- Canvas: map widget autoFit now fits the view to your data's bounds
- Workbench job status gains a Debug tab showing dmesg/syslog output for troubleshooting
- Faster canvas and workbench cold-load, with fewer redundant API calls
- S3 presigned URLs now proxy through the server so they work behind Zscaler and other corporate networks
- CLI: clearer help text for the `--env`, `serve-mcp`, and `json-ui` options
**Bug fixes**
- Fixed: ghost nodes resurrecting on canvas refresh and out-of-bounds nodes lingering in multi-select
- Fixed: text box background color not restored when loading a checkpoint
- Fixed: note and widget styling lost across GitHub sync, and pulled UDFs failing to re-run
- Fixed: false GitHub sync self-conflicts, now with clearer conflict errors
- Fixed: stale alignment helper lines remaining on the canvas after a drag
## v2.8.1 (2026-06-03)
**Canvas comments (experimental)**
The Canvas now has experimental support for comments, so you can leave notes anywhere on the canvas and discuss work in context with your team.
**Dropbox and OneDrive integrations**
Connect Dropbox and OneDrive as data sources and read files straight into your UDFs, alongside the existing cloud storage integrations.
**New widget components**
Widgets gain a file-upload input and a PDF gallery viewer, making it easier to bring documents into a widget and browse them inline.
**Improvements**
- Canvas: open any node in a fullscreen view for focused editing
- Canvas: UDF folders improved — duplicate folders, reorder nodes, and reorganize more reliably
- Canvas: revamped edge toolbar with a click-anchored layout, parameters panel, and copy-as-variables
- Canvas: Alt+ keyboard shortcuts jump straight to omnisearch actions
- CLI: new `fused udf search` and `fused canvas validate` commands, plus an `--output-file` option on `fused run`
- Experimental Widgets: experimental kepler-map JSON UI component for richer map widgets
**Bug fixes**
- Fixed: map results not showing up in some cases
- Fixed: z-index layer order not preserved when copying, pasting, or duplicating nodes
- Fixed: chat input Enter key sending messages mid-IME composition
- Fixed: CSV - Fixed: kernel dropdown not closing and preset search arrow-key navigation
## v2.8.0 (2026-05-19)
**Canvas MCP**
The Canvas now exposes an MCP server so AI tools like Claude and Cursor can connect directly to your canvas. Register it from the CLI with a single command.
See the Slack integration docs to get started.
**Improvements**
- [Experimental] Widgets: new `w` hotkey to open the widget builder
- Canvas team access tokens: tokens in UDF settings are now truncated for clarity
- Team-scoped shared canvases can now have an API endpoint created with a session token; "Open API" button activates when a session token is present
- Canvas and share page performance improvements
- UDF thumbnail now falls back gracefully if canvas-level capture fails
- Home page UI polish
**Bug fixes**
- Fixed: share token no longer carried over when copying a canvas in Workbench
- Fixed: README metadata preserved when pulling UDFs from GitHub
- Fixed: reading and pushing modified public UDFs
- Fixed: initial canvas tab state in the UDF Collection modal
- Fixed: Slack integration channel name handling
## v2.4.2 (2026-04-13)
**New home page**
A redesigned home page with a landing experience, quick-access menu, recents section, and live integration status.
**UDF folders**
UDFs on the canvas can be grouped into folders, simply by selecting multiple UDFs and clicking "Create Folder".
**Automatic session tokens for Team canvases**
Workbench now automatically creates a session token for UDFs in Team-scoped canvases, so shared UDFs are always accessible without manual token setup.
**Improvements**
- [Experimental] Widgets: Map Widget — deck.gl hybrid rendering, tooltip/color updates, and hex-tile polish
- [Experimental] Widgets: line chart and more chart types; switch layouts from a dropdown via `widget-builder`; SQL-backed widgets use a higher automatic row limit
- [Experimental] Widgets: editor and AI tweaks; `$param` references included in share URLs and param discovery
- Shared canvases support session tokens end-to-end; canvas passcode is generally available
- Session tokens in the canvas workflow; streamlined top bar
- Faster canvas cold start when catalog refresh can be skipped safely
- UDFs can return DataFrames with columns of fixed-shape NumPy arrays
- Quota exceeded errors surface clearly in the UI
- Glass-style loading overlay while UDFs run; overlay when copying GitHub-linked canvases
- UDF file endpoints: `.html` extension is optional
**Bug fixes**
- Fixed: share tokens and `collection_id` when running UDFs from Workbench or shared links
- Fixed: keyboard delete / shortcuts on the canvas
- Fixed: focus when wiring new connected UDFs; share-canvas sidebar behavior
- Fixed: UDF folder and sticky-note UI (rename, width, tags, alpha)
- Fixed: Home page upload popover layering
- Fixed: parquet file registration when a UDF output schema changes
- Fixed: widgets on shared canvases get correct catalog/collection context
- Fixed: extension matching for UDF URLs
- Fixed: cache invalidation and cache lookup on Basic tier
- Fixed: Jobs modal and blurred overlay behavior
## v2.3.1 (2026-03-31)
**[Experimental] Shareable Widgets**
Widgets can now be shared via URL — anyone with the link can view the widget directly, without needing access to the canvas.
**Improvements**
- [Experimental] Widgets: inline AI editing — AI can now modify Widget configuration directly in the editor
- [Experimental] Widgets: AI chat now distinguishes between "ask", "plan", and "build" modes for more precise tool use
- [Experimental] Widgets: Map-H3 improvements (zoom overlay, restored saved map bounds on refresh, updated Info/X icons)
- Service accounts: users can now create service accounts from the profile page
- GitHub integration: a GitHub repo can now be linked to multiple execution environments
- GitHub integration: confirmation prompt before changing git details when pushing to GitHub
- Canvas thumbnails are captured more reliably; edges toggle is preserved in share URLs
- UDF execution states in Workbench are clearer and more accurate
- Runtime tab now shows a visual indicator while a UDF is executing
- File explorer: improved reliability when opening the modal during a busy canvas
- AI chat: images are now compressed before being sent, reducing payload size
- Share link button and viewport zoom are restored correctly when opening a shared canvas
- Tab icons updated across Workbench
**Bug fixes**
- Fixed: UDF execution phase getting stuck
- Fixed: Widget dropdown unable to scroll to select an option
- Fixed: canvas sidebar collapse button not working
- Fixed: sticky note text toolbar actions triggered outside of edit mode
- Fixed: job log display issues
- Fixed: GitHub sync reliability issues
- Fixed: opening Preferences or Jobs from a public tab no longer redirects unexpectedly
- Fixed: canvas loading stability; stale canvas state no longer restored on route change
**Upgrades**
- DuckDB v1.5.1
## v2.3.0 (2026-03-26)
**New Home page**
Workbench now has a new Home page! This allows you to quickly navigate between Canvases.
Learn how to connect your own data or analysis here
- Experimental: "MCP Creator" AI profile to simplify creation of MCP servers from UDFs. Read more.
- Experimental auto-retry on errors: AI will try fixing the error until it can either fix it or hits its limit.
- Experimental: Dataset discovery scheduling in unstable environments.
- Experimental: Collection share tokens.
**Improvements:**
- AI Chat: More models, faster inference, better UX and error handling.
- AI now better understands data & has significantly improved ability to make charts especially for larger datasets.
- Workbench: Enhanced version page, improved UDF management flow, better data table filtering.
- Git integration: improved experience when pushing UDFs to GitHub.
**Bug Fixes:**
- AI & UDFs: Prevented AI writing to read-only UDFs, fixed serialization errors, JSON args, and File UDF save states.
- Version Control: Fixed stale UDF updates, staging detection, and backendId preservation.
- UI: Fixed Windows Ctrl+Click, modal flickering, autosave callbacks, and selection issues.
- [Experimental] Canvas: Fixed node persistence.
## v1.22.5 (2025-08-26)
**New Features:**
- Experimental Canvas mode.
**Improvements:**
- Added Deepseek v3.1 model to AI chat.
- AI chat has better layout and indicators for its settings. AI chat also shows user input when asking for more instructions.
- Versions button has moved to the bottom of the Workbench sidebar.
- Versions page shows the difference between upstream and a saved copy of a UDF.
- Versions page shows team repositories first, and will prompt when changing repository to a public one.
- Data table widget has `bigint` support, copy to clipboard, improved headers, and better filter support.
- Added html5lib package to the runtime.
**Bug Fixes:**
- AI chat will not suggest charting very small dataframes, along with other improvements to its suggestions and auto-fixes.
- Fixed bugs with the visualization menu in the map view. It works again and will not crash when no UDF is selected.
- Workbench won't show delete and versions button when they cannot do anything.
- Bug fixes for the conflict modal in Workbench not working or not updating the existing UDF.
- Fixed Workbench profile text for enterprise users.
**API changes:**
- Large jobs can now be run using `fused.run` and the `instance_type` parameter.
**Deprecations:**
- Parameters under the UDF in the advanced UDF editor is deprecated. It can be turned back on from the Workbench Preferences.
## v1.22.1 (2025-08-19)
**Improvements:**
- Inline AI editing is enabled by default.
- Improved data table component filtering.
- `fused.submit` results are cached by default.
- AI chat will now suggest new users to login after first prompt
- Multiple open tabs message will appear at the top of the page instead of as a modal.
**Bug Fixes:**
- Fixed a bug when loading some HTML UDF outputs that caused them to not load scripts.
- Fixed bugs with AI prompts.
- Fixed bugs with navigating to particular UDFs on the version page.
- You can opt to keep a changed version of a UDF instead of reloading with changes.
- Fixed file explorer for basic tier users.
- Fixed the Add Billing modal appearing when it was not supposed to.
- The UDF selector has a minimum width and is no longer editable.
## v1.22.0 (2025-08-18)
**New Features:**
- Free tier is now open for all. Signing in to Fused now gives you access to a shared, free compute environment with a daily quota.
- New simplified UDF editor layout. The previous UDF editor with map view is still available as the *Advanced UDF editor*.
**Improvements:**
- Added inline AI editing features as an experimental feature.
- Added `@`-sign to select context in AI chat.
- Added profile selection in AI chat.
- Added new models to AI chat.
- AI chat context will understand the results history.
- Many adjustments to AI prompts.
- Table widget has more filter capabilities.
- Many widgets now load via Parquet for faster and better loading.
- UDF list has had many buttons consolidated into the three dot menu in the advanced UDF builder.
**Bug Fixes:**
- Significant improvements to self-service in Workbench.
- Fixed duplicate UDF and conflicting UDF modal bugs.
- Versions page will remember the last selected repository.
- Workbench will prompt to load new versions from GitHub.
- File explorer will show `/mount` instead of `file:///` URL.
- Fixed issues where HTML results would not be rendered with UTF-8 charset.
- Fixed issues where share token may not get cleared in Workbench when duplicating UDFs.
- Fixed bugs with the canvas map widget loading, filtering, and coloring.
- Improved error messages and `run_*_async` when using `fused` from within Pyodide, for Pyodide-specific considerations.
- `to_fused(overwrite=True)` will delete the original UDF as expected.
- stderr will always be displayed for UDF runs.
**API changes:**
- Renamed `run_remote` to `run_batch`.
- Deprecate `fused.utils`, which has been replaced with `fused.load`.
## v1.21.6 (2025-07-31)
**New Features:**
- Added Qwen 3 to AI chat.
- Added a Table frame type.
**Improvements:**
AI:
- AI chat can be docker on the right or the left.
- You can now specify specific UDFs in AI chat.
Versioning:
- Version control page will ask to confirm pushing to a different repository.
Rendering:
- HTML (previously *Embed*) view is always available.
**Bug Fixes:**
- Fixed bugs with caching POST requests for some UDFs.
- Fixed bugs with AI chat context.
- Fixed bugs with self service onboarding and billing portal.
- Fixed bugs where Table mode would not open by default in Workbench.
- Fixed bugs with cache_storage.
## v1.21.5 (2025-07-30)
**New Features:**
- Added self service signup for new users!
- Added voice input to udf.ai and to rich text frames.
**Improvements:**
AI Chat:
- AI chat can now see results printed from a UDF.
- AI chat can now see sample rows returned from a UDF.
- AI chat can now show the code diff with generated code.
General:
- Profile modal now shows usage quota, when applicable.
- `@fused.cache` functions can now be profiled, and now supports object storage.
- Canvas now shows controls on hover.
- Canvas now has an Embed, Table, and Histogram frame types.
- Sped up UDF executions when `cache_max_age=0` was specified.
- Default UDF in Workbench is much simpler.
Canvas:
- Canvas now shows controls on hover.
**Bug Fixes:**
- Fixed saving UDFs where the UDF had previously been deleted on the server.
- Adjusted the default run timeout to match the backend run timeout.
- Fixed `fused.run` with `sync=False`.
## v1.21.4 (2025-07-24)
Minor bug fixes.
## v1.21.3 (2025-07-23)
Launching udf.ai! Ask your data questions, get AI to help you build answers.
**New Features:**
- Added support for speak-to-AI in the AI chat.
- Improved AI chat with one-click prompt suggestions and better tooltips.
**Improvements:**
- Improved color code handling in the editor.
- Moved experimental inline AI features behind feature flag.
- File-opener UDFs moved to the community catalog.
**Bug Fixes:**
- Fixed issues with undo-ing AI chat changes.
- Fixed issues with AI chat disconnections.
- Fixed caching for HTML return values from UDFs.
- Fixed handling of request parameters for UDF runs.
## v1.21.2 (2025-07-21)
**New Features:**
- Added ability to record audio into AI input.
- Added auto-share UDF on save functionality. (a shared token is created on first save for all new UDFs)
- Added compact mode for Canvas view.
- Added connection and save notifications for Canvas.
- Added ability to copy common load commands to clipboard.
- Added cache hit rate display on user profile.
**Improvements:**
- Enhanced AI Chat with better UI/UX for changes and settings menu.
- Workbench will automatically add a default UDF, and updated the default UDF template.
- String return types will be assumed to be HTML by default.
- Improved version control page performance and styling. Clicking on the changes pending asterisk (`*`) will now go directly to the version control page.
- Improved performance of the GitHub integration.
- Improved saving all UDFs to do so in parallel.
- Enhanced map widget integration in Canvas.
- Shift+Enter will turn on the currently selected UDF.
- Changed default for `fused.ingest` to `target_num_chunks=500`.
**Bug Fixes:**
- Fixed issues with `fused.run` behaving differently for saved UDFs.
- Fixed issues with new apps not showing changes indicator
- Fixed selected preview tab in UDF builder flickering.
- Fixed preview image uploads during GitHub pushes.
- Fixed user assignment issues on GitHub PR creation.
- Fixed an issue with linking to GitHub accounts.
- Fixed an issue with tailing batch job logs.
- Fixed `fused.__version__` not being populated correctly.
## v1.21.1 (2025-07-14)
**`fused-py`**
- Updated LanceDB to 0.24.1.
- Fixed issues starting batch jobs.
**Workbench**
- AI Chat now sees all UDFs in Workbench & has access to updated Fused documentation
- App builder now integrates with the new version control page.
- Fixed scrolling on the version control page.
- Fixed saving and layout issues on the Canvas view.
## v1.21.0 (2025-07-11)
**`fused-py`**
New Features:
- Added `fused.api.resolve`.
- Added `fused.api.team_info`.
- IPython magics now load automatically.
- When running a large (batch) job, it is now possible to specify the job's name.
- Upgraded `xarray` to 2025.4.0, DuckDB to 1.3.2, and H3 to 4.3.0.
- The `fd://` filesystem scheme will automatically be registered with `fsspec`.
- UDFs that return HTML will be loaded as `str` objects from `fused.run`.
- UDFs saved on Fused server now have a `catalog_url` property to get the Workbench UDF URL.
- `npy` output format is now supported for numpy (raster) return values.
- Arrow-compatible return values are now accepted.
- `fused.cache` will detect changes to referenced UDFs.
- `fused.run` accepts `verbose` keyword.
Bug Fixes:
- Fixed bugs with `udf.render` on some IPython versions.
- Fixed bugs with `repr`s for access tokens and UDFs.
- Fixed calling `fused.run` with UDF objects and `sync=False`.
- Renamed the UDF class to `Udf`.
- Removed some unused and deprecated code.
- Fixed bugs with `fused.cache` showing as not found, having stale files, or not passing arguments through.
- Removed the `n` keyword argument from `get_udfs` and `get_apps`.
- Fixed bugs with HEAD requests to UDF endpoint.
- `fused.submit` will warn about conflicting arguments.
- `/tmp/` size has been increased in realtime instances.
- `fused.api.list` and related functions supports `/mount` paths.
- Improved the performance of GitHub sync.
- Changed defaults for `JobPool.cancel` and fixed a bug where it would continue to retry.
- Fixed bugs with `JobPool.df` and UDF runs that result in exceptions.
- Fixed encoding URL paths in `fused.api.download` and related functions.
**Workbench**
New Features:
- Added AI editing and AI chat capabilities in the UDF builder.
- Workbench now has a code profiler: each line of code will show its execution runtime
- Added new Canvas dashboard builder mode (experimental).
- Added new Table data view mode.
- GitHub integration has a new page and is no longer beta.
- GitHub integration remembers relevant open PRs better.
- Fused apps uses a newer version of Streamlit and Stlite.
- Added a menu item to take a screenshot in higher-than-screen resolution.
- Added type-to-filter in File Explorer.
- File Explorer can be browsed without logging in.
- File Explorer now shows a summary of the current directory.
- File preview UDFs can now be specified with regular expressions.
- Cmd+Click on shared tokens will now take you to the UDF Explorer.
Bug Fixes:
- Results panel shows when memory usage is unknown.
- Share code is more consistent with the selected output format.
- Fixed bugs with read-only app UI.
- The large data warning will now show in File Explorer as well when applicable.
- Fixed bugs with app/UDF Explorer layout and sorting.
- Adjusted the UI for visualization settings and parameters in the UDF list.
- Reordered menu items in File Explorer.
- Cursor position will be remembered when switching between UDFs.
- Share tokens that are already shown on the page are no longer redacted.
- Map tooltip can now be scrolled.
## v1.20.1 (2025-06-09)
**`fused-py`**
New Features:
- Added `fused.api.resolve` and `fused.api.team_info`.
- IPython magics will automatically be loaded when importing `fused`.
- `run_batch` (batch jobs) can now accept a job name.
Bug Fixes:
- Fixed the `render` method of UDF objects.
- Fixed access tokens for apps being rendered in IPython.
- Fixed calling `fused.run(udf, sync=False)` with UDF objects.
- Removed some deprecated fields and arguments.
**Workbench**
- Workbench will now show the amount of time taken in UDF functions as a heatmap.
- Memory bars in the Results panel will show when usage is unknown.
- Update how shared token URLs are generated for different output formats.
- Updated stlite to 0.82.0.
## v1.20.0 (2025-06-03)
**`fused-py`**
New Features:
- Running a UDF with engine `local` will cache similarly to how it would when running on `remote` (supporting `cache_max_age` to control the caching).
- Large (batch) jobs will be in a Pending state if they cannot start immediately.
- UDFs can now accept `**kwargs` parameters, which will always be passed in as strings.
- `@fused.cache` has a new `cache_verbose` option. If set to `True` (default), it prints a message when a cached result is returned.
- `@fused.cache` renamed the `reset` parameter to `cache_reset`. The existing `reset` parameter is deprecated.
- Some file listing APIs like `fused.api.list` will work for public buckets when on free accounts.
- `fused.load` accepts `import_globals` (default `True`) for controlling importing UDF globals. Also, when globals cannot be imported, a warning is emitted instead of an exception.
Bug Fixes:
- Clarified login-needed message in Fused Apps.
- Fixed bugs with `@fused.cache` results not being ready.
- Fixed bugs with `@fused.cache` not detecting changes in the cached function.
- Loading a UDF from a file will autodetect the UDF function name.
- Fixed bugs with returning GeoDataFrames that do not contain geometry.
- Fixed calling `to_fused` on an app.
**Workbench**
- A message will appear above the UDF body when parameters are set in the UDF list.
- A lock icon will be shown next to read-only UDFs and Apps in Workbench.
- When pushing UDFs to GitHub, the preview image will be pushed to a public URL so that the README in GitHub is rendered correctly.
- When pushing UDFs to GitHub, Workbench will assign the PR to you if possible.
- It is now possible to delete UDFs and Apps directly from the catalog.
- Added a "Reload Collection" button. This pulls all latest version of UDF currently in your Collection.
- Workbench will minimize more changes from the PRs it creates on GitHub.
- "Open in Kepler.gl" supports H3 (string) data.
- The visibility button for a Fused App will now reset the app.
- A new Reset 3D View button is added to the UDF Builder map, and the keyboard shortcut has been updated to `Cmd+Shift+UpArrow` on MacOS (`Ctrl+Shift_UpArrow` on Windows / Linux).
- Workbench will show the current environment name above the map by default.
- Workbench will remember which UDF was selected when reopening the page.
- Adjusted which UDF mode label is shown when automatically detecting the UDF mode.
- Fixed some bugs with dynamic output mode.
- UI updates for the Pull Changes (history) and Push Changes views, including showing the README file in both views.
- Drag&Drop UDF into Workbench now works on the entire tab
- Added a button to download usage table in the Profile view.
- Fixed some visual bugs with light mode.
- File Explorer will no longer show file opener UDFs saved on your personal catalog, and will clarify when file opener UDFs are from your team catalog.
## v1.19.0 (2025-05-19)
**`fused-py`**
Breaking changes:
- Large (batch) jobs have been updated to pass parameters into the UDF the same way as other UDF runs. For compatibility, if the parameters passed into the job do not correspond with the parameters, a dictionary parameter is passed into the UDF instead. This will be deprecated and removed in a future release.
- The `context` and `bbox` parameters to a UDF are no longer treated as special.
- Python 3.9 support, which was previously deprecated, is now removed. The minimum Python version for the `fused` package is now 3.10.
New Features:
- PyArrow upgraded to version 16.0.
- Ingestion now supports input files without extensions, and filters out files with `.` or `_` prefix.
- `cache=False` is now a shortcut for disabling cache, e.g. `cache_max_age=0`.
- UDFs now support parameters annotated as `shapely.Geometry` or `shapely.Polygon`.
- `fused.load` now support loading UDFs from Github Pull Request URLs.
- Added a timeout parameter for `fused.api.upload`.
- Fused API functions now support `/mount` without `file://` prefix.
- `fused.api.download` now supports downloading files from `/mount`.
- `fused.api.list` now supports listing an individual file under `/mount`.
- `max_deletion_depth` in `fused.api.delete` default changed from 2 to 3.
Bug Fixes
- Fixed pickling UDF objects.
- Fixed UDF equality checks not conforming to Python specifications.
- Many fixes to ensure compatibility between the `fused` module available on PyPI and the `fused` module within the Fused backend.
- Fixed returning `pd.Timestamp` objects.
- Fixed bugs with handling of stdout if the UDF is async.
- Fixed bugs with UDF object `repr` in Jupyter.
- Fixed `@fused.cache` in Fused Apps.
- Fixed "multiple auth mechanisms" error when retrieving job results.
- Fixed deserialization of GeoDataFrame without geometry column.
- Fixed cases where UDFs would be indented when run.
- Various stability and performance updates, including new self-healing capabilities on the Fused backend.
**Workbench**
- Upgraded Streamlit in apps to 1.44.
- Fused Apps is no longer "beta".
- Fused Apps will now highlight syntax errors.
- Fused Apps will now autocomplete the `fused` module correctly.
- "Changes pending" in the map has been renamed to "Running" and now shows the time elapsed without needing to hover over it.
- UDF builder tooltips have been refreshed, it is now possible to click on data on the map to pin the tooltip on screen. Pinned tooltips show how many data records were under the mouse and allow paging through them.
- Workbench can now highlight H3 hexagons on click.
- Workbench can now detect decimal H3 indexes and Cmd+Click works on them.
- `udf://` URLs in Workbench now entirely overwrite parameters of the selected UDF.
- Fixed UDF builder showing partially updated map states for Tile UDFs.
- Collections catalog can now be sorted.
- Fixed a bug where Workbench would not detect newly added utils on UDFs.
- Parameters and Visualization sections are now styled slightly differently to make it easier to pick out your UDFs.
- Renamed Visualization "Surprise me" button to "Preset".
- Fixed a visual bug with the job status.
- Updated the share UDF and share app pages.
- Fixed bugs with UDF or app catalog showing the wrong content.
- Renamed "History" to "Pull Changes" and updated styling of that page.
- Fixed Pull Changes not showing diffs if utils had been added or deleted.
- Fixed Workbench showing the original Github link for forked UDFs.
- Workbench code editors will now remember scroll position.
- Clicking the viewport location label will now copy it.
## v1.18.0 (2025-04-28)
**`fused-py`**
Breaking changes:
- `fused.submit` now raises an error by default, if there is any run erroring
New Features:
- It is now possible set the cache storage location with `@fused.cache(storage=...)`.
- `@fused.cache` can now exclude arguments from the cache key.
- `@fused.cache` uses Pandas' own way of hashing DataFrames.
- Added storage argument to `fused.file_path(storage=...)`.
- Large jobs now pick up AWS credentials more consistently.
- Auth redirect can dynamically select the port when logging in locally.
- `udf.to_fused` will show the diff when UDF name conflicts with an existing UDF.
- `fused.load` can load by the unique UDF ID again.
- UDFs can be run by username and UDF name in addition to email and UDF name. (ex: `fused.run(user@team.com/my_cool_udf)`).
- Preview images can now be specified in-directory in Github.
- Adjusted UDF caching behavior for performance.
Bug Fixes
- Fixed behavior when loading and running UDFs with code outside of the UDF function.
- Fixed `fused.api.list` being incompatible with some async stacks.
- Fixed a bug where strings inside UDFs would get extra spaces added to them.
- Shared tokens can be created by a team account.
- Fixed a bug that could occur where Fused would try to duplicate index column names of the returned DataFrame.
- Fixed various bugs when a UDF closes `stdout`.
- Fixed a bug where `fused.run` would not return printed messages from a UDF.
- Fixed a bug where `fused.load` would crash on very large strings.
- Fixed various bugs with exporting UDFs from within fused-py.
- Fixed a bug where `partitioning_schema_input` would not be found when ingesting.
- Fixed a bug where UDFs might import incorrectly when several pushes happen in quick succession in a linked Github repo.
**Workbench**
- `File (Viewport)` renamed to `Single (Viewport)`.
- Added `Single (Parameter)` UDF type that behaves like `Single (Viewport)` but does not pass the viewport bounds.
- File Explorer will show a per-user home favourite.
- Your UDF list will now sync across different browser tabs.
- Preference toggles are added to the Command Palette.
- The share page has been redesigned.
- Collections catalog page now shows the UDF in a given Collection by hovering over them.
- When adding a duplicate UDF to Workbench, you will be prompted to duplicate or replace it.
- Memory usage for UDFs can be found in the results panel (once displaying memory usage was been turned on in Preferences)
- Workbench will indicate that UDF runs were cached in all circumstances.
- The public map page is now compatible with any public-readable shared token.
- Added `udf://name?param=value` URL support to Workbench.
- Reduced the size of metadata diffs generated by Workbench when pushing to Github.
- Various performance improvements.
- Fixes for various UI layout bugs.
## v1.17.0 (2025-04-10)
**`fused-py`**
- Team UDFs can be loaded or run by specifying the name "team", as in: `fused.load("team/udf_name")`
- `Udf.to_fused` supports overwriting the UDF when saving.
- Added `fused.api.enable_gcs()` to configure using the Google Cloud Platform secret specified in Fused secret manager.
- `@fused.cache` locking mechanism has changed and will not allow multiple concurrent runs.
- Upgraded DuckDB to v1.2.2.
- Running a saved UDF by token or name will now also show the logs, including print statements and error tracebacks.
- All functions interacting with the Fused server will now retry automatically, by default 3 times.
- Python 3.9 support is deprecated. The next release of `fused` will require Python 3.10+.
- Deprecated `fused_batch` module is removed.
**Workbench**
- Cached UDF runs will show the original logs.
- "Change output parameters" in the Share UDF screen shows all detected parameters.
- Added a copy viewport bounds button in the Results panel.
- Improved the performance of the catalog screen.
- Fixed the job page showing times in inconsistent time zones.
App Builder:
- Deprecated `fused_app` module is removed.
## v1.16.3 (2025-04-03)
**`fused-py`**
- It is now possible to return general `list`s and `tuple`s from UDFs. (Note: a tuple of a raster and bounds will be treated as a raster return type.)
**Workbench**
- Workbench will now prompt you when loading large UDF results that could slow down or overwhelm your browser. The threshold for this prompt is configurable in your Workbench preferences.
- Fixed bugs with loading large UDF results.
- UDF list will show an error if a UDF has an empty name.
- Fixed running some public UDFs in Workbench.
## v1.16.2 (2025-04-01)
**`fused-py`**
- It is now possible to return dictionaries of objects from a UDF, for example a dictionary of a raster numpy array, a DataFrame, and a string.
- Whitespace in a UDF will be considered as changes when determining whether to return cached data. (a UDF with different whitespace will be rerun rather than cached)
- Fixed calling `fused.run` in large jobs.
**Workbench**
- Added experimental AI agent builder.
- Workbench will now prompt you to replace an existing UDF when adding the same UDF (by name) from the catalog.
- Added ability to download & upload an entire collection.
- Fixed saving collections with empty names.
Visualization:
- Added an H3-only visualization preset.
- Fixed a bug where changing TileLayer visualization type could result in a crash.
App Builder:
- Updated the runtime.
## v1.16.0 (2025-03-27)
**`fused-py`**
- The result object of running in `batch` now has `logs_url` property.
- Fixed `fused.submit` raising an error if some run failed.
**Workbench**
- Added a Download UDFs button for downloading an entire collection.
- Results will show a message at the top if UDF execution was cached.
- Non-visible UDFs will have a different highlight color on them in the UDF list.
- Collections will show as modified if the order of UDFs has been changed.
- Fixes for Collections saving the ordering and visibility of UDFs.
- Fixed the Team Jobs page in Workbench crashing in some cases.
**Shared tokens**
- Shared token URLs can be called with an arbitrary (ignored) file extension in the URL.
## v1.15.0 (2025-03-20)
**`fused-py`**
- Loading UDFs now behaves like importing a Python module, and attributes defined on the UDF can be accessed.
- The `fused.submit()` keyword `wait_on_result` has been renamed to `collect`, with a default of `collect=True` returning the collected results (pass `collect=False` to get the JobPool object to inspect individual results).
- New UDFs default to using `fused.types.Bounds`.
- Upgraded `duckdb` to v1.2.1.
- UDFs can now return simple types like `str`, `int`, `float`, `bool`, and so on.
- Files in `/mount/` can be listed through the API.
- UDFs from publicly accessible GitHub repositories can be loaded through `fused.load`.
- `fused.load` now supports loading a UDF from a local .py file or directory
- The `x`, `y` and `z` aren't protected arguments when running a UDF anymore (previously protected to pass X/Y/Z mercantile tiles).
**Workbench**
New:
- Added a new account page and redesigned preferences page.
- You can now customize the code formatter settings (available under Preferences > Editor preferences).
- UDFs can optionally be shared with their code when creating a share token.
General:
- Moved shared token page to bottom left bar, and adjusted the icons.
- The ordering of UDFs in collections is now saved.
App Builder:
- Updated app list UI.
- Fixed bugs with shared apps showing the wrong URL in the browser.
## v1.14.0 (2025-02-25)
v1.14.0 introduces a lot of new changes across `fused-py` and Workbench
**`fused-py`**
- Introducing `fused.submit()` method for multiple job run
- Improvement to UDF caching
- All UDFs are now cached for 90 days by default
- Ability to customize the age of cached data & UDFs with the new `cache_max_age` argument when defining UDFs, running UDFs or when caching regular Python functions
- `pandas` & `geopandas` are now optional for running non-spatial UDF locally
- Removed hardcoded `nodata=0` value for serializing raster data
**Workbench**
New:
- Introducing Collections to organize & aggregate UDFs together
- Redesigned "Share" button & page: All the info you need to share your UDFs to your team or the world
General:
- Improvements to Navigation in Command Palette. Try it out in Workbench by doing `Cmd + K` (`Ctrl + K` on Windows / Linux)
- Autocomplete now works with `Tab` in Code Editor with `Tab`
- Added a Delete Button in the Shared Tokens page (under Profile page)
- Ability to upload images for UDF Preview in Settings Page
- Adding “Fullscreen” toggle in Map View
- Improved `colorContinuous` in Visualize Tab
- Allowing users to configure public/team access scopes for share tokens
- No longer able to edit UDF & App name in read-only mode
- Fixing job loading logs
File Explorer:
- Download directories as `zip`
- Adding favorites to file path input search results
- Ability to open `.parquet` files with Kepler.gl
## v1.13.0 (2025-01-22)
- Fixed shared UDFs not respecting the Cache Enabled setting.
- Added a cache TTL (time-to-live) setting when running a UDF via a shared token endpoint.
- Tags you or your team have already used will be suggested when editing a UDF's tags.
- Team UDFs will be shown as read-only in Workbench, similar to Public UDFs.
- File Explorer shows deletion in progress.
- File Explorer can accept more S3 URLs, and uses `/mount/` instead of `/mnt/cache`.
- UDF Builder will no longer select a UDF when clicking to hide it.
- Fixed how Push to Github chooses the directory within a repository to push to.
- Fixed the browser location bar in Workbench updating on a delay.
- Fixed writing Shapefile or GPKG files to S3.
- (Beta) New fusedio/apps repository for public Fused Apps.
- Navigating to Team UDFs or Saved UDFs in the UDF Explorer will now prompt for login.
- Fixed the "Select..." environment button in Workbench settings.
- UDF Builder will no longer replace all unaccepted characters with `_` (underscore).
- Fixed loading team UDFs when running a UDF with a shared token.
- Batch jobs that use `print` will now have that output appear in the job logs.
- Apps in the shared token list show an app icon.
- Removed some deprecated batch job options.
- Installed `vega-datasets` package.
## v1.12.0 (2025-01-10)
- (Beta) Added an App catalog in Workbench, and a new type of URL for sharing apps.
- Added `/mount` as an alias for `/mnt/cache`.
- More consistently coerce the type of inputs to UDFs.
- Added more visualization presets to UDF builder in Workbench.
- Fixed an issue where the tab icon in Workbench could unintentionally change.
- Fixed bugs in Workbench File Explorer for `/mnt/cache` when browsing directories with many files.
- Fixed bugs in `fused` Python API not being able to list all files that should be accessible.
- Fixed bugs in the Github integration, command palette, and file explorer in Workbench.
- Fixed bugs in caching some UDF outputs.
- The shareable URL for public and community UDFs will now show in the settings tab for those UDFs.
- UDFs can customize their data return with `Response` objects.
## v1.11.9 (2024-12-19)
- Accounts now have a *handle* assigned to them, which can be used when loading UDFs and pushing to community UDFs
- Account handle can be changed once by the user (for more changes please contact the Fused team.)
- Added a command palette to the Workbench, which can be opened with Cmd-k or Ctrl-k.
- When creating a PR for a community UDF or to update a public UDF, it will be under your account if you log in to Fused with Github.
- Bug fixes for pushing to Github, e.g. when pushing a saved UDF, and for listing the Fused bot account as an author.
- Batch (`run_batch`) jobs can call back to the Fused API.
- Team UDFs can be pinned to the end of the featured list.
- Speed improvements in ingestion.
- Ingestion will detect `.pq` files as Parquet.
- Format code shortcut in Workbench is shown in the keyboard shortcut list and command palette.
- Workbench will hide the map tooltip when dragging the map by default.
- Workbench will now look for a `hexLayer` visualization preset for tabular results that do not contain `geometry`.
- Workbench file explorer can now handle larger lists of files.
- Fix for browsing disk cache (`/mnt/cache`) in Workbench file explorer.
- Teams with multiple realtime instances can now set one as their default.
- Fix for saving UDFs with certain names. Workbench will show more descriptive error messages in more cases for issues saving UDFs.
## v1.11.8 (2024-12-04)
- New File Explorer interface, with support for managing Google Cloud Storage (GCS) and `/mnt/cache` files.
- Workbench will show an error when trying to save a UDF with a duplicate name.
- Fixed a few bugs with Github integration, including the wrong repository being selected by default when creating a PR.
- Updated `fsspec` and `pyogrio` packages.
## v1.11.7 (2024-11-27)
- Decluttered the interface on mobile browsers by default.
- Fixed redo (Cmd-Shift-z or Ctrl-Shift-z) sometimes being bound to the wrong key.
- Tweaked the logic for showing the selected object in Workbench.
## v1.11.6 (2024-11-26)
- Added Format with Black (Alt+Shift+f) to Workbench.
- Fix the CRS of DataFrame's returned by get_chunk_from_table.
- Added a human readable ID to batch jobs.
- Fused will send an email when a batch job finishes.
- Fix for opening larger files in Kepler.gl.
- Fix for accessing UDFs in a team.
- Improved messages for UDF recursion, UDF geometry arguments, and returning geometry columns.
- Adjusted the UDF list styling and behavior in Workbench.
- Fix for secrets in shared tokens.
## v1.11.5 (2024-11-20)
- Show message for keyword arguments in UDFs that are reserved.
- Added reset kernel button.
- Workbench layers apply visualization changes immediately when the map is paused.
- Show the user that started a job for the team jobs list.
- Fix for running nested UDFs with utils modules.
- Fix for returning xarray results from UDFs.
- Fix for listing files from within UDFs.
- Upgraded to GeoPandas v1.
## v1.8.0 (2024-06-25) :package:
- Added Workbench tour for first-time users.
- Undo history is now saved across UDFs and persists through reloads.
- Added autocomplete when writing UDFs in Workbench.
- Added `colorBins`, `colorCategories`, and `colorContinuous` functions to Workbench's Visualize tab.
- Migrated SDK to Pydantic v2 for improved data validation and serialization.
- Fixed a bug causing NumPy dependency conflicts.
## v1.7.0 (2024-06-04) :bird:
- Execution infrastructure updates.
- Update DuckDB package to v1.0.0.
- Improve responsivity of Workbench allotments.
- Crispen Workbench UI.
## v1.6.1 (2024-05-06) :guardsman:
_GitHub integration_
- Updates to team GitHub integration.
- Users are now able to create shared UDF token from a team UDF both in Workbench and Python SDK.
## v1.6.0 (2024-04-30) :checkered_flag:
- The Workbench file explorer now shows UDFs contributed by community members.
- Team admins can now set up a GitHub repository with UDFs that their team members can access from Workbench.
## v1.5.4 (2024-04-15) :telescope:
- Button to open slice of data in Kepler.gl.
- Minor UI design and button placement updates.
## v1.5.3 (2024-04-08) :duck:
- Improved compatibility with DuckDB requesting data from shared UDFs.
- Geocoder in Workbench now supports coordinates and H3 cell IDs.
- GeoDataFrame arguments to UDFs can be passed as bounding boxes.
- The package ibis was upgraded to 8.0.0.
- Utils modules no longer need to import fused.
## v1.5.2 (2024-04-01) :tanabata_tree:
- File browser can now preview images like TIFFs, JPEGs, PNGs, and more.
- Users can now open Parquet files with DuckDB directly from the file browser.
## v1.5.0 (2024-03-25) :open_file_folder:
- The upload view in Workbench now shows a file browser.
- Users can now preview files in the file browser using a default UDF.
## v1.4.1 (2024-03-19) :speech_balloon:
- UDFs now support typed function annotations.
- Introduced special types `fused.types.TileXYZ`, `fused.types.TileGDF`, `fused.types.Bbox`.
- Workbench now autodetects Tile or File outputs based on typing.
- Added button to Workbench to autodetect UDF parameters based on typing.
## v1.1.1 (2024-01-17) :dizzy:
- Renamed `fused.utils.run_realtime` and `fused.utils.run_realtime_xyz` to `fused.utils.run_file` amd `fused.utils.run_tile`.
- Removed `fused.utils.run_once`.
## v1.1.0 (2024-01-08) :rocket:
- Added functions to run the UDFs realtime.
## v1.1.0-rc2 (2023-12-11) :bug:
- Added `fused.utils.get_chunk_from_table`.
- Fixed bugs in loading and saving UDFs with custom metadata and headers.
## v1.1.0-rc0 (2023-11-29) :cloud:
- Added cloud load and save UDFs.
- `target_num_files` is replaced by `target_num_chunks` in the ingest API.
- Standardize how a decorator's headers are preprocesses to set `source_code` key.
- Fixed a bug loading UDFs from a job.
## v1.0.3 (2023-11-7) :sweat_drops:
_Getting chunks_
- Added `fused.utils.get_chunks_metadata` to get the metadata GeoDataFrame for a table.
- `run_local` now passes a copy of the input data into the UDF, to avoid accidentally persisting state between runs.
- `instance_type` is now shown in more places for running jobs.
- Fixed a bug where `render()`ing UDFs could get cut off.
- Fixed a bug with defining a UDF that contained an internal `@contextmanager`.
## v1.0.2 (2023-10-26) :up:
_Uploading files_
- Added `fused.upload` for uploading files to Fused storage.
- Added a warning for UDF parameter names that can cause issues.
- Fixed some dependency validation checks incorrectly failing on built-in modules.
## v1.0.1 (2023-10-19) :ant:
- Added `ignore_chunk_error` flag to jobs.
- Added warning when sidecar table names are specified but no matching table URL is provided.
- Fixed reading chunks when sidecars are requested but no sidecar file is present.
- Upgraded a dependency that was blocking installation on Colab.
## v1.0.0 (2023-10-13) :ship:
_Shipping dependencies_
- Added `image_name` to `run_batch` for customizing the set of dependencies used.
- Added `fused.delete` for deleting files or tables.
- Renamed `output_main` and `output_fused` to `output` and `output_metadata` respectively in ingestion jobs.
- Adjusted the default instance type for `run_batch`.
- Fixed `get_dataframe` sometimes failing.
- Improved tab completion for `fused.options` and added a repr.
- Fixed a bug where more version migration messages were printed.
- Fixed a bug when saving `fused.options`.
================================================================================
## API Reference
Path: python-sdk/overview.mdx
URL: https://docs.fused.io/python-sdk/overview
# API Reference
This is the API reference for the `fused` Python package, which allows you to build and run serverless data workflows.
The reference is intended to be limited to low-level descriptions of various programmatic functionality. If you're just getting started with Fused, we recommend looking at the Guide first or exploring an Example.
## Decorators
| Function | Description |
| --- | --- |
| @fused.udf | Decorator to define a User Defined Function |
| @fused.cache | Decorator to cache function results |
## UDF Execution
| Class/Function | Description |
| --- | --- |
| Udf | UDF class — call directly or use `.map()` for parallel execution |
| JobPool | Manage parallel job execution (returned by `udf.map()`) |
| fused.run | [Legacy] Execute a UDF |
| fused.run_async | [Legacy] Execute a UDF asynchronously |
| fused.submit | [Legacy] Submit a UDF for parallel execution |
## Loading UDFs
| Function | Description |
| --- | --- |
| fused.load | Load a UDF from file, URL, or Workbench |
| fused.load_async | Load a UDF asynchronously |
## Data Access
| Function | Description |
| --- | --- |
| fused.get_chunk_from_table | Read a chunk from a partitioned table |
| fused.get_chunks_metadata | Get metadata for table chunks |
| fused.find_dataset | Search for datasets in the catalog |
| fused.register_dataset | Register a dataset in the catalog |
## File Operations
| Function | Description |
| --- | --- |
| fused.download | Download files from URLs |
| fused.file_path | Get local file path for cached files |
| fused.ingest | Ingest geospatial data into optimized format |
| fused.ingest_nongeospatial | Ingest non-geospatial data |
## Configuration & Utilities
| Function | Description |
| --- | --- |
| fused.context | Access UDF execution context |
| fused.options | Configure Fused runtime options |
| fused.secrets | Access secrets and credentials |
| fused.types | Type definitions for UDF parameters |
| fused.h3 | H3 hexagonal grid utilities |
| fused.api | Low-level API access |
## Classes
| Class | Description |
| --- | --- |
| Udf | UDF object with metadata and execution methods |
| JobPool | Pool for managing parallel job execution |
================================================================================
## Top-Level Functions
Path: python-sdk/top-level-functions.mdx
URL: https://docs.fused.io/python-sdk/top-level-functions
## @fused.udf
```python
udf(
fn: Optional[Callable] = None,
*,
name: Optional[str] = None,
cache_max_age: Optional[str] = None,
engine: Optional[str] = None,
instance_type: Optional[str] = None,
disk_size_gb: Optional[int] = None,
region: Optional[str] = None,
default_parameters: Optional[Dict[str, Any]] = None,
headers: Optional[Sequence[Union[str, Header]]] = None
) -> Callable[..., Udf]
```
A decorator that transforms a function into a Fused UDF.
**Parameters:**
- **name** (`Optional[str]`) – The name of the UDF object. Defaults to the name of the function.
- **cache_max_age** (`Optional[str]`) – The maximum age when returning a result from the cache.
- **engine** (`Optional[str]`) – The execution engine to use ('remote', 'local', 'realtime', or a batch
instance type like 'small', 'medium', 'large', 'm5.large', etc.).
If not specified (and also not specified in `fused.run()`), defaults
to 'realtime'.
- **disk_size_gb** (`Optional[int]`) – The size of the disk in GB to use for remote execution
(only supported for a batch instance type).
- **default_parameters** (`Optional\[Dict[str, Any]\]`) – Parameters to embed in the UDF object, separately from the arguments
list of the function. Defaults to None for empty parameters.
- **headers** (`Optional\[Sequence\[Union[str, Header]\]\]`) – A list of files to include as modules when running the UDF. For example,
when specifying `headers=['my_header.py']`, inside the UDF function it may be
referenced as:
```py
my_header.my_function()
```
Defaults to None for no headers.
**Returns:**
- `Callable\..., [Udf\]` – A callable that represents the transformed UDF. This callable can be used
- `Callable\..., [Udf\]` – within GeoPandas workflows to apply the defined operation on geospatial data.
**Examples:**
To create a simple UDF that calls a utility function to calculate the area of geometries in a GeoDataFrame:
```py
@fused.udf
def udf(bbox, table_path="s3://fused-asset/infra/building_msft_us"):
...
gdf = table_to_tile(bbox, table=table_path)
return gdf
```
To create a UDF that runs on a specific instance type:
```py
@fused.udf(engine='large')
def udf(bbox):
# This will run on a large batch instance
...
return result
```
---
## @fused.cache
```python
cache(
func: Callable[..., Any] | None = None,
cache_max_age: str | int | None = None,
cache_folder_path: str = "tmp",
concurrent_lock_timeout: str | int = 120,
cache_reset: bool | None = None,
cache_storage: StorageStr | None = None,
cache_key_exclude: Iterable[str] = None,
cache_verbose: bool | None = None,
) -> Callable[..., Any]
```
Decorator to cache the return value of a function.
This function serves as a decorator that can be applied to any function
to cache its return values. The cache behavior can be customized through
keyword arguments.
**Parameters:**
- **func** (`Callable`) – The function to be decorated. If None, this
returns a partial decorator with the passed keyword arguments.
- **cache_max_age** (`str | int | None`) – A string with a numbered component and units. Supported units are seconds (s), minutes (m), hours (h), and
days (d) (e.g. "48h", "10s", etc.).
- **cache_folder_path** (`str`) – Folder to append to the configured cache directory.
- **concurrent_lock_timeout** (`str | int`) – Max amount of time in seconds for subsequent concurrent calls to wait for a previous
concurrent call to finish execution and to write the cache file.
- **cache_reset** (`bool | None`) – Ignore `cache_max_age` and overwrite cached result.
- **cache_storage** (`StorageStr | None`) – Set where the cache data is stored. Supported values are "auto", "mount" and "local". Auto will
automatically select the storage location defined in options (mount if it exists, otherwise local) and
ensures that it exists and is writable. Mount gets shared across executions where local will only be shared
within the same execution.
- **cache_key_exclude** (`Iterable[str]`) – An iterable of parameter names to exclude from the cache key calculation. Useful for
arguments that do not affect the result of the function and could cause unintended cache expiry (e.g.
database connection objects)
- **cache_verbose** (`bool | None`) – Print a message when a cached result is returned
Returns:
Callable: A decorator that, when applied to a function, caches its
return values according to the specified keyword arguments.
**Examples:**
Use the `@cache` decorator to cache the return value of a function:
```py
@fused.cache
def expensive_function():
# Function implementation goes here
return result
```
If the output of a cached function changes, for example if remote data is modified,
it can be reset by running the function with the `cache_reset` keyword argument. Afterward,
the argument can be cleared.
```py
expensive_function(cache_reset=True)
```
---
## fused.load
```python
load(
url_or_udf: Union[str, Path],
/,
*,
cache_key: Any = None,
import_globals: bool = True,
collection_name: str | None = None,
) -> AnyBaseUdf
```
Loads a UDF from various sources including GitHub URLs,
and a Fused platform-specific identifier.
This function supports loading UDFs from a GitHub repository URL, or a Fused
platform-specific identifier composed of an email and UDF name. It intelligently
determines the source type based on the format of the input and retrieves the UDF
accordingly.
**Parameters:**
- **url_or_udf** (`Union[str, Path]`) – A string representing the location of the UDF, or the raw code of the UDF.
The location can be a GitHub URL starting with "https://github.com",
a Fused platform-specific identifier in the format "email/udf_name",
or a local file path pointing to a Python file.
- **cache_key** (`Any`) – An optional key used for caching the loaded UDF. If provided, the function
will attempt to load the UDF from cache using this key before attempting to
load it from the specified source. Defaults to None, indicating no caching.
- **import_globals** (`bool`) – Expose the globals defined in the UDF's context as attributes on the UDF object (default True).
This requires executing the code of the UDF. To globally configure this behavior, use `fused.options.never_import`.
- **collection_name** (`str | None`) – Collection name to load the UDF from. If not provided, will attempt to
use the collection of the currently executing UDF, or default to "default".
**Returns:**
- **AnyBaseUdf** (`AnyBaseUdf`) – An instance of the loaded UDF.
**Raises:**
- `ValueError` – If the URL or Fused platform-specific identifier format is incorrect or
cannot be parsed.
- `Exception` – For errors related to network issues, file access permissions, or other
unforeseen errors during the loading process.
**Examples:**
Load a UDF from a GitHub URL:
```py
udf = fused.load("https://github.com/fusedio/udfs/tree/main/public/REM_with_HyRiver/")
```
Load a UDF using a Fused platform-specific identifier:
```py
udf = fused.load("username@fused.io/REM_with_HyRiver")
```
---
## fused.run
```python
run(
udf: Union[str, None, UdfJobStepConfig, Udf, UdfAccessToken] = None,
*,
x: Optional[int] = None,
y: Optional[int] = None,
z: Optional[int] = None,
sync: bool = True,
engine: Optional[Literal["remote", "local"]] = None,
instance_type: Optional[InstanceType] = None,
type: Optional[Literal["tile", "file"]] = None,
max_retry: int = 0,
cache_max_age: Optional[str] = None,
cache: bool = True,
parameters: Optional[Dict[str, Any]] = None,
disk_size_gb: Optional[int] = None,
_return_response: Optional[bool] = False,
_ignore_unknown_arguments: bool = False,
_cancel_callback: Callable[[], bool] | None = None,
_stream_logs: bool = False,
**kw_parameters: bool
) -> Union[
ResultType,
Coroutine[ResultType, None, None],
UdfEvaluationResult,
Coroutine[UdfEvaluationResult, None, None],
]
```
Executes a user-defined function (UDF) with various execution and input options.
This function supports executing UDFs in different environments (local or remote),
with different types of inputs (tile coordinates, geographical bounding boxes, etc.), and
allows for both synchronous and asynchronous execution. It dynamically determines the execution
path based on the provided parameters.
**Parameters:**
- **udf** (`str, Udf or UdfJobStepConfig`) – the UDF to execute.
The UDF can be specified in several ways:
- A string representing a UDF name or UDF shared token.
- A UDF object.
- A UdfJobStepConfig object for detailed execution configuration.
- **x, y, z** – Tile coordinates for tile-based UDF execution.
- **sync** (`bool`) – If True, execute the UDF synchronously. If False, execute asynchronously.
- **engine** (`Optional\[Literal['remote', 'local']\]`) – The execution engine to use ('remote' or 'local').
- **instance_type** (`Optional[InstanceType]`) – The type of instance to use for remote execution ('realtime',
or 'small', 'medium', 'large' or one of the whitelisted instance types).
If not specified, gets the default from the UDF (if specified in the
`@fused.udf()` decorator, and the UDF is not run as a shared token),
or otherwise defaults to 'realtime'.
- **disk_size_gb** (`Optional[int]`) – The size of the disk in GB to use for remote execution
(only supported for a batch (non-realtime) instance type).
- **type** (`Optional\[Literal['tile', 'file']\]`) – The type of UDF execution ('tile' or 'file').
- **max_retry** (`int`) – The maximum number of retries to attempt if the UDF fails.
By default does not retry.
- **cache_max_age** (`Optional[str]`) – The maximum age when returning a result from the cache.
Supported units are seconds (s), minutes (m), hours (h), and days (d) (e.g. “48h”, “10s”, etc.).
Default is `None` so a UDF run with `fused.run()` will follow `cache_max_age` defined in `@fused.udf()` unless this value is changed.
- **cache** (`bool`) – Set to False as a shortcut for `cache_max_age='0s'` to disable caching.
- **verbose** – Set to False to suppress any print statements from the UDF.
- **parameters** (`Optional\[Dict[str, Any]\]`) – Additional parameters to pass to the UDF.
- \*\***kw_parameters** – Additional parameters to pass to the UDF.
**Raises:**
- `ValueError` – If the UDF is not specified or is specified in more than one way.
- `TypeError` – If the first parameter is not of an expected type.
- `Warning` – Various warnings are issued for ignored parameters based on the execution path chosen.
**Returns:**
- `Union\[ResultType, Coroutine\[ResultType, None, None\], UdfEvaluationResult, Coroutine\[UdfEvaluationResult, None, None\]\]` – The result of the UDF execution, which varies based on the UDF and execution path.
**Examples:**
Run a UDF saved in the Fused system:
```py
fused.run("username@fused.io/my_udf_name")
```
Run a UDF saved in GitHub:
```py
loaded_udf = fused.load("https://github.com/fusedio/udfs/tree/main/public/Building_Tile_Example")
fused.run(loaded_udf, bbox=bbox)
```
Run a UDF saved in a local directory:
```py
loaded_udf = fused.load("/Users/local/dir/Building_Tile_Example")
fused.run(loaded_udf, bbox=bbox)
```
This function dynamically determines the execution path and parameters based on the inputs.
It is designed to be flexible and support various UDF execution scenarios.
- Regular users can use any storage paths they have access to
- Datasets are registered as private (only accessible to your team)
- Files are automatically queued for metadata extraction
This function always executes asynchronously. For synchronous execution, use run().
It uses the same parameter validation and UDF resolution logic as run().
---
================================================================================
# CLI REFERENCE
## fused canvas
Path: cli/canvas.mdx
URL: https://docs.fused.io/cli/canvas
# `fused canvas`
Manage canvases.
```
fused canvas [SUBCOMMAND] [OPTIONS]
```
## Subcommands
| Subcommand | Description |
|---|---|
| `create` | Create a new canvas. |
| `delete` | Delete a canvas by name or ID. |
| `export` | Download a canvas as a zip bundle. |
| `list` | List canvas names or show a single canvas by name/ID. |
| `pull` | Download a canvas TOML zip (same as `export`) and extract it locally. |
| `push` | Import a local canvas directory into a canvas. |
| `rename` | Rename a canvas. |
| `serve-mcp` | Serve a shared canvas OpenAPI as a local MCP server. |
| `share` | Share a canvas and return its shareable URL. |
| `unshare` | Unshare a canvas and return updated metadata. |
| `validate` | Validate a canvas directory without running any UDFs. |
## `fused canvas create`
Create a new canvas.
```
fused canvas create NAME
```
## `fused canvas delete`
Delete a canvas by name or ID.
```
fused canvas delete CANVAS_REF [OPTIONS]
```
**Options**
| Flag | Description |
|---|---|
| `--id` | Treat the provided reference as a canvas ID. |
## `fused canvas export`
Download a canvas as a zip bundle.
```
fused canvas ```
**Options**
| Flag | Description |
|---|---|
| `--output FILENAME` | Path to write the downloaded zip bundle. |
| `--team` | Treat the provided reference as a team canvas name. |
| `--id` | Treat the provided reference as a canvas ID. |
## `fused canvas list`
List canvas names or show a single canvas by name/ID.
```
fused canvas list [CANVAS_REF] [OPTIONS]
```
**Options**
| Flag | Description |
|---|---|
| `--team` | Treat the provided name as a team canvas name. |
| `--id` | Treat the provided reference as a canvas ID. |
## `fused canvas pull`
Download a canvas TOML zip (same as `export`) and extract it locally.
```
fused canvas pull CANVAS_REF [OPTIONS]
```
**Options**
| Flag | Description |
|---|---|
| `--output, -o DIRECTORY` | Directory to extract into (default: sanitized canvas name). |
| `--team` | Treat the provided reference as a team canvas name. |
| `--id` | Treat the provided reference as a canvas ID. |
| `--force, -f` | Overwrite existing files and remove local-only files without prompting. |
| `--dry-run, -n` | Show actions and diffs without writing files. |
| `--show-diff` | Print a unified diff for each file write or removal as it is applied. |
## `fused canvas push`
Import a local canvas directory into a canvas.
```
fused canvas push SOURCE_DIR [OPTIONS]
```
**Options**
| Flag | Description |
|---|---|
| `--canvas TEXT` | Canvas name to push. |
| `--id` | Treat the provided reference as a canvas ID. |
| `--no-ignore` | Include gitignored and .fusedignore files in the push. |
| `--no-validate` | Skip pre-push canvas validation. |
## `fused canvas rename`
Rename a canvas.
```
fused canvas rename CANVAS_REF NEW_NAME [OPTIONS]
```
**Options**
| Flag | Description |
|---|---|
| `--id` | Treat the provided reference as a canvas ID. |
## `fused canvas serve-mcp`
Serve a shared canvas OpenAPI as a local MCP server.
```
fused canvas serve-mcp CANVAS_REF [OPTIONS]
```
**Options**
| Flag | Description |
|---|---|
| `--token` | Treat the provided reference as a shared canvas token (fc_...). |
| `--team` | Treat the provided reference as a team canvas name. |
| `--id` | Treat the provided reference as a canvas ID. |
| `--host TEXT` | Host interface to bind the local MCP server to. (default: `127.0.0.1`) |
| `--port INTEGER` | Port to bind the local MCP server to. (default: `8765`) |
| `--path TEXT` | URL path to serve the MCP endpoint on. (default: `/mcp`) |
| `--claude` | Register this MCP server with Claude Code via the `claude` CLI. |
## `fused canvas share`
Share a canvas and return its shareable URL.
```
fused canvas share CANVAS_REF [OPTIONS]
```
**Options**
| Flag | Description |
|---|---|
| `--client-id TEXT` | Override realtime client ID for share token generation. |
| `--new-token` | Generate a new share token instead of reusing the existing one. This immediately invalidates the previous token, so any already-distributed link or embed stops working. |
| `--id` | Treat the provided reference as a canvas ID. |
## `fused canvas unshare`
Unshare a canvas and return updated metadata.
```
fused canvas unshare CANVAS_REF [OPTIONS]
```
**Options**
| Flag | Description |
|---|---|
| `--id` | Treat the provided reference as a canvas ID. |
## `fused canvas validate`
Validate a canvas directory without running any UDFs.
```
fused canvas validate CANVAS_DIR [OPTIONS]
```
**Options**
| Flag | Description |
|---|---|
| `--skip TEXT` | Skip a named check. Repeatable. Checks: node_files, edge_refs, orphaned_files, widget_json_parse, widget_refs, widget_params. |
================================================================================
## fused checkpoint
Path: cli/checkpoint.mdx
URL: https://docs.fused.io/cli/checkpoint
# `fused checkpoint`
Manage canvas checkpoints.
```
fused checkpoint [SUBCOMMAND] [OPTIONS]
```
## Subcommands
| Subcommand | Description |
|---|---|
| `create` | Create a checkpoint of a canvas's current state. |
| `list` | List all checkpoints for a canvas. |
| `pr` | Open a GitHub PR from an existing checkpoint. |
| `restore` | Restore a canvas from a checkpoint. |
## `fused checkpoint create`
Create a checkpoint of a canvas's current state.
```
fused checkpoint create CANVAS_REF [OPTIONS]
```
**Options**
| Flag | Description |
|---|---|
| `--name TEXT` | Custom checkpoint name. If not provided, auto-generates a timestamp-based name. |
| `--id` | Treat the provided reference as a canvas ID. |
## `fused checkpoint list`
List all checkpoints for a canvas.
```
fused checkpoint list CANVAS_REF [OPTIONS]
```
**Options**
| Flag | Description |
|---|---|
| `--id` | Treat the provided reference as a canvas ID. |
## `fused checkpoint pr`
Open a GitHub PR from an existing checkpoint.
```
fused checkpoint pr CANVAS_REF CHECKPOINT_NAME [OPTIONS]
```
**Options**
| Flag | Description |
|---|---|
| `--message, -m TEXT` | Commit message / PR title. |
| `--id` | Treat the provided reference as a canvas ID. |
| `--repo TEXT` | Target GitHub repository (owner/repo). Defaults to the canvas's gitRepo. |
| `--path TEXT` | Target folder within the repo. Defaults to the canvas's folderName. |
| `--share [public\|team]` | Share access scope for the canvas. |
| `--share-token TEXT` | Vanity share token name (requires --share). |
## `fused checkpoint restore`
Restore a canvas from a checkpoint.
```
fused checkpoint restore CANVAS_REF CHECKPOINT_NAME [OPTIONS]
```
**Options**
| Flag | Description |
|---|---|
| `--id` | Treat the provided reference as a canvas ID. |
| `--no-backup` | Skip creating a safety backup before restore. |
================================================================================
## fused claude
Path: cli/claude.mdx
URL: https://docs.fused.io/cli/claude
# `fused claude`
Manage Fused for Claude Code (via the `claude` CLI).
```
fused claude [SUBCOMMAND] [OPTIONS]
```
## Subcommands
| Subcommand | Description |
|---|---|
| `add-mcp` | Add a canvas MCP server to Claude Code. |
| `plugin` | Add, update, or remove the Fused Claude plugin. |
## `fused claude add-mcp`
Add a canvas MCP server to Claude Code.
```
fused claude add-mcp CANVAS_REF [OPTIONS]
```
**Options**
| Flag | Description |
|---|---|
| `--token` | Treat the provided reference as a shared canvas token (fc_...). |
| `--team` | Treat the provided reference as a team canvas name. |
| `--id` | Treat the provided reference as a canvas ID. |
| `--create-session-token / --no-create-session-token` | Create a session token for team-scoped canvases when none is passed. (default: `True`) |
| `--session-max-age TEXT` | Lifetime for --create-session-token (e.g. 30m, 1h, 1d). (default: `1h`) |
## `fused claude plugin`
Add, update, or remove the Fused Claude plugin.
| Subcommand | Description |
|---|---|
| `add` | Register the marketplace and install fused@fused-marketplace. |
| `remove` | Remove the fused plugin. |
| `update` | Update fused@fused-marketplace. |
### `fused claude plugin add`
Register the marketplace and install fused@fused-marketplace.
```
fused claude plugin add
```
### `fused claude plugin remove`
Remove the fused plugin.
```
fused claude plugin remove
```
### `fused claude plugin update`
Update fused@fused-marketplace.
```
fused claude plugin update
```
================================================================================
## fused completion
Path: cli/completion.mdx
URL: https://docs.fused.io/cli/completion
# `fused completion`
Print or install shell tab completion for the fused CLI.
```
fused completion [SUBCOMMAND] [OPTIONS]
```
## Subcommands
| Subcommand | Description |
|---|---|
| `install` | Append a one-liner to ~/.bashrc or ~/.zshrc, or write fish's completion file. |
| `print` | Print a completion script suitable for eval or for fish's completions directory. |
## `fused completion install`
Append a one-liner to ~/.bashrc or ~/.zshrc, or write fish's completion file.
```
fused completion install [OPTIONS]
```
**Options**
| Flag | Description |
|---|---|
| `--shell [auto\|bash\|zsh\|fish]` | Target shell (default: infer from $SHELL). (default: `auto`) |
| `--dry-run` | Show actions without writing files. |
| `--yes, -y` | Do not prompt before modifying shell config files. |
## `fused completion print`
Print a completion script suitable for eval or for fish's completions directory.
```
fused completion print SHELL
```
================================================================================
## fused cronjob
Path: cli/cronjob.mdx
URL: https://docs.fused.io/cli/cronjob
# `fused cronjob`
Manage scheduled UDF runs.
```
fused cronjob [SUBCOMMAND] [OPTIONS]
```
## Subcommands
| Subcommand | Description |
|---|---|
| `create` | Create or update a cronjob for a UDF. |
| `delete` | Delete a cronjob (unschedule the UDF). |
| `get` | Get a cronjob by UDF reference or cronjob UUID. |
| `list` | List cronjobs for the team, or filter by UDF. |
| `run` | Trigger an immediate run of a cronjob. |
| `update` | Update a cronjob schedule or arguments (partial updates). |
## `fused cronjob create`
Create or update a cronjob for a UDF.
```
fused cronjob create CANVAS UDF [OPTIONS]
```
**Options**
| Flag | Description |
|---|---|
| `--minute INT_LIST` | Minute (0-59); exactly one value. Repeat the flag and/or use comma-separated values. |
| `--hour INT_LIST` | Hour (0-23). Repeat the flag and/or use comma-separated values. |
| `--day-of-month INT_LIST` | Day of month (1-31); omit for every day. Repeat the flag and/or use comma-separated values. |
| `--month INT_LIST` | Month (1-12); omit for every month. Repeat the flag and/or use comma-separated values. |
| `--day-of-week INT_LIST` | Day of week (0=Sunday); omit for every day. Repeat the flag and/or use comma-separated values. |
| `--udf-args TEXT` | JSON object of arguments passed to the UDF when the schedule runs. |
| `--disabled` | Disable the schedule. |
| `--enabled` | Enable the schedule. |
| `--no-create-udf` | Do not call to_fused(); UDF must already be saved on the server. |
## `fused cronjob delete`
Delete a cronjob (unschedule the UDF).
```
fused cronjob delete [CANVAS] [UDF] [OPTIONS]
```
**Options**
| Flag | Description |
|---|---|
| `--id` | Treat the first argument as a cronjob UUID instead of CANVAS. |
## `fused cronjob get`
Get a cronjob by UDF reference or cronjob UUID.
```
fused cronjob get [CANVAS] [UDF] [OPTIONS]
```
**Options**
| Flag | Description |
|---|---|
| `--id` | Treat the first argument as a cronjob UUID instead of CANVAS. |
## `fused cronjob list`
List cronjobs for the team, or filter by UDF.
```
fused cronjob list [CANVAS] [UDF] [OPTIONS]
```
**Options**
| Flag | Description |
|---|---|
| `--udf-id TEXT` | Filter by backend UDF ID (cannot combine with CANVAS UDF). |
## `fused cronjob run`
Trigger an immediate run of a cronjob.
```
fused cronjob run [CANVAS] [UDF] [OPTIONS]
```
**Options**
| Flag | Description |
|---|---|
| `--id` | Treat the first argument as a cronjob UUID instead of CANVAS. |
## `fused cronjob update`
Update a cronjob schedule or arguments (partial updates).
```
fused cronjob update [CANVAS] [UDF] [OPTIONS]
```
**Options**
| Flag | Description |
|---|---|
| `--id` | Treat the first argument as a cronjob UUID instead of CANVAS. |
| `--day-of-week INT_LIST` | Day of week (0=Sunday, 6=Saturday). Repeat the flag and/or use comma-separated values. |
| `--month INT_LIST` | Month (1-12). Repeat the flag and/or use comma-separated values. |
| `--day-of-month INT_LIST` | Day of month (1-31). Repeat the flag and/or use comma-separated values. |
| `--hour INT_LIST` | Hour (0-23). Repeat the flag and/or use comma-separated values. |
| `--minute INT_LIST` | Minute (0-59); exactly one value. Repeat the flag and/or use comma-separated values. |
| `--udf-args TEXT` | JSON object of arguments passed to the UDF when the schedule runs. |
| `--disabled` | Disable the schedule. |
| `--enabled` | Enable the schedule. |
================================================================================
## fused files
Path: cli/files.mdx
URL: https://docs.fused.io/cli/files
# `fused files`
Manage files stored in Fused.
```
fused files [SUBCOMMAND] [OPTIONS]
```
## Subcommands
| Subcommand | Description |
|---|---|
| `delete` | Delete a remote file or prefix. |
| `download` | Download a remote file or directory to a local path. |
| `get` | Fetch a remote file into memory and print it. |
| `list` | List files at a remote path. |
| `search` | Search the bucket object index for files in cloud storage. |
| `sign_url` | Create a signed URL for a remote path. |
| `upload` | Upload a local file or directory to a remote path. |
## `fused files delete`
Delete a remote file or prefix.
```
fused files delete PATH [OPTIONS]
```
**Options**
| Flag | Description |
|---|---|
| `--max-deletion-depth TEXT` | Maximum recursive deletion depth, or "unlimited". (default: `3`) |
## `fused files download`
Download a remote file or directory to a local path.
```
fused files download PATH LOCAL_PATH [OPTIONS]
```
**Options**
| Flag | Description |
|---|---|
| `--recursive, -r` | Download a remote directory prefix and all nested files. |
| `--dry-run` | With --recursive, list remote→local paths without writing files. |
## `fused files get`
Fetch a remote file into memory and print it.
```
fused files get PATH
```
## `fused files list`
List files at a remote path.
```
fused files list PATH [OPTIONS]
```
**Options**
| Flag | Description |
|---|---|
| `--details` | Include metadata details in the listing output. |
| `--recursive, -r` | List all nested files under the path (directories are traversed only). |
## `fused files search`
Search the bucket object index for files in cloud storage.
```
fused files search [PATH_AND_QUERY...] [OPTIONS]
```
**Options**
| Flag | Description |
|---|---|
| `--count` | Return only the number of matching objects (JSON: \). |
| `--prefix TEXT` | Registered index prefix (which index table to use). Default: first segment of PATH, e.g. team_name/ from s3://fused-users/team_name/... |
| `--key-prefix TEXT` | Only return object keys starting with this prefix. Default: directory portion of PATH. |
| `--limit INTEGER` | Max rows to return (ignored with --count). (default: `100`) |
| `--offset INTEGER` | Pagination offset (ignored with --count). (default: `0`) |
## `fused files sign_url`
Create a signed URL for a remote path.
```
fused files sign_url PATH
```
## `fused files upload`
Upload a local file or directory to a remote path.
```
fused files upload LOCAL_PATH REMOTE_PATH [OPTIONS]
```
**Options**
| Flag | Description |
|---|---|
| `--timeout FLOAT` | Optional request timeout in seconds. |
| `--recursive, -r` | Upload a local directory tree to a remote prefix (relative paths preserved). |
| `--dry-run` | With --recursive, list local→remote paths without uploading. |
================================================================================
## fused integrations
Path: cli/integrations.mdx
URL: https://docs.fused.io/cli/integrations
# `fused integrations`
Manage third-party integrations in Fused.
```
fused integrations [SUBCOMMAND] [OPTIONS]
```
## Subcommands
| Subcommand | Description |
|---|---|
| `airtable` | Manage Airtable integration OAuth and tokens. |
| `dropbox` | Manage Dropbox integration OAuth, tokens, and revoke for dropbox:// paths. |
| `google-drive` | (Alias: gdrive) Manage Google Drive integration OAuth, tokens, revoke, and terminal pick for gdrive:// paths. |
| `hubspot` | Manage HubSpot integration OAuth and tokens. |
| `list` | List integrations and their connection status. |
| `notion` | Manage Notion integration OAuth and tokens. |
| `onedrive` | Manage OneDrive integration OAuth, tokens, and revoke for onedrive:// paths. |
| `snowflake` | Manage Snowflake integration OAuth and tokens. |
## `fused integrations airtable`
Manage Airtable integration OAuth and tokens.
| Subcommand | Description |
|---|---|
| `connect` | Start OAuth and print the authorization URL. |
| `revoke` | Disconnect this provider and remove stored tokens. |
| `token` | Print a short-lived access token for this provider (sensitive output). |
### `fused integrations airtable connect`
Start OAuth and print the authorization URL.
```
fused integrations airtable connect [OPTIONS]
```
**Options**
| Flag | Description |
|---|---|
| `--open / --no-open` | Open the OAuth URL in your default browser. When omitted, opens automatically in text mode if stdout is a tty. |
### `fused integrations airtable revoke`
Disconnect this provider and remove stored tokens.
```
fused integrations airtable revoke
```
### `fused integrations airtable token`
Print a short-lived access token for this provider (sensitive output).
```
fused integrations airtable token
```
## `fused integrations dropbox`
Manage Dropbox integration OAuth, tokens, and revoke for dropbox:// paths.
| Subcommand | Description |
|---|---|
| `connect` | Start OAuth and print the authorization URL. |
| `revoke` | Disconnect this provider and remove stored tokens. |
| `token` | Print a short-lived access token for this provider (sensitive output). |
### `fused integrations dropbox connect`
Start OAuth and print the authorization URL.
```
fused integrations dropbox connect [OPTIONS]
```
**Options**
| Flag | Description |
|---|---|
| `--open / --no-open` | Open the OAuth URL in your default browser. When omitted, opens automatically in text mode if stdout is a tty. |
### `fused integrations dropbox revoke`
Disconnect this provider and remove stored tokens.
```
fused integrations dropbox revoke
```
### `fused integrations dropbox token`
Print a short-lived access token for this provider (sensitive output).
```
fused integrations dropbox token
```
## `fused integrations google-drive`
(Alias: gdrive) Manage Google Drive integration OAuth, tokens, revoke, and terminal pick for gdrive:// paths.
| Subcommand | Description |
|---|---|
| `connect` | Start OAuth and print the authorization URL. |
| `revoke` | Disconnect this provider and remove stored tokens. |
| `token` | Print a short-lived access token for this provider (sensitive output). |
### `fused integrations google-drive connect`
Start OAuth and print the authorization URL.
```
fused integrations google-drive connect [OPTIONS]
```
**Options**
| Flag | Description |
|---|---|
| `--open / --no-open` | Open the OAuth URL in your default browser. When omitted, opens automatically in text mode if stdout is a tty. |
### `fused integrations google-drive revoke`
Disconnect this provider and remove stored tokens.
```
fused integrations google-drive revoke
```
### `fused integrations google-drive token`
Print a short-lived access token for this provider (sensitive output).
```
fused integrations google-drive token
```
## `fused integrations hubspot`
Manage HubSpot integration OAuth and tokens.
| Subcommand | Description |
|---|---|
| `connect` | Start OAuth and print the authorization URL. |
| `revoke` | Disconnect this provider and remove stored tokens. |
| `token` | Print a short-lived access token for this provider (sensitive output). |
### `fused integrations hubspot connect`
Start OAuth and print the authorization URL.
```
fused integrations hubspot connect [OPTIONS]
```
**Options**
| Flag | Description |
|---|---|
| `--open / --no-open` | Open the OAuth URL in your default browser. When omitted, opens automatically in text mode if stdout is a tty. |
### `fused integrations hubspot revoke`
Disconnect this provider and remove stored tokens.
```
fused integrations hubspot revoke
```
### `fused integrations hubspot token`
Print a short-lived access token for this provider (sensitive output).
```
fused integrations hubspot token
```
## `fused integrations list`
List integrations and their connection status.
```
fused integrations list
```
## `fused integrations notion`
Manage Notion integration OAuth and tokens.
| Subcommand | Description |
|---|---|
| `connect` | Start OAuth and print the authorization URL. |
| `revoke` | Disconnect this provider and remove stored tokens. |
| `token` | Print a short-lived access token for this provider (sensitive output). |
### `fused integrations notion connect`
Start OAuth and print the authorization URL.
```
fused integrations notion connect [OPTIONS]
```
**Options**
| Flag | Description |
|---|---|
| `--open / --no-open` | Open the OAuth URL in your default browser. When omitted, opens automatically in text mode if stdout is a tty. |
### `fused integrations notion revoke`
Disconnect this provider and remove stored tokens.
```
fused integrations notion revoke
```
### `fused integrations notion token`
Print a short-lived access token for this provider (sensitive output).
```
fused integrations notion token
```
## `fused integrations onedrive`
Manage OneDrive integration OAuth, tokens, and revoke for onedrive:// paths.
| Subcommand | Description |
|---|---|
| `connect` | Start OAuth and print the authorization URL. |
| `revoke` | Disconnect this provider and remove stored tokens. |
| `token` | Print a short-lived access token for this provider (sensitive output). |
### `fused integrations onedrive connect`
Start OAuth and print the authorization URL.
```
fused integrations onedrive connect [OPTIONS]
```
**Options**
| Flag | Description |
|---|---|
| `--open / --no-open` | Open the OAuth URL in your default browser. When omitted, opens automatically in text mode if stdout is a tty. |
### `fused integrations onedrive revoke`
Disconnect this provider and remove stored tokens.
```
fused integrations onedrive revoke
```
### `fused integrations onedrive token`
Print a short-lived access token for this provider (sensitive output).
```
fused integrations onedrive token
```
## `fused integrations snowflake`
Manage Snowflake integration OAuth and tokens.
| Subcommand | Description |
|---|---|
| `connect` | Start Snowflake OAuth and print the authorization URL. |
| `revoke` | Disconnect this provider and remove stored tokens. |
| `token` | Print a short-lived access token for this provider (sensitive output). |
### `fused integrations snowflake connect`
Start Snowflake OAuth and print the authorization URL.
```
fused integrations snowflake connect [OPTIONS]
```
**Options**
| Flag | Description |
|---|---|
| `--account-identifier TEXT` | Snowflake account identifier. |
| `--client-id TEXT` | Snowflake OAuth client ID. |
| `--client-secret TEXT` | Snowflake OAuth client secret. |
| `--client-secret-2 TEXT` | Optional Snowflake OAuth client secret 2 for key rotation. |
| `--open / --no-open` | Open the OAuth URL in your default browser. When omitted, opens automatically in text mode if stdout is a tty. |
### `fused integrations snowflake revoke`
Disconnect this provider and remove stored tokens.
```
fused integrations snowflake revoke
```
### `fused integrations snowflake token`
Print a short-lived access token for this provider (sensitive output).
```
fused integrations snowflake token
```
================================================================================
## fused json-ui
Path: cli/json-ui.mdx
URL: https://docs.fused.io/cli/json-ui
# `fused json-ui`
Inspect and run JSON-UI widgets.
```
fused json-ui [SUBCOMMAND] [OPTIONS]
```
## Subcommands
| Subcommand | Description |
|---|---|
| `catalog-prompt` | Fetch the JSON-UI catalog prompt. |
| `run-inline-widget` | Open a share URL with an inline widget query and capture a screenshot. |
| `run-shared-widget` | Open a shared widget page and capture a screenshot. |
| `schemas` | Fetch JSON-UI schemas for components or for all components. |
| `validate` | Validate inline JSON5 config text or a JSON/JSON5 file path. |
## `fused json-ui catalog-prompt`
Fetch the JSON-UI catalog prompt.
```
fused json-ui catalog-prompt
```
## `fused json-ui run-inline-widget`
Open a share URL with an inline widget query and capture a screenshot.
```
fused json-ui run-inline-widget CANVAS_SHARE_TOKEN WIDGET_CONFIG [OPTIONS]
```
**Options**
| Flag | Description |
|---|---|
| `--print-url-only` | Print the widget URL and exit without launching a browser or screenshotting. |
| `--browser [chrome\|firefox]` | Headless browser to use for screenshotting. (default: `chrome`) |
| `--wait INTEGER` | Seconds to sleep after canvas loading settles before capture. (default: `2`) |
| `--screenshot-filename FILENAME` | Save the screenshot to the given file. It should be a PNG file path. |
## `fused json-ui run-shared-widget`
Open a shared widget page and capture a screenshot.
```
fused json-ui run-shared-widget CANVAS_SHARE_TOKEN WIDGET_NAME [OPTIONS]
```
**Options**
| Flag | Description |
|---|---|
| `--print-url-only` | Print the widget URL and exit without launching a browser or screenshotting. |
| `--browser [chrome\|firefox]` | Headless browser to use for screenshotting. (default: `chrome`) |
| `--wait INTEGER` | Seconds to sleep after canvas loading settles before capture. (default: `2`) |
| `--screenshot-filename FILENAME` | Save the screenshot to the given file. It should be a PNG file path. |
## `fused json-ui schemas`
Fetch JSON-UI schemas for components or for all components.
```
fused json-ui schemas [COMPONENTS...]
```
## `fused json-ui validate`
Validate inline JSON5 config text or a JSON/JSON5 file path.
```
fused json-ui validate CONFIG_OR_PATH
```
================================================================================
## fused login
Path: cli/login.mdx
URL: https://docs.fused.io/cli/login
# `fused login`
Authenticate and persist credentials.
```
fused login
```
================================================================================
## fused logout
Path: cli/logout.mdx
URL: https://docs.fused.io/cli/logout
# `fused logout`
Log out and clear local credentials.
```
fused logout
```
================================================================================
## CLI Reference
Path: cli/overview.mdx
URL: https://docs.fused.io/cli/overview
# CLI Reference
The `fused` CLI lets you manage Fused from your terminal — run UDFs, manage canvases and files, handle secrets, and connect integrations. Install it with the `fused` package:
```bash
pip install --upgrade fused
```
## Global flags
These flags apply to every command:
| Flag | Env var | Description |
|---|---|---|
| `--env TEXT` | `FUSED_ENV` | Override the Fused environment. |
| `--format [json\|text]` | `FUSED_CLI_FORMAT` | Output format for command results (json or text). |
## Commands
| Command | Description |
|---|---|
| `fused canvas` | Manage canvases. |
| `fused checkpoint` | Manage canvas checkpoints. |
| `fused claude` | Manage Fused for Claude Code (via the `claude` CLI). |
| `fused completion` | Print or install shell tab completion for the fused CLI. |
| `fused cronjob` | Manage scheduled UDF runs. |
| `fused files` | Manage files stored in Fused. |
| `fused integrations` | Manage third-party integrations in Fused. |
| `fused json-ui` | Inspect and run JSON-UI widgets. |
| `fused login` | Authenticate and persist credentials. |
| `fused logout` | Log out and clear local credentials. |
| `fused run` | Run a UDF and print the result. |
| `fused secrets` | Manage kernel and user secrets. |
| `fused udf` | Search and manage UDFs. |
| `fused udf-schema` | Print the API schema for a UDF. |
| `fused whoami` | Show info about the authenticated user or team. |
================================================================================
## fused run
Path: cli/run.mdx
URL: https://docs.fused.io/cli/run
# `fused run`
Run a UDF and print the result.
```
fused run CANVAS [UDF] [OPTIONS]
```
## Options
| Flag | Description |
|---|---|
| `--engine [remote\|local]` | Execution engine to use. |
| `--instance_type, --instance-type TEXT` | Remote instance type override. |
| `--max_retry, --max-retry INTEGER` | Maximum retry attempts for failed runs. (default: `0`) |
| `--cache_max_age, --cache-max-age TEXT` | Maximum cache age duration (for example 10s, 5m, 1h). |
| `--cache / --no-cache` | Enable or disable result cache usage. (default: `True`) |
| `--disk_size_gb, --disk-size-gb INTEGER` | Disk size in GB for supported remote runtimes. |
| `--stdin` | Read UDF source code from standard input (same as passing multiline code to fused.load). |
| `--verbose / --no-verbose` | Show UDF stdout/stderr from the runtime (default: on). (default: `True`) |
| `--profile / --no-profile` | Collect and print lineprofile timings annotated against UDF source. |
| `--output_file, --output-file FILENAME` | Write the result to a file. |
| `--team` | Treat the provided reference as a team canvas name. |
| `--id` | Treat the provided reference as a canvas ID. |
================================================================================
## fused secrets
Path: cli/secrets.mdx
URL: https://docs.fused.io/cli/secrets
# `fused secrets`
Manage kernel and user secrets.
```
fused secrets [SUBCOMMAND] [OPTIONS]
```
## Subcommands
| Subcommand | Description |
|---|---|
| `delete` | Delete a kernel secret by key. |
| `get` | Get a secret value by key. |
| `list` | List secret keys. |
| `set` | Set a kernel secret value. |
## `fused secrets delete`
Delete a kernel secret by key.
```
fused secrets delete KEY [OPTIONS]
```
**Options**
| Flag | Description |
|---|---|
| `--client-id TEXT` | Override kernel client ID when deleting kernel secrets. |
| `--user` | Rejected: user secrets are read-only. |
## `fused secrets get`
Get a secret value by key.
```
fused secrets get KEY [OPTIONS]
```
**Options**
| Flag | Description |
|---|---|
| `--user` | Read a user-owned secret instead of a kernel secret. |
| `--client-id TEXT` | Override kernel client ID when reading kernel secrets. |
## `fused secrets list`
List secret keys.
```
fused secrets list [OPTIONS]
```
**Options**
| Flag | Description |
|---|---|
| `--user` | List user-owned secrets instead of kernel secrets. |
| `--client-id TEXT` | Override kernel client ID when listing kernel secrets. |
## `fused secrets set`
Set a kernel secret value.
```
fused secrets set KEY VALUE [OPTIONS]
```
**Options**
| Flag | Description |
|---|---|
| `--client-id TEXT` | Override kernel client ID when writing kernel secrets. |
| `--user` | Rejected: user secrets are read-only. |
================================================================================
## fused udf-schema
Path: cli/udf-schema.mdx
URL: https://docs.fused.io/cli/udf-schema
# `fused udf-schema`
Print the API schema for a UDF.
```
fused udf-schema CANVAS [UDF] [OPTIONS]
```
## Options
| Flag | Description |
|---|---|
| `--stdin` | Read UDF source code from standard input (same as passing multiline code to fused.load). |
| `--team` | Treat the provided reference as a team canvas name. |
| `--id` | Treat the provided reference as a canvas ID. |
================================================================================
## fused udf
Path: cli/udf.mdx
URL: https://docs.fused.io/cli/udf
# `fused udf`
Search and manage UDFs.
```
fused udf [SUBCOMMAND] [OPTIONS]
```
## Subcommands
| Subcommand | Description |
|---|---|
| `search` | Search UDFs by natural language query. |
## `fused udf search`
Search UDFs by natural language query.
```
fused udf search QUERY [OPTIONS]
```
**Options**
| Flag | Description |
|---|---|
| `--top-k INTEGER` | Number of results to return from each source. (default: `5`) |
| `--mode [all\|user\|public]` | Which UDF sources to search: user (personal), public (community), or all. (default: `all`) |
================================================================================
## fused whoami
Path: cli/whoami.mdx
URL: https://docs.fused.io/cli/whoami
# `fused whoami`
Show info about the authenticated user or team.
```
fused whoami [OPTIONS]
```
## Options
| Flag | Description |
|---|---|
| `--team` | Show info about the authenticated team. |
================================================================================
# REST API
## Account
Path: rest-api/account.mdx
URL: https://docs.fused.io/rest-api/account
# Account
Endpoints for the user behind a `Bearer` token. For the team-level container, see Environment.
## Get the signed-in user
```
GET /user/self
```
**Scope:** user
Resolves the credentials to a user record — the REST equivalent of `fused.api.whoami()` and `fused whoami`.
| Field | Type | Description |
|---|---|---|
| `id` | string | User id |
| `name` | string | Display name |
| `email` | string \| null | Email address |
| `handle` | string \| null | Public handle, used in canvas and UDF URLs |
| `execution_environment_id` | string \| null | Environment the user belongs to |
| `signup_date` | string \| null | Signup timestamp |
| `handle_last_changed` | string \| null | When the handle was last changed |
This endpoint requires a `Bearer` token. A service account token resolves to an environment rather than a user, so it returns `403 Forbidden` — use `GET /execution-env/self` instead.
## Update the signed-in user
```
POST /user/self
```
**Scope:** user
Updates your own profile. Only two fields may be changed:
| Field | Type | Description |
|---|---|---|
| `name` | string | Display name |
| `handle` | string | Public handle |
```bash
curl -X POST \
-H "Authorization: Bearer $FUSED_ACCESS_TOKEN" \
-H "Content-Type: application/json" \
-d '' \
"https://www.fused.io/server/v1/user/self"
```
Handle changes are validated:
| Status | Cause |
|---|---|
| `409 Conflict` | The handle is already taken, or is reserved |
| `422 Unprocessable Entity` | The handle is an empty string |
| `401 Unauthorized` | The request attempted to change a field you may not set — anything other than `name` and `handle` |
Your handle appears in canvas and UDF URLs. Changing it can break links that address your work by handle.
## See also
- Environment — the team-level container and its service accounts
- `fused whoami` — the CLI equivalent
================================================================================
## Batch jobs
Path: rest-api/batch-jobs.mdx
URL: https://docs.fused.io/rest-api/batch-jobs
# Batch jobs
Batch jobs run long or large workloads on dedicated instances, rather than on the real-time engine. Each job gets an id you use to poll status, list results, and read logs.
In Python, this endpoint is `FusedAPI.start_job()`; ingestion jobs reach it through `job.run_batch()`, which calls `start_job` internally.
`udf.map()` is a different mechanism. It fans a UDF out across the real-time engine rather than submitting a batch job, so the jobs it creates do not appear in these endpoints.
## The job object
Job endpoints return one of two shapes — the submit and status endpoints return a run summary, the listing endpoints return a job record. These fields are common to both:
| Field | Type | Description |
|---|---|---|
| `instance_id` | string \| null | Instance running the job |
| `instance_type` | string \| null | Instance type |
| `disk_size_gb` | integer \| null | Attached disk size |
| `job_status` | string \| null | Current status |
| `job_status_date` | string \| null | Timestamp of the last status change |
| `first_heartbeat` | string \| null | First heartbeat timestamp |
| `last_heartbeat` | string \| null | Most recent heartbeat timestamp |
## Submit a job
```
POST /run
```
**Scope:** user or environment
**Query parameters**
| Parameter | Type | Description |
|---|---|---|
| `instance_type` | string | Instance type to run on |
| `disk_size_gb` | integer | Disk size to attach |
| `region` | string | Region to run in |
**Body**
| Field | Type | Required | Description |
|---|---|---|---|
| `config` | object | Yes | The job configuration |
| `send_status_email` | boolean | No | Email on completion. Defaults to `true`. |
| `cache_max_age` | integer | No | Reuse a cached job result younger than this, in seconds |
`config` is a large nested structure describing the steps to run. Build it with the Python SDK (`FusedAPI.start_job()`) rather than by hand.
Returns the job object. When `cache_max_age` matches a recent identical job, the cached job's response is returned instead of starting new work.
## Get job status
```
GET /run/by-id/
```
**Scope:** environment
Returns the current job object. Poll this until the job reaches a terminal status.
## Cancel a job
```
POST /run/by-id//cancel
```
**Scope:** environment
Terminates the job and its instance, and records a `CANCELED` status. Returns the updated job object, or `400 Bad Request` if the job already finished or was canceled.
## List job results
```
GET /run/by-id//results
```
**Scope:** environment
Lists the output objects the job wrote to cloud storage. Returns an object listing.
## List your jobs
```
GET /job/self
```
**Scope:** user
Jobs created by the signed-in user, newest first.
**Query parameters**
| Parameter | Type | Description |
|---|---|---|
| `skip` | integer | Offset. Default `0`. |
| `limit` | integer | Page size. Default `300`. |
This endpoint is user-scoped — a service account token has no user identity and is rejected. For automation, use the team-wide listing below.
## List your team's jobs
```
GET /job/my-execution-env
```
**Scope:** environment
Every job in your execution environment, across all team members, newest first. Accepts the same `skip` and `limit` parameters.
## Get a job
```
GET /job/by-id/
```
**Scope:** environment
Returns the job record for one job. Returns `404 Not Found` if the job is not in your environment.
## Get a job's configuration
```
GET /job/by-id//config
```
**Scope:** environment
Returns the configuration the job was submitted with — useful for reproducing a run. Returns `400 Bad Request` if the job has no stored config.
The response may be either the config JSON inline or a redirect to cloud storage, depending on how the job was recorded. Follow redirects.
## Get a job's status history
```
GET /job/events/by-job-id/
```
**Scope:** environment
Returns the job's status transitions, each with `id`, `job_id`, `job_status`, `job_status_description`, and `date_updated`. Useful for seeing where a failed job stalled.
## Read job logs
```
GET /logs/
```
**Scope:** environment
All log lines for the job, in chronological order.
**Query parameters**
| Parameter | Type | Description |
|---|---|---|
| `since_ms` | integer | Only return lines newer than this epoch-milliseconds timestamp |
| `region` | string | Region the job ran in |
### Tail job logs
```
GET /logs//tail
```
**Scope:** environment
The most recent lines, in reverse-chronological order — better for polling a running job.
**Query parameters**
| Parameter | Type | Description |
|---|---|---|
| `limit` | integer | Number of lines to return. Default `1000`. |
| `region` | string | Region the job ran in |
## See also
- `fused.api` — submitting and tracking the same jobs from Python
- `fused.ingest` — running an ingestion job as a batch job
- File system paths — where batch jobs write logs and results
================================================================================
## Canvases
Path: rest-api/canvases.mdx
URL: https://docs.fused.io/rest-api/canvases
# Canvases
A canvas groups UDFs and controls how they are shared. In the API a canvas is a **collection** — the paths use `/collection`, but the product calls them canvases.
Sharing is per canvas: every UDF on a canvas inherits its access level and is reachable through its share token. See Securing Shared Tokens.
## The canvas object
| Field | Type | Description |
|---|---|---|
| `id` | string | Canvas id |
| `name` | string | Canvas name |
| `access_scope` | string | `public` or `team` |
| `username` | string \| null | Owner's handle |
| `allow_public_read` | boolean | Whether anyone may read the canvas |
| `share_token` | string \| null | Canvas token (`fc_…`), once shared |
| `share_client_id` | string \| null | Real-time instance shared UDFs run on |
| `passcode` | string \| null | Canvas passcode, if set |
| `dashboard_body` | string \| null | Dashboard layout |
| `preview_image_url` | string \| null | Thumbnail URL |
| `udfs` | array | Full UDF records on the canvas |
| `owning_user` | object \| null | Owner summary |
| `owning_execution_environment` | object \| null | Owning environment summary |
| `last_updated` | string | Last modification timestamp |
### Lite responses
Endpoints ending in `/lite` return the same metadata but replace `udfs` (full UDF sources) with `udf_ids`, and omit `dashboard_body`, `share_client_id`, and the owner objects. Prefer the lite variants for listings — a full listing returns every UDF's source code.
## List your canvases
```
GET /collection/self
GET /collection/self/lite
```
**Scope:** user
**Query parameters**
| Parameter | Type | Description |
|---|---|---|
| `skip` | integer | Offset. Default `0`. |
| `limit` | integer | Page size. Default `300`. |
To list only canvases that have been shared:
```
GET /collection/self/shared
GET /collection/self/shared/lite
```
## List your team's canvases
```
GET /collection/exec-env
GET /collection/exec-env/lite
GET /collection/exec-env/shared
```
**Scope:** environment
Canvases owned by your execution environment. Use these with a service account token.
## Get a canvas
```
GET /collection/by-id/
```
**Scope:** public or authorized — readable with no credentials if the canvas is public; otherwise you must be the owner, in the owning environment, or a teammate.
### By name
| Endpoint | Scope | Resolves |
|---|---|---|
| `GET /collection/by-name/` | user | One of your canvases by name |
| `GET /collection/exec-env/by-slug/` | environment | One of your team's canvases by name |
| `GET /collection/by-slug//` | public or authorized | Any canvas by owner handle and name |
### By share token
```
GET /collection/by-token/
```
**Scope:** by token.
Returns a shared canvas and its UDFs. Each UDF's metadata carries a per-UDF shared token so it can be called individually.
**Query parameters**
| Parameter | Type | Description |
|---|---|---|
| `fused_session_token` | string | Session token for a team-only canvas |
If the canvas has a passcode, send it in its own header — it replaces, rather than accompanies, other authentication:
```
Authorization: Fused-Canvas-Passcode
```
## Create a canvas
```
POST /collection/new
```
**Scope:** user
**Body**
| Field | Type | Required | Description |
|---|---|---|---|
| `name` | string | Yes | Canvas name |
| `access_scope` | string | No | `public` or `team`. Default `team`. |
| `udfs` | array | No | UDFs to create on the canvas |
| `allow_public_read` | boolean | No | Allow anyone to read |
| `dashboard_body` | string | No | Dashboard layout |
| `passcode` | string | No | Canvas passcode |
| `preview_image_url` | string | No | Thumbnail URL |
## Update a canvas
```
POST /collection/by-id/
```
**Scope:** user
Takes the same fields as create; `name` is required.
Supplying `udfs` **replaces** the canvas's UDF set — UDFs absent from the request are removed. Omit `udfs` when you only mean to change metadata.
## Delete a canvas
```
DELETE /collection/by-id/
```
**Scope:** user
Returns `204 No Content`.
## Share a canvas
```
POST /collection/share
```
**Scope:** user or environment
Mints the canvas token (`fc_…`), or rotates it.
**Query parameters**
| Parameter | Type | Required | Description |
|---|---|---|---|
| `collection_id` | string | Yes | Canvas to share |
| `client_id` | string | First time only | Real-time instance shared UDFs run on. Required on the first share; returns `400` if omitted. Cannot be cleared afterwards. |
| `new_token` | boolean | No | Rotate to a fresh token. Default `false`. |
Returns the canvas object with `share_token` populated.
`new_token=true` invalidates the previous canvas token immediately. Every distributed link, embed, and integration using the old token stops working. See Token lifecycle.
### Stop sharing
```
POST /collection/unshare
```
**Scope:** user or environment
Takes `collection_id` as a query parameter and clears the canvas's share token and client id.
## Export a canvas
```
GET /collection/by-id//export-toml
```
**Scope:** public or authorized — subject to the same canvas access rules as reading it.
Returns a zip archive (`application/zip`) containing `canvas.toml` plus each UDF's source — the same layout `fused canvas pull` writes.
## Import a canvas
```
POST /collection/by-id//import-toml
```
**Scope:** user
Uploads a canvas zip as multipart form data in a `file` field. The file must be a `.zip`; other types return `400`, and oversized archives return `413`.
```bash
curl -X POST \
-H "Authorization: Bearer $FUSED_ACCESS_TOKEN" \
-F "file=@my_canvas.zip" \
"https://www.fused.io/server/v1/collection/by-id//import-toml"
```
The archive's UDFs become the canvas's **complete** UDF set — any UDF not present in the zip is deleted. This mirrors pushing a canvas folder with the CLI.
## OpenAPI for a shared canvas
A shared canvas describes itself. Once a canvas has a token, append an extension to it on `udf.ai`:
| URL | Returns |
|---|---|
| `https://udf.ai/fc_.api.json` | An OpenAPI document describing the canvas's shared UDFs as endpoints |
| `https://udf.ai/fc_.api` | A browsable Swagger UI page for that document |
This is a convenient way to hand an API consumer — or an agent — a machine-readable description of the UDFs a canvas exposes.
## Public canvases
**Scope:** public
Returns only publicly published canvases.
| Endpoint | Returns |
|---|---|
| `GET /collection/public/lite` | All public canvases, metadata only |
| `GET /collection/public` | All public canvases with full UDF sources |
| `GET /collection/public/by-id/` | One public canvas |
| `GET /collection/public/by-user//by-name/` | One public canvas by handle and name |
Prefer `/collection/public/lite` — the non-lite listing returns every UDF's source for every public canvas.
## See also
- Securing Shared Tokens — access levels, session tokens, token lifecycle
- `fused canvas` — the same operations from the CLI
- UDFs — the UDFs a canvas contains
================================================================================
## Environment
Path: rest-api/environment.mdx
URL: https://docs.fused.io/rest-api/environment
# Environment
Your **execution environment** is the container for your team's UDFs, files, and attached resources. A service account token always resolves to an environment, which makes these endpoints the natural starting point for automation.
## Get your environment
```
GET /execution-env/self
```
**Scope:** environment
Returns the environment the credentials resolve to. Useful fields:
| Field | Type | Description |
|---|---|---|
| `id` | string | Environment id |
| `name` | string | Environment name |
| `users` | array | Members of the environment |
| `buckets` | array | Attached cloud buckets |
| `github_repos` | array | Linked GitHub repositories |
## Get real-time usage
```
GET /execution-env/self/realtime/usage
```
**Scope:** environment
Call counters for the real-time engine.
**Query parameters**
| Parameter | Type | Description |
|---|---|---|
| `date_prefix` | string | Restrict to a date, as `YYYY`, `YYYY-MM`, or `YYYY-MM-DD`. Omit for cumulative totals. |
**Response**
| Field | Type | Description |
|---|---|---|
| `calls_total` | integer | All calls |
| `calls_success` | integer | Successful calls |
| `calls_error` | integer | Failed calls |
| `calls_cached` | integer | Calls served from cache |
| `calls_total_time` | integer | Total execution time, in milliseconds |
| `calls_success_time` | integer | Execution time of successful calls, in milliseconds |
| `calls_error_time` | integer | Execution time of failed calls, in milliseconds |
| `ai_calls` | integer | AI calls made |
| `date_prefix` | string \| null | The date filter applied |
```bash
curl -H "Authorization: Fused-Service-Token $FUSED_SERVICE_ACCOUNT_TOKEN" \
"https://www.fused.io/server/v1/execution-env/self/realtime/usage?date_prefix=2026-08"
```
## Service accounts
Service accounts are the long-lived machine credentials for your environment. See Service Accounts for the concepts and usage.
All four endpoints are **user-scoped** — they require a `Bearer` token. A service account token cannot manage service accounts, including its own.
### List service accounts
```
GET /execution-env/self/service-account
```
**Scope:** user
Returns an array of service account objects — `id`, `execution_environment_id`, `name`, `created_at`. Tokens are never included.
### Get a service account
```
GET /execution-env/self/service-account/by-id/
```
**Scope:** user
Returns one service account object, without its token.
### Create a service account
```
POST /execution-env/self/service-account/new
```
**Scope:** user
**Body**
| Field | Type | Required | Description |
|---|---|---|---|
| `name` | string | Yes | Name for the service account |
```bash
curl -X POST \
-H "Authorization: Bearer $FUSED_ACCESS_TOKEN" \
-H "Content-Type: application/json" \
-d '' \
"https://www.fused.io/server/v1/execution-env/self/service-account/new"
```
**Response**
| Field | Type | Description |
|---|---|---|
| `id` | string | Service account id |
| `execution_environment_id` | string | Owning environment |
| `name` | string | Name |
| `created_at` | string | Creation timestamp |
| `token` | string | The service account token |
`token` is returned **only** in this response. Store it immediately — no endpoint can retrieve it later.
### Delete a service account
```
DELETE /execution-env/self/service-account/by-id/
```
**Scope:** user
Revokes the service account and returns the deleted record.
The token stops working immediately. Anything still authenticating with it begins failing.
## See also
- Service Accounts — creating and using machine credentials
- Batch jobs — submitting and tracking long-running jobs
- Account — the signed-in user rather than the environment
================================================================================
## Files
Path: rest-api/files.mdx
URL: https://docs.fused.io/rest-api/files
# Files
These endpoints operate on cloud object storage your environment can reach — S3 and Google Cloud Storage buckets.
These endpoints do not touch the `/mnt/cache` disk, which is a separate filesystem UDFs read and write directly. See the `/mnt/cache` disk.
## Paths
Every endpoint takes a `path` query parameter, using the scheme of the underlying store:
| Scheme | Storage |
|---|---|
| `s3://` | An Amazon S3 bucket |
| `gs://` | A Google Cloud Storage bucket |
## List files
```
GET /files/list
```
**Scope:** public or authorized
Returns an array of object keys under `path`.
**Query parameters**
| Parameter | Type | Required | Description |
|---|---|---|---|
| `path` | string | Yes | Prefix to list |
| `client_id` | string | No | Environment context — see finding your `client_id` |
### With metadata
```
GET /files/list-details
```
**Scope:** public or authorized
Returns an array of objects. Accepts the same query parameters as List files.
| Field | Type | Description |
|---|---|---|
| `url` | string | Full path to the object |
| `file_name` | string | Object name |
| `is_directory` | boolean | Whether the entry is a prefix |
| `size` | integer | Size in bytes |
| `last_modified` | string | Last modification timestamp |
## Read a file
```
GET /files/get
```
**Scope:** public or authorized
Redirects (`307`) to a presigned URL valid for one hour. Follow redirects to download the bytes.
**Query parameters**
| Parameter | Type | Required | Description |
|---|---|---|---|
| `path` | string | Yes | Object to read |
| `client_id` | string | No | Environment context |
## Upload a file
```
PUT /files/upload
```
**Scope:** environment
Streams the raw request body to `path` in **S3**. Returns the resulting `s3://` URL. To upload to Google Cloud Storage, use Upload a file to GCS instead.
**Query parameters**
| Parameter | Type | Required | Description |
|---|---|---|---|
| `path` | string | Yes | Destination path |
| `content_type` | string | No | Content type to store |
| `client_id` | string | No | Environment context |
```bash
curl -X PUT \
-H "Authorization: Fused-Service-Token $FUSED_SERVICE_ACCOUNT_TOKEN" \
--data-binary @local.parquet \
"https://www.fused.io/server/v1/files/upload?path=s3%3A%2F%2Fmy-bucket%2Ffile.parquet"
```
For large files, prefer a signed upload so the bytes go straight to cloud storage.
### Upload to a scratch path
```
POST /files/upload-temp
```
**Scope:** environment
Streams the body to a server-chosen temporary path and returns it. Use this to stage an ad-hoc input without picking a destination.
**Query parameters**
| Parameter | Type | Required | Description |
|---|---|---|---|
| `extension` | string | No | File extension to give the scratch object |
| `content_type` | string | No | Content type to store |
| `client_id` | string | No | Environment context |
### Upload a file to GCS
```
PUT /files/upload-gcs
```
**Scope:** environment
Uploads to a Google Cloud Storage bucket. Unlike `PUT /files/upload`, the body is multipart form data rather than raw bytes, and `client_id` is required.
**Query parameters**
| Parameter | Type | Required | Description |
|---|---|---|---|
| `path` | string | Yes | Destination `gs://` path |
| `client_id` | string | Yes | Environment context — see finding your `client_id` |
**Body**
Multipart form data with the file in a `file_name` field.
```bash
curl -X PUT \
-H "Authorization: Fused-Service-Token $FUSED_SERVICE_ACCOUNT_TOKEN" \
-F "file_name=@local.parquet" \
"https://www.fused.io/server/v1/files/upload-gcs?path=gs%3A%2F%2Fmy-bucket%2Ffile.parquet&client_id="
```
## Delete a file or prefix
```
DELETE /files/delete
```
**Scope:** environment
Deletes one object, or every object under a prefix. Returns `true`.
**Query parameters**
| Parameter | Type | Required | Description |
|---|---|---|---|
| `path` | string | Yes | Object or prefix to delete |
| `max_deletion_depth` | integer \| string | No | Maximum prefix depth to recurse. Default `3`; pass `"unlimited"` to remove the guard. |
| `client_id` | string | No | Environment context |
Deleting a prefix removes every object beneath it up to `max_deletion_depth`. The default depth is a guardrail — raising it, and especially passing `"unlimited"`, makes it easy to delete far more than intended.
## Signed URLs
Signed URLs let a client read or write cloud storage directly, without proxying bytes through Fused. All signatures are valid for one hour.
### Sign a download
```
GET /files/sign
```
**Scope:** public or authorized
Returns a URL string for `path`.
The returned string is not always a presigned URL — for public objects it may be the plain public URL, and in some configurations a Fused-proxied URL. Treat it as an opaque URL to fetch.
### Sign an upload
```
GET /files/sign-upload
```
**Scope:** environment
Returns an S3 POST policy — `}` — that a client can post the file to directly.
**Query parameters**
| Parameter | Type | Required | Description |
|---|---|---|---|
| `path` | string | Yes | Destination path |
| `content_length` | integer | Yes | Exact size in bytes; pinned as a condition of the policy |
| `content_type` | string | No | Content type; pinned when supplied |
| `client_id` | string | No | Environment context |
A companion `GET /files/sign-upload-temp` returns a policy for a server-chosen scratch path, taking `content_length`, `extension`, and `content_type`. Its response is ``.
## Resolve a path
```
POST /files/resolve
```
**Scope:** public or authorized
Expands a Fused-managed path alias to the concrete storage URL it maps to, and validates that you may access it. Returns the resolved URL as a string.
Use this when another tool needs the real object location rather than the Fused alias.
**Query parameters**
| Parameter | Type | Required | Description |
|---|---|---|---|
| `path` | string | Yes | Path to resolve |
| `job_id` | string | No | Resolve against the storage a specific job used |
## Get a bucket policy for your own bucket
```
GET /files/s3-iam-policy
```
**Scope:** environment
Generates an S3 bucket policy granting your environment's job and real-time roles access to a bucket you own. Takes `bucket_name` and returns the policy document.
This is the policy referenced by the Amazon S3 integration setup, which is also where you attach the bucket to your environment.
The generated policy grants broad (`s3:*`) access to those roles. Narrow the actions before applying it if your bucket holds anything the UDFs should not modify.
## See also
- File storage — the storage options available to UDFs and when to use each
- `fused files` — the same operations from the CLI
- Amazon S3 integration — connecting your own bucket
================================================================================
## REST API Overview
Path: rest-api/overview.mdx
URL: https://docs.fused.io/rest-api/overview
# REST API Overview
The Fused platform API is an HTTP API. Everything the Python SDK and Workbench do goes through it, so any language that can make an HTTP request can create UDFs, run jobs, manage files, and automate Fused.
For the conceptual introduction — including the separate `udf.ai` endpoints for calling shared UDFs — see REST API in the Guide.
## Base URL
```
https://www.fused.io/server/v1
```
Every path in this reference is relative to that base URL. Requests and responses are JSON unless noted otherwise.
## Authentication
Pass credentials in the `Authorization` header. Two schemes are available:
```
Authorization: Bearer
Authorization: Fused-Service-Token
```
- **`Bearer`** — a personal access token that acts as *you*. Retrieve one from an authenticated SDK session with `fused.api.access_token()`.
- **`Fused-Service-Token`** — a long-lived machine credential that acts as your *team's environment*. See Service Accounts.
## Endpoint scopes
Each endpoint accepts one or both credential types. This reference labels every endpoint with its scope:
| Scope | Accepts | Notes |
|---|---|---|
| **User** | `Bearer` only | Acts on resources owned by the signed-in user. A service account token is rejected. |
| **Environment** | `Bearer` or `Fused-Service-Token` | Acts on your team's execution environment. Suitable for automation. |
| **User or environment** | `Bearer` or `Fused-Service-Token` | Resolves to whichever identity you present. |
| **By token** | No header — the token in the path | Authorization is carried by the canvas or UDF token in the URL. |
| **Public or authorized** | Either, or none | Public resources are readable with no credentials; reaching private ones requires them. |
| **Public** | None | No credentials required. |
"Environment" is your team's execution environment — the container for your team's UDFs, files, and quota. A service account token always resolves to an environment, never to an individual user, which is why user-scoped endpoints reject it.
## Errors
The API uses standard HTTP status codes:
| Status | Meaning |
|---|---|
| `401 Unauthorized` | Missing, malformed, or expired credentials |
| `403 Forbidden` | Authenticated, but not allowed to access this resource — including presenting a service account token to a user-scoped endpoint |
| `404 Not Found` | Resource does not exist, or you cannot see it |
| `422 Unprocessable Entity` | Request validation failed, or UDF execution failed |
Validation errors return a `detail` array identifying each offending field:
```json
]
}
```
Other errors return a `detail` string.
## Example request
```bash
curl -H "Authorization: Fused-Service-Token $FUSED_SERVICE_ACCOUNT_TOKEN" \
"https://www.fused.io/server/v1/execution-env/self"
```
## Reference
| Section | Covers |
|---|---|
| UDFs | Creating, reading, updating, and deleting UDFs |
| Canvases | Canvases, sharing, and TOML import/| Running UDFs | Executing UDFs by token, as tiles, or ad hoc |
| Batch jobs | Submitting long-running jobs, status, results, and logs |
| Files | Cloud file storage: list, upload, download, signed URLs |
| Environment | Execution environment, usage, and service accounts |
| Scheduled UDFs | Cron schedules for UDFs |
| Secrets | User secrets |
| Session tokens | Minting and revoking session tokens |
| Account | The signed-in user |
================================================================================
## Running UDFs
Path: rest-api/running-udfs.mdx
URL: https://docs.fused.io/rest-api/running-udfs
# Running UDFs
To run a UDF that lives on a shared canvas, call it on `udf.ai` — the canvas token in the URL identifies both the UDF and the caller's right to run it, so no `Authorization` header is involved. See UDFs as API for the URL structure, output formats, and tile URLs.
This page covers what the platform API adds on top: running UDF code ad hoc, and invalidating cached results.
## Run a UDF ad hoc
```
POST /realtime//api/v1/run/udf
POST /realtime//api/v1/run/udf/tiles///
```
**Scope:** user or environment — the instance named by `client_id` must belong to your environment.
Runs UDF code you send with the request, rather than a saved, shared UDF. The tiles variant folds the XYZ coordinate into the run and the cache key.
**Query parameters**
| Parameter | Type | Description |
|---|---|---|
| `cache_max_age` | integer | Maximum age in seconds of a cached result to reuse |
**Body**
| Field | Type | Description |
|---|---|---|
| `step_config` | string | JSON-serialized UDF configuration |
| `format` | string | Output format |
`step_config` is a serialized SDK object rather than a hand-written one. Generate it with the Python SDK — or call the UDF on `udf.ai`, which needs no request body at all.
The response body is the serialized UDF output. Useful response headers:
| Header | Description |
|---|---|
| `X-Fused-Metadata` | JSON with the run's `stdout`, `stderr`, and log directory |
| `X-Fused-Request-Id` | Id for this run |
### Find your `client_id`
```
GET /realtime-instance/available
```
**Scope:** user or environment
Lists the real-time instances your environment owns. Each entry includes `client_id`, `name`, `endpoint`, and `preference_rank` — use the highest-ranked entry's `client_id`.
In Python the same value is available as `fused.options.realtime_client_id`, and Workbench shows it as the kernel name.
## Invalidate cached results
```
DELETE /realtime-shared//udf-cache/by-id//delete
```
**Scope:** user or environment — requires write access to the UDF.
Clears the real-time cache for a UDF. Despite the `realtime-shared` prefix, this endpoint requires an `Authorization` header.
**Query parameters**
| Parameter | Type | Description |
|---|---|---|
| `z`, `x`, `y` | integer | Invalidate a single tile. Supply all three or none — a partial set returns `422`. |
Returns `204 No Content`. See Cache invalidation for a worked example including how to find `client_id` and `udf_id`.
### Invalidate many tiles
```
POST /realtime-shared//udf-cache/by-id//batch-delete
```
**Scope:** user or environment — requires write access to the UDF.
**Body**
| Field | Type | Required | Description |
|---|---|---|---|
| `tiles` | array | Yes | Tile coordinates, each ``. Between 1 and 50,000 entries. |
```bash
curl -X POST \
-H "Authorization: Fused-Service-Token $FUSED_SERVICE_ACCOUNT_TOKEN" \
-H "Content-Type: application/json" \
-d ', ]}' \
"https://www.fused.io/server/v1/realtime-shared//udf-cache/by-id//batch-delete"
```
**Response**
| Field | Type | Description |
|---|---|---|
| `udf_id` | string | The UDF |
| `tiles_requested` | integer | Tiles in the request after de-duplication |
| `objects_deleted` | integer | Cache objects actually removed |
## See also
- UDFs as API — URL structure and every output format
- Securing Shared Tokens — public vs team tokens and session tokens
- Cache invalidation — when and how to purge
- Batch jobs — for workloads too large for the real-time engine
================================================================================
## Scheduled UDFs
Path: rest-api/scheduled-udfs.mdx
URL: https://docs.fused.io/rest-api/scheduled-udfs
# Scheduled UDFs
A **cronjob** runs a saved UDF on a recurring schedule. Each cronjob belongs to your team's execution environment and targets one UDF by id.
The equivalent CLI is `fused cronjob`.
Scheduled UDFs run on batch compute instances, so your team needs batch compute enabled. Teams without billing enabled receive `403 Forbidden` when creating a cronjob.
## The cronjob object
| Field | Type | Description |
|---|---|---|
| `id` | string | Cronjob id |
| `name` | string | Cronjob name |
| `description` | string \| null | Optional description |
| `execution_environment_id` | string | Environment that owns the cronjob |
| `enabled` | boolean | Whether the schedule is active |
| `minute` | array<integer> | Minute (0–59). Exactly one value. |
| `hour` | array<integer> | Hours (0–23) |
| `day_of_month` | array<integer> | Days of month (1–31). Empty means every day. |
| `month` | array<integer> | Months (1–12). Empty means every month. |
| `day_of_week` | array<integer> | Days of week (0 = Sunday). Empty means every day. |
| `udf` | string | Id of the UDF to run |
| `udf_args` | object \| null | Arguments passed to the UDF on each run |
| `last_run` | string \| null | Timestamp of the most recent run |
## List cronjobs
```
GET /cronjob/get-self
```
**Scope:** user or environment
Returns an array of cronjob objects for your environment.
## Get cronjobs for a UDF
```
GET /cronjob/by-udf-id/
```
**Scope:** user or environment
Returns an array of cronjob objects scheduled for the given UDF id.
## Get a cronjob
```
GET /cronjob/by-id/
```
**Scope:** user or environment
Returns one cronjob object.
## Create a cronjob
```
POST /cronjob/create
```
**Scope:** user or environment
**Body**
| Field | Type | Required | Description |
|---|---|---|---|
| `name` | string | Yes | Cronjob name |
| `enabled` | boolean | Yes | Whether the schedule is active |
| `minute` | array<integer> | Yes | Minute (0–59), exactly one value |
| `hour` | array<integer> | Yes | Hours (0–23) |
| `day_of_month` | array<integer> | Yes | Days of month (1–31); empty for every day |
| `month` | array<integer> | Yes | Months (1–12); empty for every month |
| `day_of_week` | array<integer> | Yes | Days of week (0 = Sunday); empty for every day |
| `udf` | string | Yes | Id of the UDF to run |
| `description` | string | No | Optional description |
| `udf_args` | object | No | Arguments passed to the UDF on each run |
Run a UDF every day at 06:30 UTC:
```bash
curl -X POST \
-H "Authorization: Fused-Service-Token $FUSED_SERVICE_ACCOUNT_TOKEN" \
-H "Content-Type: application/json" \
-d '
}' \
"https://www.fused.io/server/v1/cronjob/create"
```
Returns the created cronjob object.
## Update a cronjob
```
POST /cronjob/by-id/
```
**Scope:** user or environment
All body fields are optional — send only what you want to change. Accepts the same fields as Create a cronjob.
Disable a schedule without deleting it:
```bash
curl -X POST \
-H "Authorization: Fused-Service-Token $FUSED_SERVICE_ACCOUNT_TOKEN" \
-H "Content-Type: application/json" \
-d '' \
"https://www.fused.io/server/v1/cronjob/by-id/"
```
Returns the updated cronjob object.
## Delete a cronjob
```
DELETE /cronjob/by-id/
```
**Scope:** user or environment
Unschedules the UDF. Returns the deleted cronjob object.
## Trigger a run now
```
POST /cronjob/user-run/by-id/
```
**Scope:** user or environment
Runs the cronjob's UDF immediately, without waiting for the schedule. The response contains the `cronjob` object and a `run` object describing the started job — track it with the batch job endpoints.
## See also
- `fused cronjob` — the same operations from the CLI
- Batch jobs — following a triggered run
- UDFs — finding the `udf` id to schedule
================================================================================
## Secrets
Path: rest-api/secrets.mdx
URL: https://docs.fused.io/rest-api/secrets
# Secrets
User secrets are owned by the authenticated user and follow them across execution environments. They are the REST equivalent of `fused.user_secrets`.
Values are stored encrypted and are only returned to the owning user. For how secrets work and when to use user secrets versus team secrets, see Secrets management.
All endpoints on this page are **user-scoped** — they require a `Bearer` token and reject service account tokens. User secrets require a paid plan; on the basic tier these endpoints return `403 Forbidden`.
## List secret keys
```
GET /secrets/self/user
```
Returns the keys only — never the values.
```json
```
## Get a secret value
```
GET /secrets/self/user/
```
```json
```
Returns `404 Not Found` if the key does not exist.
## Create a secret
```
POST /secrets/self/user
```
**Body**
| Field | Type | Required | Description |
|---|---|---|---|
| `key` | string | Yes | Secret name |
| `value` | string | Yes | Secret value |
```bash
curl -X POST \
-H "Authorization: Bearer $FUSED_ACCESS_TOKEN" \
-H "Content-Type: application/json" \
-d '' \
"https://www.fused.io/server/v1/secrets/self/user"
```
Returns `201 Created` with ``. If the key already exists, returns `409 Conflict` — use Create or update instead.
## Create or update a secret
```
PUT /secrets/self/user/
```
**Body**
| Field | Type | Required | Description |
|---|---|---|---|
| `value` | string | Yes | Secret value |
Upserts the key, whether or not it already exists.
```bash
curl -X PUT \
-H "Authorization: Bearer $FUSED_ACCESS_TOKEN" \
-H "Content-Type: application/json" \
-d '' \
"https://www.fused.io/server/v1/secrets/self/user/OPENAI_API_KEY"
```
Returns ``.
## Delete a secret
```
DELETE /secrets/self/user/
```
Returns ``.
## See also
- Secrets management — user secrets vs team secrets, and how they are secured
- `fused.user_secrets` — the Python equivalent
- `fused secrets` — the CLI equivalent
================================================================================
## Session tokens
Path: rest-api/tokens.mdx
URL: https://docs.fused.io/rest-api/tokens
# Session tokens
A **session token** is a short-lived credential that lets an external caller reach a UDF on a team-only canvas. Your backend mints one and passes it to the browser as the `fused_session_token` query parameter on the UDF URL.
For the full embed pattern, see Securing Shared Tokens.
## Mint a session token
```
POST /session-token/by-access-token/
```
**Scope:** user or environment
`` is the canvas token (`fc_…`) of the canvas you are granting access to. URL-encode it if it contains slashes — name-based tokens take the form `fc_/`.
**Body**
| Field | Type | Required | Description |
|---|---|---|---|
| `ttl` | integer | No | Lifetime in seconds. Defaults to `3600`; maximum `86400` (24 hours). |
```bash
curl -X POST \
-H "Authorization: Fused-Service-Token $FUSED_SERVICE_ACCOUNT_TOKEN" \
-H "Content-Type: application/json" \
-d '' \
"https://www.fused.io/server/v1/session-token/by-access-token/fc_abcdef1234567890"
```
**Response**
| Field | Type | Description |
|---|---|---|
| `token` | string | The canvas token the session token is bound to |
| `session_token` | string | The session token to pass as `fused_session_token` |
| `expires_at` | string | Expiry timestamp |
Returns `404 Not Found` if the canvas token does not exist — for example after the token was rotated. See Token lifecycle.
## Revoke session tokens
```
DELETE /session-token/by-access-token/
```
**Scope:** user or environment
Revokes **all** session tokens issued for that canvas token — not just one. Returns `204 No Content`.
Any embed or client still using a revoked session token stops working immediately. Mint replacements before revoking.
## See also
- Securing Shared Tokens — public vs team access and the session-token embed flow
- Tokens & endpoints — canvas tokens and UDF URLs
- Overview — Authentication — the credentials that authenticate you to the API
================================================================================
## UDFs
Path: rest-api/udfs.mdx
URL: https://docs.fused.io/rest-api/udfs
# UDFs
A UDF record holds the Python source (`udf_body`), a slug, and its placement on a canvas. These endpoints manage the records; to *execute* a UDF see Running UDFs.
## The UDF object
| Field | Type | Description |
|---|---|---|
| `id` | string | UDF id |
| `slug` | string | URL-safe name, unique within a canvas |
| `udf_body` | string | The UDF source and metadata |
| `collection_id` | string \| null | Canvas the UDF belongs to |
| `collection_name` | string \| null | Canvas name |
| `is_visible` | boolean | Whether the UDF is shown on its canvas |
| `position` | integer | Ordering on the canvas |
| `udf_body_hash` | string | Hash of `udf_body`, for change detection |
| `last_updated` | string | Last modification timestamp |
| `owning_user` | object \| null | Owner summary |
## List your UDFs
```
GET /udf/self
```
**Scope:** user
**Query parameters**
| Parameter | Type | Description |
|---|---|---|
| `skip` | integer | Offset. Default `0`. |
| `limit` | integer | Page size. Default `300`. |
## List your team's UDFs
```
GET /udf/exec-env/self
```
**Scope:** environment
Every UDF in your execution environment. Accepts the same query parameters. This is the listing to use with a service account token.
## Get a UDF
```
GET /udf/by-id/
```
**Scope:** public or authorized — public UDFs are readable with no credentials; private ones require access.
Returns the UDF object.
### By name
Several addressing schemes resolve a UDF without knowing its id:
| Endpoint | Scope | Resolves |
|---|---|---|
| `GET /udf/exec-env/self/by-collection//by-slug/` | environment | A UDF on one of your team's canvases |
| `GET /udf/by-user-handle//by-collection//by-slug/` | user or environment | A UDF owned by a user, addressed by handle |
| `GET /udf/by-user-email//by-collection//by-slug/` | user or environment | The same, addressed by email |
Each has a variant without `/by-collection/` that resolves the slug on the owner's default canvas.
### By shared token
```
GET /udf/shared/by-token/
```
**Scope:** by token.
Returns the UDF a shared token points at. This is how `fused.load("fsh_…")` resolves a token to code.
## Create a UDF
```
POST /udf/new
```
**Scope:** user
**Body**
| Field | Type | Required | Description |
|---|---|---|---|
| `slug` | string | Yes | URL-safe name |
| `udf_body` | string | Yes | The UDF source and metadata |
| `udf_type` | string | Yes | Use `auto` |
| `collection_id` | string | No | Canvas to add the UDF to |
| `create_shared_token` | boolean | No | Also mint a shared token. Default `false`. |
| `shared_token_access_scope` | string | No | `public` or `team`. Default `team`. |
Returns the created UDF object; when `create_shared_token` is `true` it also includes `shared_token`.
## Update a UDF
```
POST /udf/by-id/
```
**Scope:** user
Send only the fields you want to change: `slug`, `udf_body`, or `collection_id`. Returns the updated UDF object.
## Delete a UDF
```
DELETE /udf/by-id/
```
**Scope:** user
Deleting a UDF breaks any shared token or URL pointing at it. Cached results are not served after deletion.
## See also
- Running UDFs — executing what you create here
- Canvases — the canvas a UDF belongs to
- Write UDFs securely — access control and sharing
================================================================================
# WORKBENCH
## AI Chat
Path: workbench/ai-assistant.mdx
URL: https://docs.fused.io/workbench/ai-chat
# AI Chat
The AI Chat is a tool that allows you to use AI to help you code directly in the Workbench.
Watch our playlist of Vibe Coding for more examples!
### Get Started with the AI Chat
1. Open the AI Chat tab
2. Type your prompt! (Or click the "microphone" icon to directly speak your prompt!)
3. See your results! (or press Shift + Enter if it didn't auto run)
### What it can help you with
AI Chat sees all the UDFs you have open in Workbench. So AI Chat can help you:
- Fix your queries
- Create code to load data you don't know how to load
### Tips & Tricks
- Ask as specific questions as possible. The more precise your query, the more likely you are to get a response you like.
- Try out the suggestions! Our models auto suggest what you could do next based on all your code
- Ask crazy things you don’t know how to do!
- Come back tomorrow, we'll most certainly have some new stuff! 🧑💻
### Personalize your AI Chat
Pass a custom prompt to the AI Chat based on your preferences:
- Click the ⚙️ icon in the top right corner
- Add your custom prompt
- Click "Save"
Examples of custom prompts:
```text
I'm a data scientist familiar with Python, don't put comments for basic code
```
```text
Use DuckDB for most queries whenever possible rather than Pandas
```
### Examples
- See how we're using AI to build a climate dashboard
- Creating Interactive charts with AI
- Ask AI to help you configure sharable HTML maps
================================================================================
## Adding a Map to your App (Legacy)
Path: workbench/app-builder/add-a-map.mdx
URL: https://docs.fused.io/workbench/app-builder/app-map
App Builder is deprecated and hidden by default. You can re-enable it under Workbench Preferences → **Deprecated features**.
For many geospatial applications you will want to add a map to your Fused App, especially if your UDF returns a Map `Tile`.
This section shows a few examples of how you can do that. While we do recommend you use `pydeck` (the Python implementation of deck.gl) for its versatility, you can use other options like `folium`
Note that you need to install dependencies with `micropip` inside your Fused app. More on this here.
## Pydeck
Create a pydeck GeoJsonLayer that plots a simple GeoDataFrame.
You can find this app right here and test it for yourself!
Here's what this would look like:
[Image: ImgStdout]
```python showLineNumbers
# installing pydeck & geopandas inside Fused app
await micropip.install(['pydeck', 'geopandas'])
st.write("# Hello World! 👋")
st.write("Here's a simple example of a Fused app plotting NYC metro stations")
DATASET = 'https://raw.githubusercontent.com/python-visualization/folium-example-data/main/subway_stations.geojson'
gdf = gpd.read_file(DATASET)
# We buffer the points to make them more visible on our map
gdf.geometry = gdf.geometry.buffer(0.001)
# Creating an empty pydeck element
deck = st.empty()
# Initiating pydeck element with view over NYC
view_state = pdk.ViewState(
latitude=40.73,
longitude=-73.96,
zoom=10,
pitch=0
)
# Creating a GeoJSON layer with our GeoDataFrame
geojson_layer = pdk.Layer(
'GeoJsonLayer',
gdf,
)
updated_deck = pdk.Deck(
layers=[geojson_layer],
initial_view_state=view_state,
map_style='mapbox://styles/mapbox/light-v9'
)
deck.pydeck_chart(updated_deck)
```
Read more about how to use Pydeck on their official documentation.
This example shows how to plot a `GeoDataFrame` directly, but you could swap this out for a UDF that returns a `GeoDataFrame` too:
```python showLineNumbers
# DATASET = 'https://raw.githubusercontent.com/python-visualization/folium-example-data/main/subway_stations.geojson'
# gdf = gpd.read_file(DATASET)
# highlight-next-line
gdf = fused.run("YOUR_UDF_RETURNING_A_GDF")
```
Read more about `fused.run` in the `fused.run` reference
## Folium
Create a streamlit-folium `TileLayer` that calls a UDF HTTPS endpoint. Replace `fc_` and `my_udf` with your canvas token and UDF name.
```python showLineNumbers
from streamlit_folium import st_folium
m = folium.Map(location=[22.5, -115], zoom_start=4)
url_raster = 'https://udf.ai/fc_/my_udf/run/tiles///?=png'
folium.raster_layers.TileLayer(tiles=url_raster, attr='fu', interactive=True,).add_to(m)
st_folium(m)
```
================================================================================
## App Builder (Legacy)
Path: workbench/app-builder/app-builder.mdx
URL: https://docs.fused.io/workbench/app-builder/app-builder
App Builder is deprecated and hidden by default. You can re-enable it under Workbench Preferences → **Deprecated features**.
Learn everything there is about Fused Apps
================================================================================
## App Builder Overview (Legacy)
Path: workbench/app-builder/app-overview.mdx
URL: https://docs.fused.io/workbench/app-builder/app-overview
# App Builder Overview
App Builder is deprecated and hidden by default. You can re-enable it under Workbench Preferences → **Deprecated features**.
The App Builder is an IDE to transform User Defined Functions (UDFs) into interactive, shareable apps.
Data scientists often need to make analytics interactive and accessible to broader audiences. However, building traditional React apps with maps and widgets can be impractical, especially considering prototypes might be discarded. Additionally, frontend frameworks are not well-suited for transforming data or handling large datasets.
With this in mind, the App Builder enables users to build and run apps with serverless Streamlit, an open source framework to deliver dynamic data apps with just a few lines of Python. These are some of its capabilities to keep in mind:
- Build apps
- Install dependencies
- Troubleshoot
- Call UDFs and cache responses
- Share live apps
## Build apps
You build apps by writing Python in the code editor, shown below. As you write code you'll notice the app automatically reruns as code and widgets change (configurable in the preferences).
You may add input widgets that interact with UDFs, display data with data and text elements, and structure the app with layout components.
Replace `fc_` with your canvas token to load the app.
Try running the code snippets below to acquaint yourself with the App Builder.
```python showLineNumbers
# doctest: skip
st.write("Hello, *Fused!* :rocket:")
```
## Dependencies
To set Python packages for your app, only packages compatible with Pyodide are supported. Please get in touch if you need help with a specific package.
You may also choose to install dependencies at runtime to reduce start-up time. Use micropip to install packages at runtime.
```python showLineNumbers
await micropip.install(["geopandas", "mercantile"])
```
## Write UDFs
You may define UDFs directly in the App Builder's code editor and call them with `udf()`. This snippet creates a UDF that returns a `DataFrame` with a column of zeros with a length determined by a slider widget.
```python showLineNumbers
# doctest: skip
count = st.slider("Count", 1, 10, 4)
@fused.udf
def udf(count: int = 1):
return pd.DataFrame()
df = udf(count=count)
st.write(df)
```
You may also run the UDF on a remote worker by passing `engine='remote'` when calling it.
```python showLineNumbers
# doctest: skip
df = udf(count=count, engine='remote')
```
## Call UDFs
Apps may call UDFs and load their output into memory. This enables them to run resource-intensive operations and use libraries unsupported by Pyodide. These snippets illustrate a few ways to call UDFs.
### With `fused.load`
Load a UDF by name with `fused.load` and call it with parameters from a slider.
```python showLineNumbers
threshold = st.slider("Count filter", 0, 400, 25)
my_udf = fused.load('my_udf') # use your UDF name
df = my_udf(count=threshold)
```
### HTTPS endpoints
Call UDF HTTPS endpoints with the requests library and pass parameters from a dropdown selectbox. Replace `fc_` and `my_udf` with your canvas token and UDF name.
```python showLineNumbers
city = st.selectbox("Select city", ("Boston", "Paris", "New York"))
url = f"https://udf.ai/fc_/my_udf?format=geojson&city="
response = requests.get(url)
st.json(response.json())
```
Render the raster response of UDFs as images.
```python showLineNumbers
st.image('https://udf.ai/fc_/my_udf/run/tiles/11/583/787?=png')
```
## Caching
It can be helpful to cache the response of UDF calls. To cache a function in Streamlit, decorate it with `@st.cache_data`.
```python showLineNumbers
my_udf = fused.load('my_udf') # use your UDF name
@st.cache_data
def cached_output():
return my_udf()
df = cached_output()
st.write(my_udf())
```
## Share
The App Builder settings menu includes options to generate a URL to share the app or embed it with an `